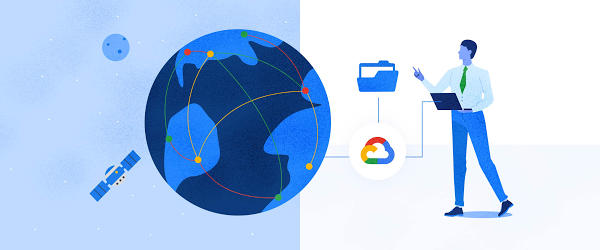
Over the years, vast amounts of satellite data have been collected and ever more granular data are being collected everyday. Until recently, those data have been an untapped asset in the commercial space. This is largely because the tools required for large scale analysis of this type of data were not readily available and neither was the satellite imagery itself. Thanks to Earth Engine, a planetary-scale platform for Earth science data & analysis, that is no longer the case.
The platform, which was recently announced as a generally available Google Cloud Platform (GCP) product, now allows commercial users across industries to operationalize remotely sensed data. Some Earth Engine use cases that are already being explored include sustainable sourcing, climate risk detection, sustainable agriculture, and natural resource management. Developing spatially focused solutions for these use cases with Earth Engine unlocks distinct insights for improving business operations. Automating those solutions produces insights faster, removes toil and limits the introduction of error.
The automated data pipeline discussed in this post brings data from BigQuery into Earth Engine and is in the context of a sustainable sourcing use case for a fictional consumer packaged goods company, Cymbal. This use case requires two types of data. The first is data that Cymbal already has and the second is data that is provided by Earth Engine and the Earth Engine Data Catalog. In this example, the data owned by Cymbal is starting in BigQuery and flowing through the data pipeline into Earth Engine through an automated process.
A helpful way to think about combining these data is as a layering process, similar to assembling a cake. Let’s talk through the layers for this use case. The base layer is satellite imagery, or raster data, provided by Earth Engine. The second layer is the locations of palm plantations provided by Cymbal, outlined in black in the image below. The third and final layer is tree cover data from the data catalog, the pink areas below. Just like the layers of a cake, these data layers come together to produce the final product. The goal of this architecture is to automate the aggregation of the data layers.
Another example of a use case where this architecture could be applied is in a methane emission detection use case. In that case, the first layer would remain the same. The second layer would be facility location details (i.e. name and facility type) provided by the company or organization. Methane emission data from the data catalog would be the third layer. As with methane detection and sustainable supply chain, most use cases will involve some tabular data collected by companies or organizations. Because the data are tabular, BigQuery is a natural starting point. To learn more about tabular versus raster data and when to use BigQuery versus Earth Engine, check out this post.
Now that you understand the potential value of using Earth Engine and BigQuery together in an automated pipeline, we will go through the architecture itself. In the next section, you will see how to automate the flow of data from GCP products, like BigQuery, into Earth Engine for analysis using Cloud Functions. If you are curious about how to move data from Earth Engine into BigQuery you can read about it in this post.
Architecture Walkthrough
Cymbal has the goal of gaining more clarity in their palm oil supply chain which is primarily located in Indonesia. Their specific goal is to identify areas of potential deforestation. In this section, you will see how we can move the data Cymbal already has about the locations of palm plantations into Earth Engine in order to map those territories over satellite images to equip Cymbal with information about what is happening on the ground. Let’s walk through the architecture step by step to better understand how all of the pieces fit together. If you’d like to follow along with the code for this architecture, you can find it here.
Architecture
Step by Step Walkthrough
1. Import Geospatial data into BigQuery Cymbal’s Geospatial Data Scientist is responsible for the management of the data they have about the locations of palm plantations and how it arrives in BigQuery.
2. A Cloud Scheduler task sends a message to a Pub/Sub topic A Cloud Scheduler task is responsible for starting the pipeline in motion. Cloud Scheduler tasks are cron tasks and can be scheduled at any frequency that fits your workflow. When the task runs it sends a message to a Pub/Sub topic.
3. The Pub/Sub topic receives a message and triggers a Cloud Function
4. The first Cloud Function transfers the data from BigQuery to Cloud Storage The data must be moved into Cloud Storage so that it can be used to create an Earth Engine asset.
5. The data arrives in the Cloud Storage bucket and triggers a second Cloud Function
6. The second Cloud Function makes a call to the Earth Engine API and creates an asset in Earth Engine The Cloud Function starts by authenticating with Earth Engine. It then makes an APIcall creating an Earth Engine asset from the Geospatial data that is in Cloud Storage.
7. AnEarth Engine App (EE App) is updated when the asset gets created in Earth Engine This EE App is primarily for the decision makers at Cymbal who are primarily interested in high impact metrics. The application is a dashboard giving the user visibility into metrics and visualizations without having to get bogged down in code.
8. A script for advanced analytics is made accessible from the EE App An environment for advanced analytics in the Earth Engine code editor is created and made available through the EE App for Cymbal’s technical users. The environment gives the technical users a place to dig deeper into any questions that arise from decision makers about areas of potential deforestation.
9. Results from analysis in Earth Engine can be exported back to Cloud Storage When a technical user is finished with their further analysis in the advanced analytics environment they have the option to run a task and export their findings to Cloud Storage. From there, they can continue their workflow however they see fit.
With these nine high-level steps, an automated workflow is achieved that provides a solution for Cymbal, giving them visibility into their palm oil supply chain. Not only does the solution address the company wide goal, it also keeps in mind the needs of various types of users at Cymbal.
Summary
We’ve just walked through the architecture for an automated data pipeline from BigQuery to Earth Engine using Cloud Functions. The best way to deepen your understanding of this architecture and how all of the pieces fit together is to walk through building the architecture in your own environment. We’ve made building out the architecture easy by providing a Terraform Script available on GitHub. Once you have the architecture built out, try swapping out different elements of the pipeline to make it more applicable to your own operations. If you are looking for some inspiration or are curious to see another example, be sure to take a look at this post which brings data from Earth Engine into BigQuery. The post walks through creating a Cloud Function that pulls temperature and vegetation data from the Landsat satellite imagery within the GEE Catalog from SQL in BigQuery. Thanks for reading.
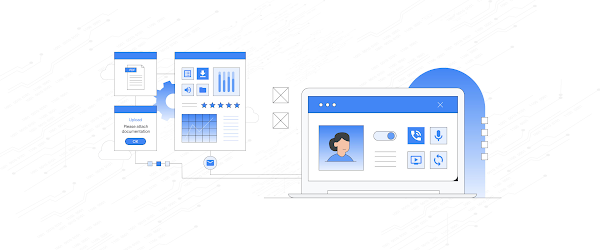
Customers reach out to contact centers for help in moments of urgent need, but due to increasing demands, new channels, peak times, and operational pressures, contact centers often struggle to provide timely help. To bridge this gap, enterprises are increasingly investing in AI-driven solutions that balance addressing customer expectations with operational efficiency.
But building and generating value from such solutions can be complicated and challenging. Google Cloud built Contact Center AI (CCAI) to streamline and shorten this time to value, and CCAI Platform, our newest addition, takes a crucial step in this effort by introducing end-to-end call center capabilities. After debuting these new capabilities in March, we are excited to announce that CCAI Platform is now generally available across the US, Canada, UK, Germany, France, and Italy—with more markets soon to come!
Delivering world-class customer experiences and accelerating time-to-value with CCAI
CCAI encompasses a comprehensive set of offerings to address the top pain points of the three main user groups in the contact center: contact center owners, their agents, and the customers they serve.
Dialogflow lets the contact center manager scale their operations while balancing cost and customer satisfaction, including reducing painful, long waiting times endured by end users. Using Dialogflow, contact center managers can build complex chat and voice virtual agents—a proven, cost-effective way to scale contact centers while continuing to provide great customer experiences. Available 24/7, without any waiting queue, these virtual agents can converse naturally with customers, identify their issues, and address them effectively.
Agent Assist reduces overall handling time and coaches human agents to become more effective and helpful. The service uses AI to “listen” to the voice and chat conversations between the human representative and the customer, then provides real-time guidance and recommendations to the agent, based on historical conversations, knowledge bases, and best practices of experienced agents. It also automates post-call actions such as transcription and call summarization, saving significant time and overhead at the end of every call.
CCAI Insights stores and analyzes all the customer conversations in the contact center, whether with human or virtual agents, to provide leaders with real-time, actionable data points on customer queries, agent performance, sentiment trends, and opportunities for automation.
At the heart of these technologies is our conversational AI brain. It uses Google Research’s technology to talk, understand, and interact, enabling and orchestrating high-quality conversational experiences at scale.
CCAI Platform: a modern CCaaS and the shortest path to CCAI value
While the value of the CCAI offerings is clear to our customers, we also hear from them that integrating these solutions with legacy infrastructure takes too long.
To minimize these integration difficulties, accelerate time-to-value using the CCAI offerings, and help businesses provide outstanding customer experiences, we’re pleased to announce the general availability of CCAI Platform, the Contact Center as a Service (CCaaS) solution from Google Cloud built in partnership with UJET.
Turnkey core Contact Center capabilities out-of-the-box, for faster time to production, lower implementation overhead, and custom development needed
AI-powered experiences, from routing to better handling customer interactions
Deep integration with CCAI’s offerings, to provide a unified end-to-end experience for contact center transformation
Mobile-first design that enables interactions in line with the way people expect to communicate across channels
CRM-centered design with automated updates, so agents can focus on the customer
Deployment flexibility, with customer data residing in their CRM and the flexibility to bring their own telephony carrier to minimize cost
All of this is available without the typical need to integrate complex technologies from multiple providers.
“With Google Cloud and CCAI Platform, we will quickly move our contact center to the cloud, supporting both our customers and agents with industry-leading CX innovations, all while streamlining operations through more efficient customer care operations,” said Dean Kontil, Division CIO of KeyBank.
For customers looking to change platforms for a cloud-native CCaaS with deep Google AI integrations, CCAI Platform offers end-to-end capabilities that accelerate call center transformations. We also remain strongly committed to customer choice, and customers will continue to have the option to integrate our latest and greatest CCAI offerings through our existing OEM partners.
The Contact Center conversation is just beginning
This launch is part of a broader effort to deliver more value, faster, to more CCAI customers. As companies replace interactive voice response (IVR) with intelligent virtual agents (IVA) and begin to collect and analyze data, use cases are likely to grow more sophisticated—which is one reason Google Cloud is continuing to invest in technologies to make our CCAI offerings even more useful, as well as best practices like the following:
CCAI Agent Assist and Insights are a great first step in AI transformation. They let contact center owners enable call transcription and use Topic Modeling to identify conversation themes that demand attention. Human agents can automatically generate high-quality conversation summaries to reduce call wrap-up time, and the associated costs, while improving business insights. We are working to make these features available both in CCAI Platform and with our partner ISVs.
Chat and call steering are the first step for IVA automation. Another area of broad impact is conversational chat or call steering, in which friction is reduced by routing customers to the correct virtual or live agent experience. Many call centers rely on IVR systems in which customers have to use a keypad to select an option. Enterprise leaders tell us that attrition is very high throughout this process: some customers angrily hang up without resolution and, just as bad, many simply pound a single key in hopes of reaching a human agent, leading to the customer reaching the wrong person because their issue was never correctly identified or routed. Using Dialogflow’s natural language understanding (NLU) capabilities can sweep away such problems, with the customer more likely to not only reach the appropriate resources, but also share conversational data from which insights can be gleaned. It’s an approach that can pay dividends right away, and a quick first step to IVA automation.
In coming months, we will continue to work on these and other capabilities that are targeted to deliver higher and quicker value to our customers. We plan to release pre-built components to help companies tackle call center use cases in specific industries, for example. We’ll also continue to partner with companies that share our vision of transforming customer experiences with AI, such as TTEC, a provider of customer experience technology and software.
“TTEC Digital and Google Cloud have a shared vision for transforming global CX delivery through artificial intelligence, digital innovation, and operational excellence,” said Sam Thepvongs, VP of TTEC Digital. “With CCAI Platform, we can offer our largest enterprise customers a strategic blueprint for moving to the cloud while adopting a leading, AI-powered contact center platform. We couldn’t be more excited about this evolution of Google Cloud’s groundbreaking CCAI portfolio, and the opportunity to help our customers digitally transform their CX through this partnership.”
Ever since the Oakland A’s switched their recruitment policy from a players’ running speed and strength to a more sophisticated and nuanced look at the on-base slugging percentage, the world of sports has become more and more accustomed to utilizing sports analytics in their team-building.
Such was Billy Beane’s and his team’s success that a book, Moneyball, and a film followed as sports teams switched their focus to analyzing how a player performed metrics vital to their role in the team and, based on their findings, signing the players which best fit these parameters rather than going for the more highly fancied, and often more expensive, names. It worked. With a budget one-third of their more glamorous rivals, the A’s reached the playoffs in back-to-back seasons, and everyone sat up and took note. Even tennis has gotten involved with The Guardian announcing Wimbledon would be using big data to enrich spectator’s experience this year.
Formula 1 has also embraced analytics. After all, at its heart, it is a sport all about stats – the fastest car wins! But they have been doing so a lot longer than most other sports. Back in the 1980s, teams were using telemetry to stream information from the car to the pit team. But any one car can be transmitting millions of points of data from dozens of sensors over a race weekend, all being checked and analyzed by the pit team in real-time, who can react accordingly to this constant flow of information. For example, the Mercedes AMG F1 W08 EQ Power + is rammed with 200 sensors, while Red Bull’s RB12 tech team are analyzing data from some 10,000 different parts. At one US Formula 1 Grand Prix, it was estimated nearly as much data was transmitted by the competing teams as is stored in the US Library of Congress! ‘It’s not about big data,’ said Christian Dixon at Mercedes back in 2017, ‘it’s about the right data.’
While most race fans will only be interested in mph and pit stop times, the cars team, both trackside and at HQ, will be minutely examining the temperature of the brakes and tires, pressures, air flow, cornering speed, biometric data of the driver and looking for ways to eke out another 0.1% of performance improvement. Even having advance warning of damp conditions midway through the race could enable the team to factor in an earlier wheel change than they would have liked to anticipate the wetter track, perhaps knocking a second or two off the driver’s time and all those saved seconds do mount up and do make a difference.
Lewis Hamilton is very keen on data and would often talk with the technical team about weather conditions, track conditions and recent performances as part of the preparation for the next race. Hamilton, of course, is still a top driver, although he is unlikely to get that record-breaking eighth world title, as he currently trails Max Verstappen in the current Ladbrokes Formula 1 odds. Much like Wimbledon, Verstappen’s Red Bull team look to involve their fans more by providing them with the latest statistics and behind-the-scenes access across its website and social media channels.
Beane’s data revolution has spread across all sports in the last 20 years and, as we have seen now, reaches out to improve fans’ experience of their favorite sport. Who knows how it will change sports over the next 20 years?
Data is critical for any organization to build and operationalize a comprehensive analytics strategy. For example, each transaction in the BFSI (Banking, Finance, Services, and Insurance) sector produces data. In Manufacturing, sensor data can be vast and heterogeneous. Most organizations maintain many different systems, and each organization has unique rules and processes for handling the data contained within those systems.
Google Cloud provides end-to-end data cloud solutions to store, manage, process, and activate data starting with BigQuery. BigQuery is a fully managed data warehouse that is designed for running analytical processing (OLAP) at any scale. BigQuery has built-in features like machine learning, geospatial analysis, data sharing, log analytics, and business intelligence. MongoDB is a document-based database that handles the real-time operational application with thousands of concurrent sessions with millisecond response times. Often, curated subsets of data from MongoDB are replicated to BigQuery for aggregation and complex analytics and to further enrich the operational data and end-customer experience. As you can see, MongoDB Atlas and Google Cloud BigQuery are complementary technologies.
Introduction to Google Cloud Dataflow
Dataflow is a truly unified stream and batch data processing system that’s serverless, fast, and cost-effective. Dataflow allows teams to focus on programming instead of managing server clusters as Dataflow’s serverless approach removes operational overhead from data engineering workloads. Dataflow is very efficient at implementing streaming transformations, which makes it a great fit for moving data from one platform to another with any changes in the data model required. As part of Data Movement with Dataflow, you can also implement additional use cases such as identifying fraudulent transactions, real-time recommendations, etc.
Announcing new Dataflow Templates for MongoDB Atlas and BigQuery
Customers have been using Dataflow widely to move and transform data from Atlas to BigQuery and vice versa. For this, they have been writing custom code using Apache Beamlibraries and deploying it on the Dataflow runtime.
To make moving and transforming data between Atlas and BigQuery easier, the MongoDB and Google teams worked together to build templates for the same and make them available as part of the Dataflow page in the Google Cloud console. Dataflow templates allow you to package a Dataflow pipeline for deployment. Templates have several advantages over directly deploying a pipeline to Dataflow. The Dataflow templates and the Dataflow page make it easier to define the source, target, transformations, and other logic to apply to the data. You can key in all the connection parameters through the Dataflow page, and with a click, the Dataflow job is triggered to move the data.
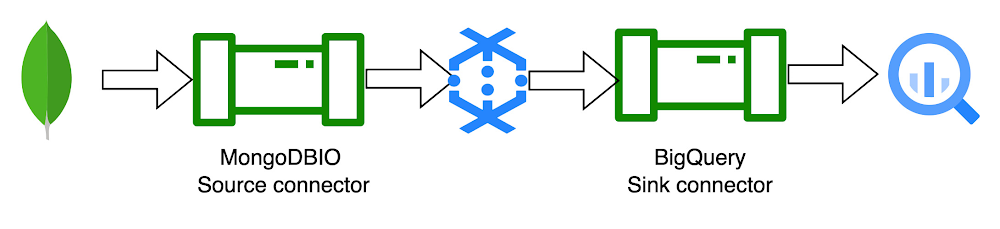
To start with, we have built three templates. Two of these templates are batch templates to read and write from MongoDB to BigQuery and vice versa. And the third is to read the change stream data pushed on Pub/Sub and write to BigQuery. Below are the templates for interacting with MongoDB and Google Cloud native services currently available:
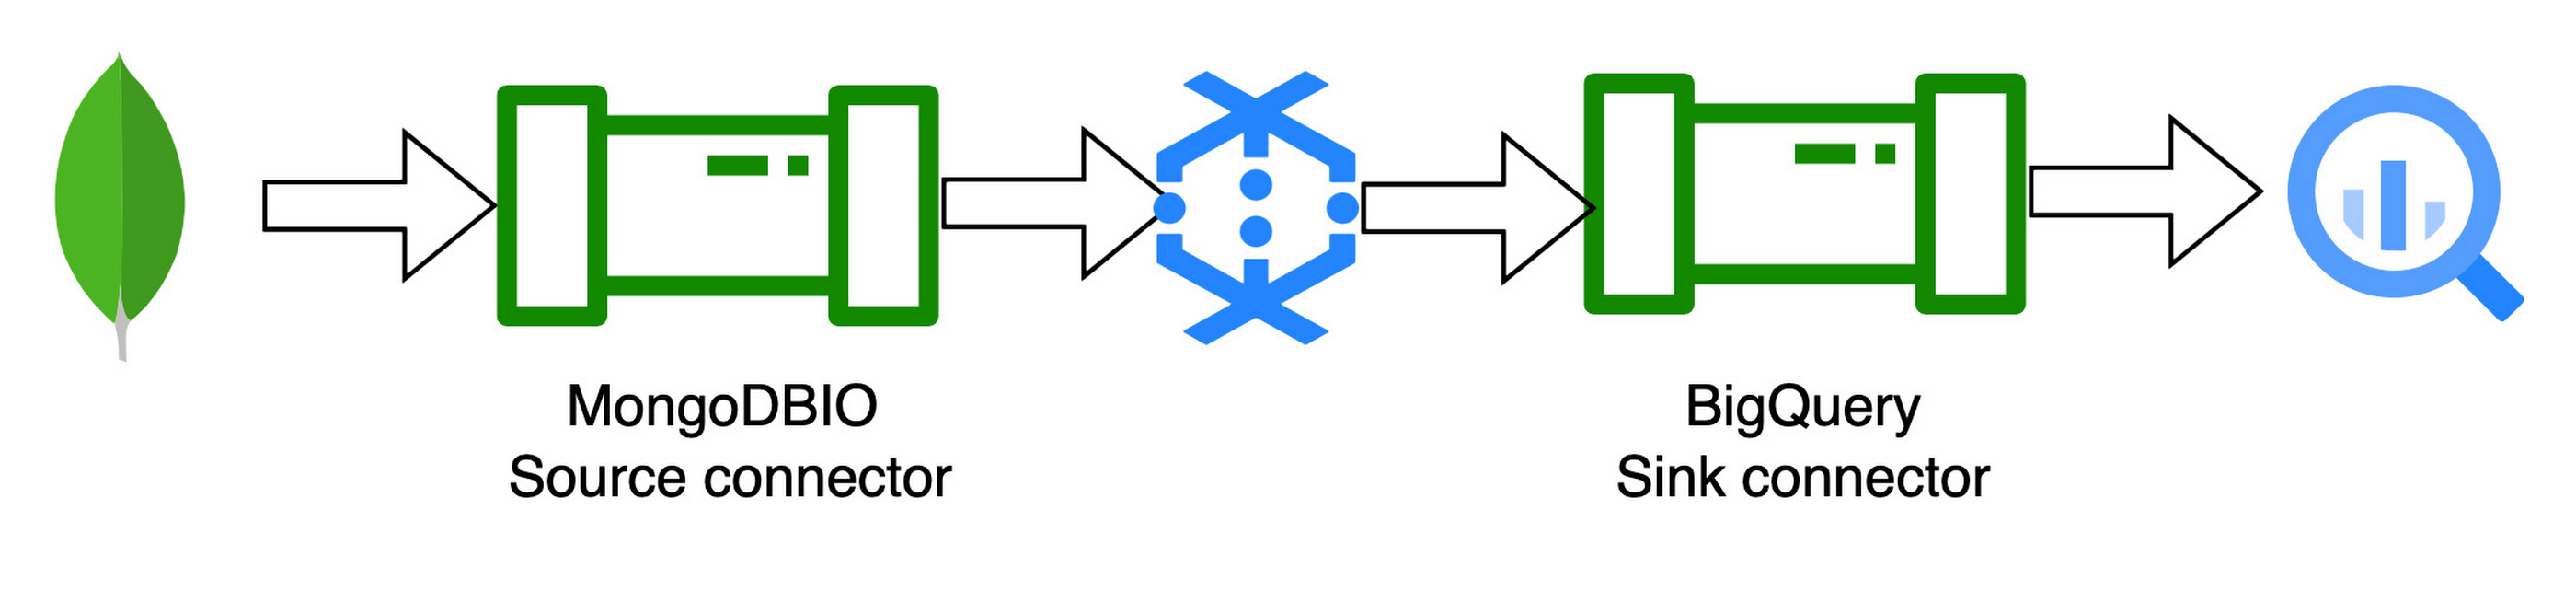
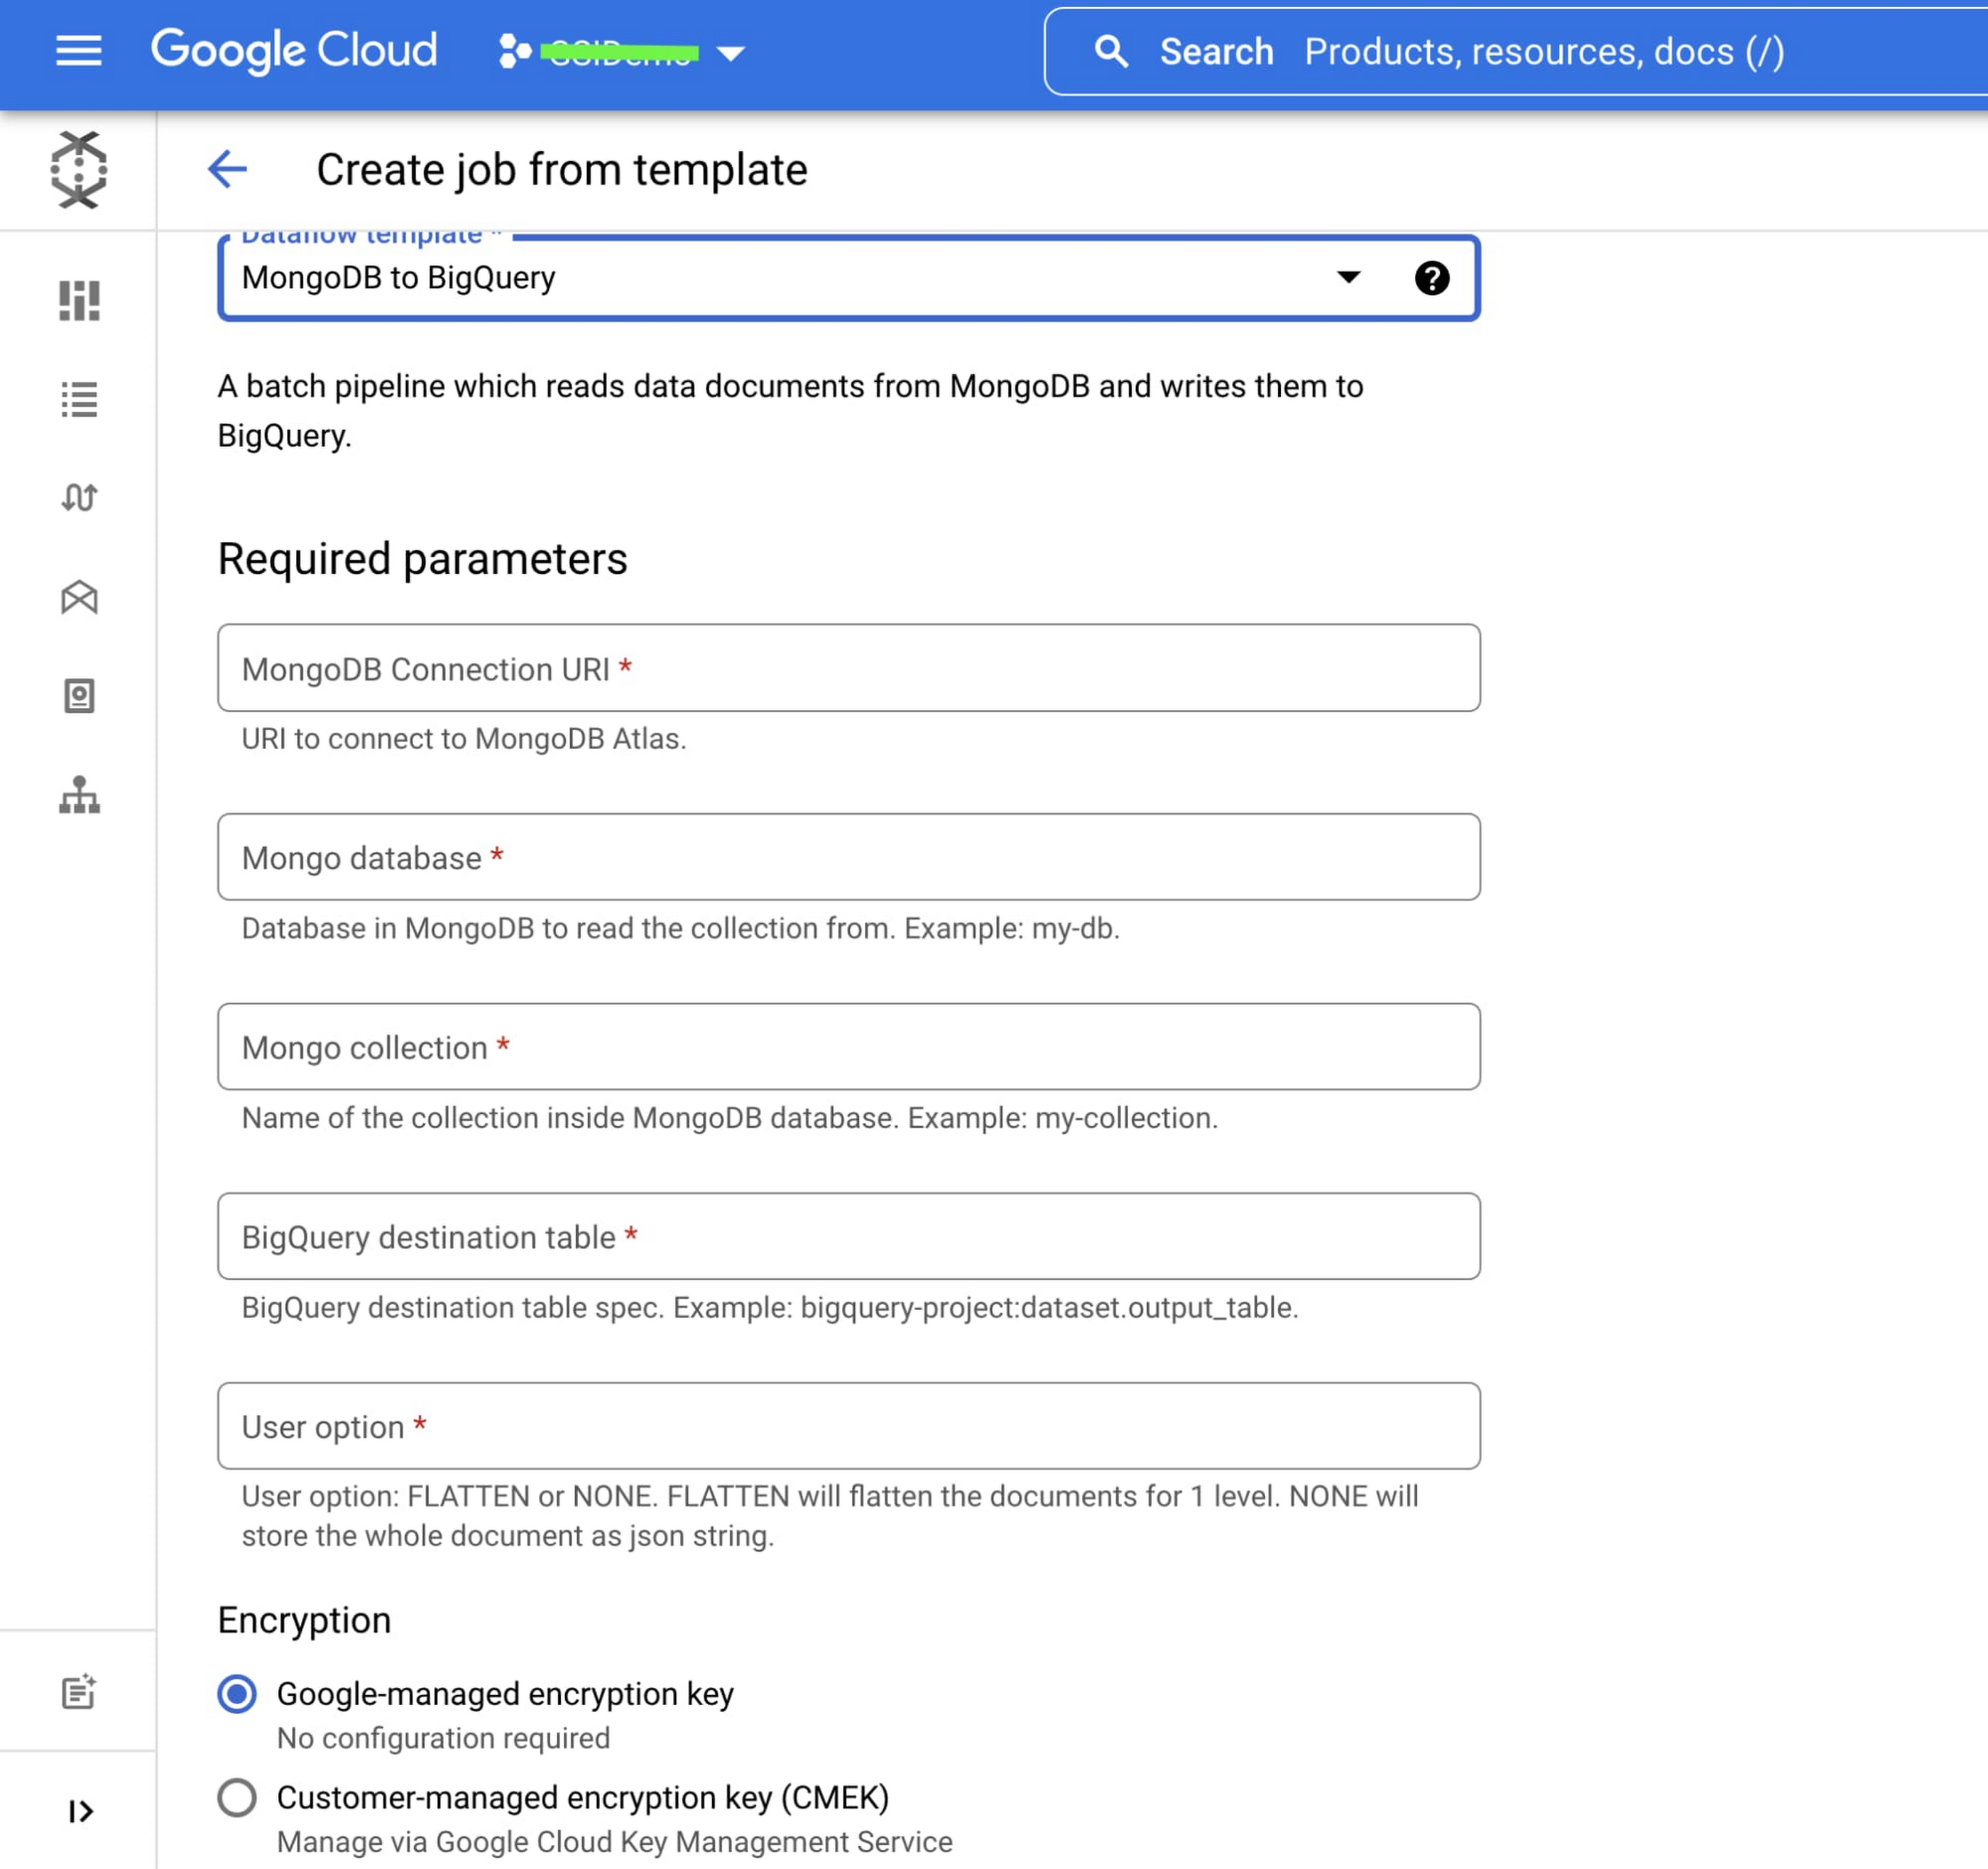
1. MongoDB to BigQuery template: The MongoDB to BigQuery template is a batch pipeline that reads documents from MongoDB and writes them to BigQuery
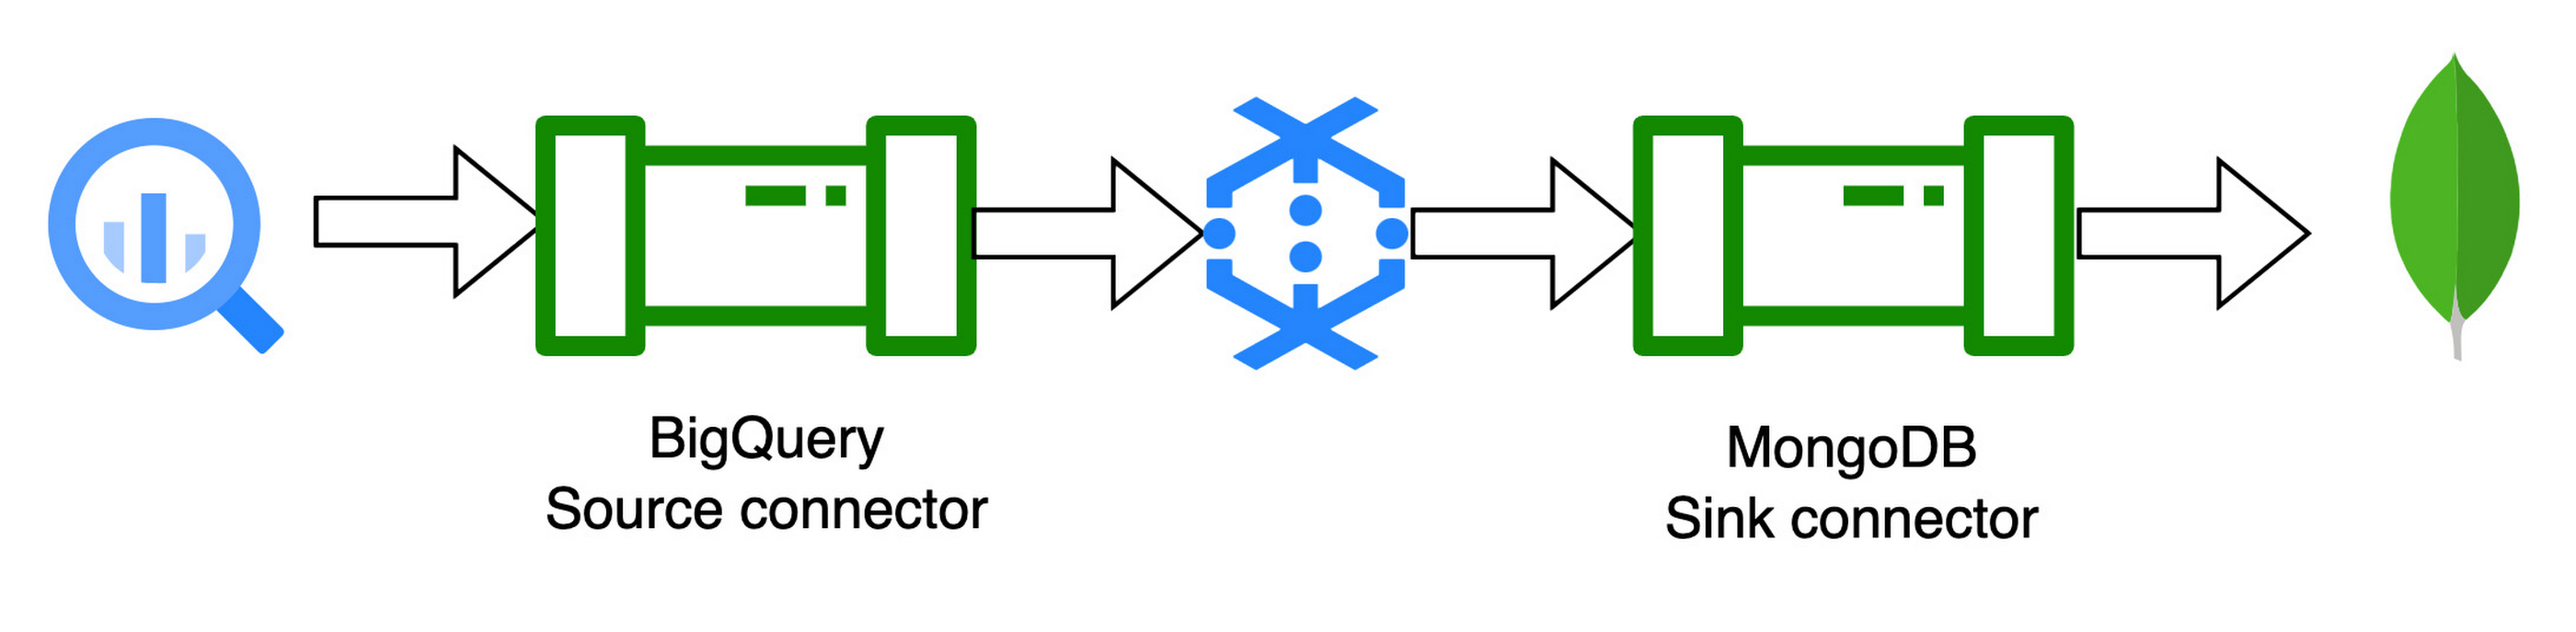
2. BigQuery to MongoDB template: The BigQuery to MongoDB template can be used to read the tables from BigQuery and write to MongoDB.
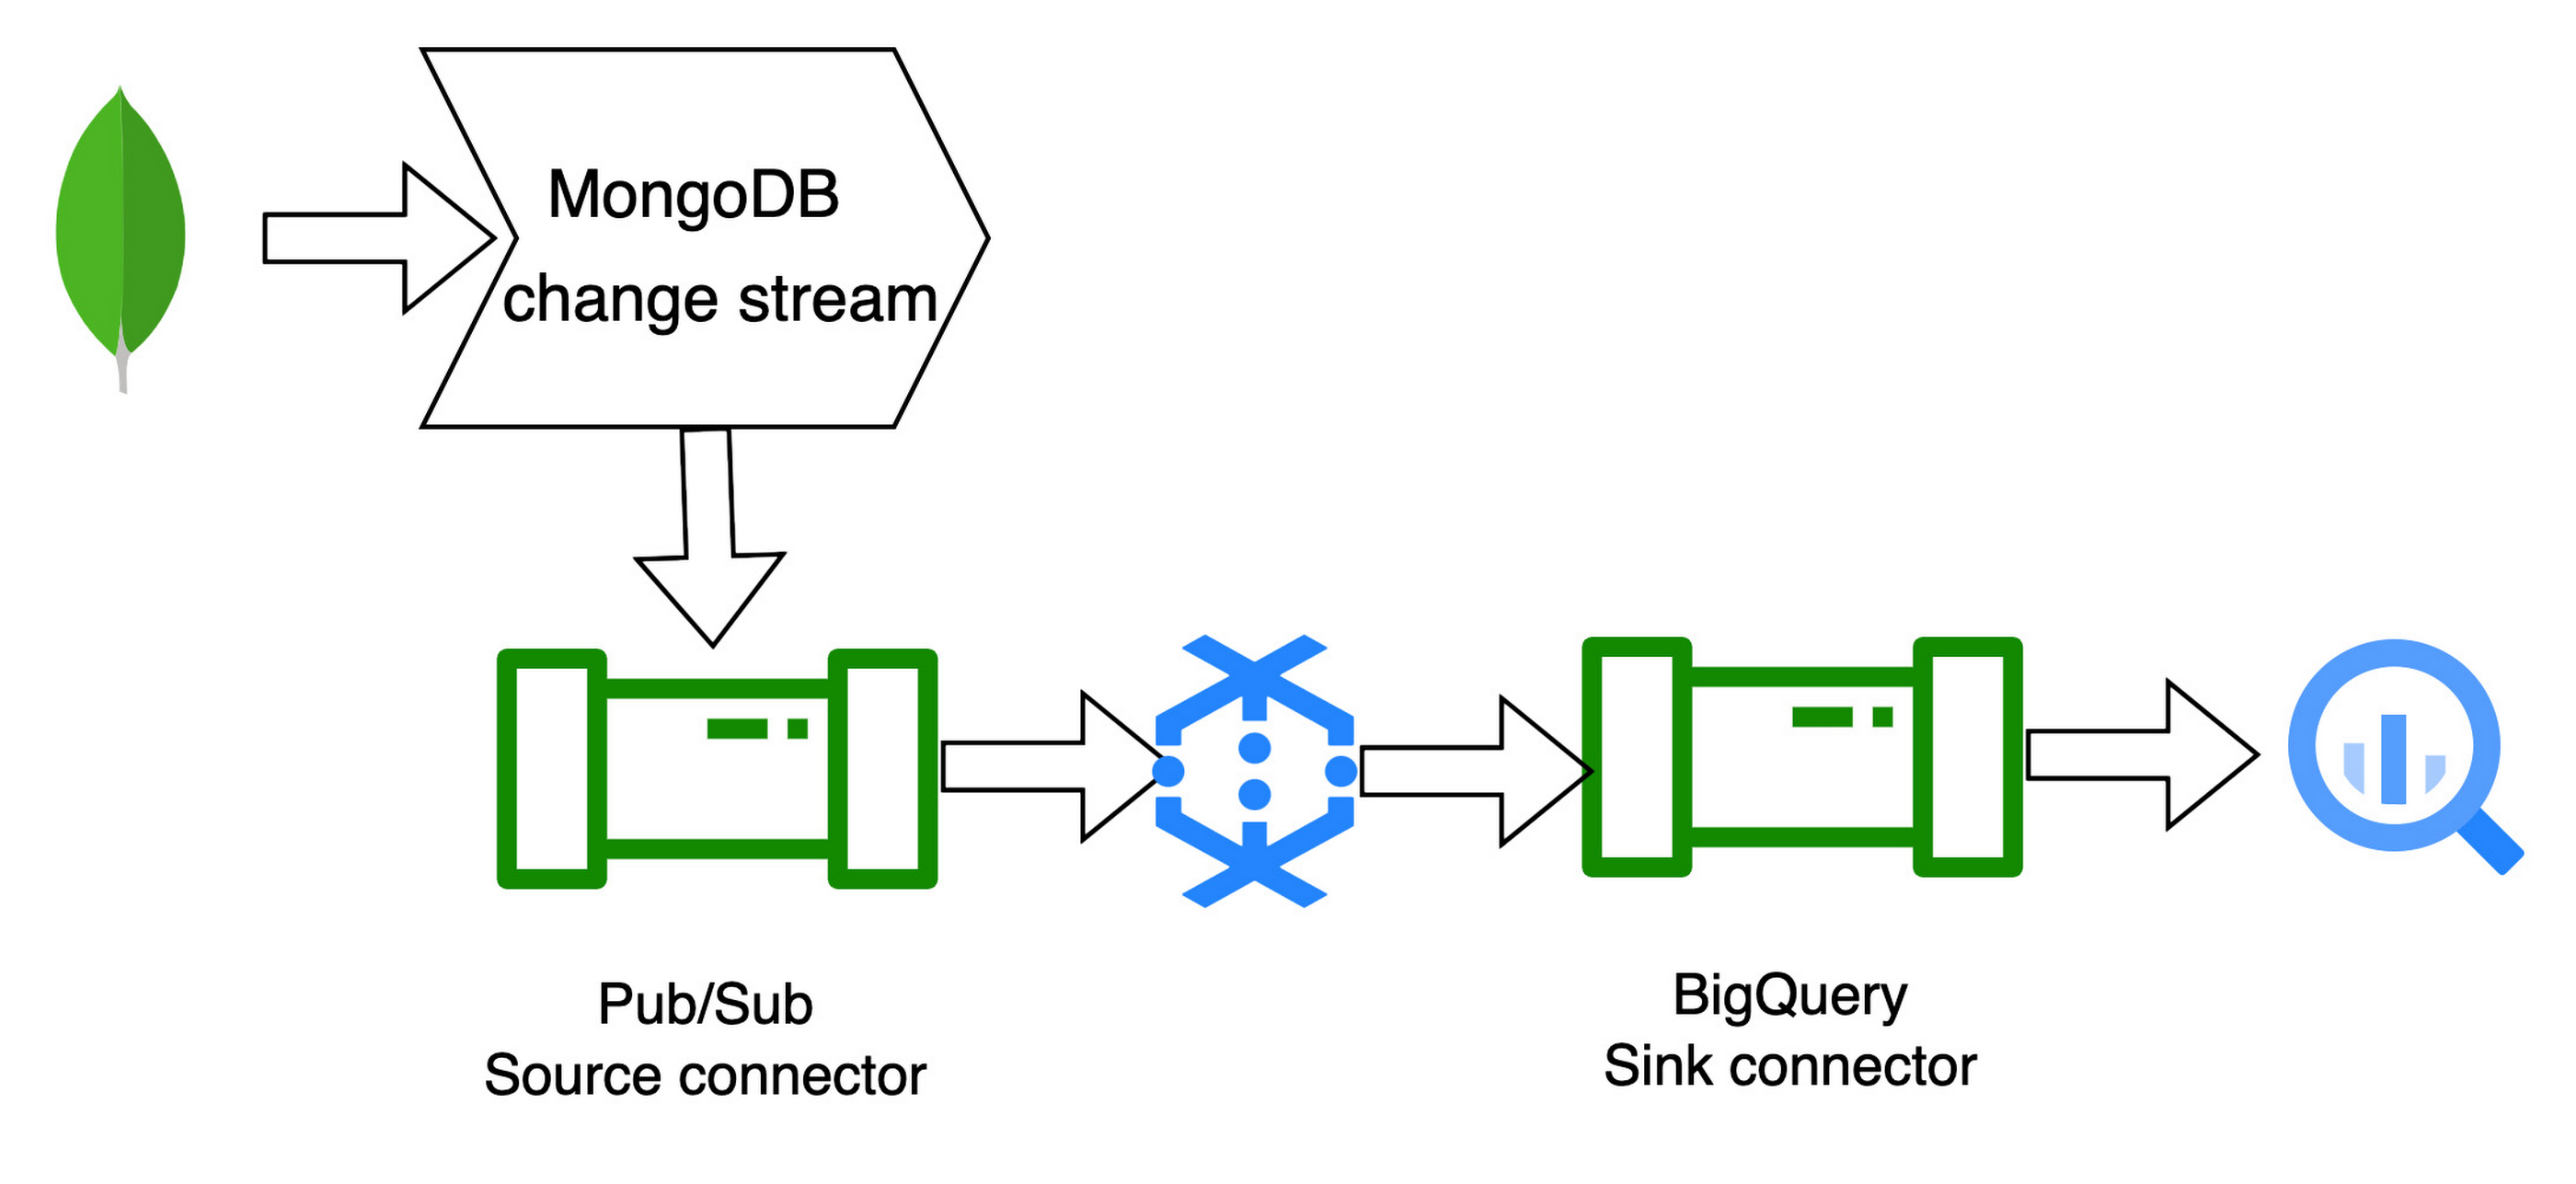
3. MongoDB to BigQuery CDC template: The MongoDB to BigQuery CDC (Change Data Capture) template is a streaming pipeline that works together with MongoDB change streams. The pipeline reads the JSON records pushed to Pub/Sub via a MongoDB change stream and writes them to BigQuery
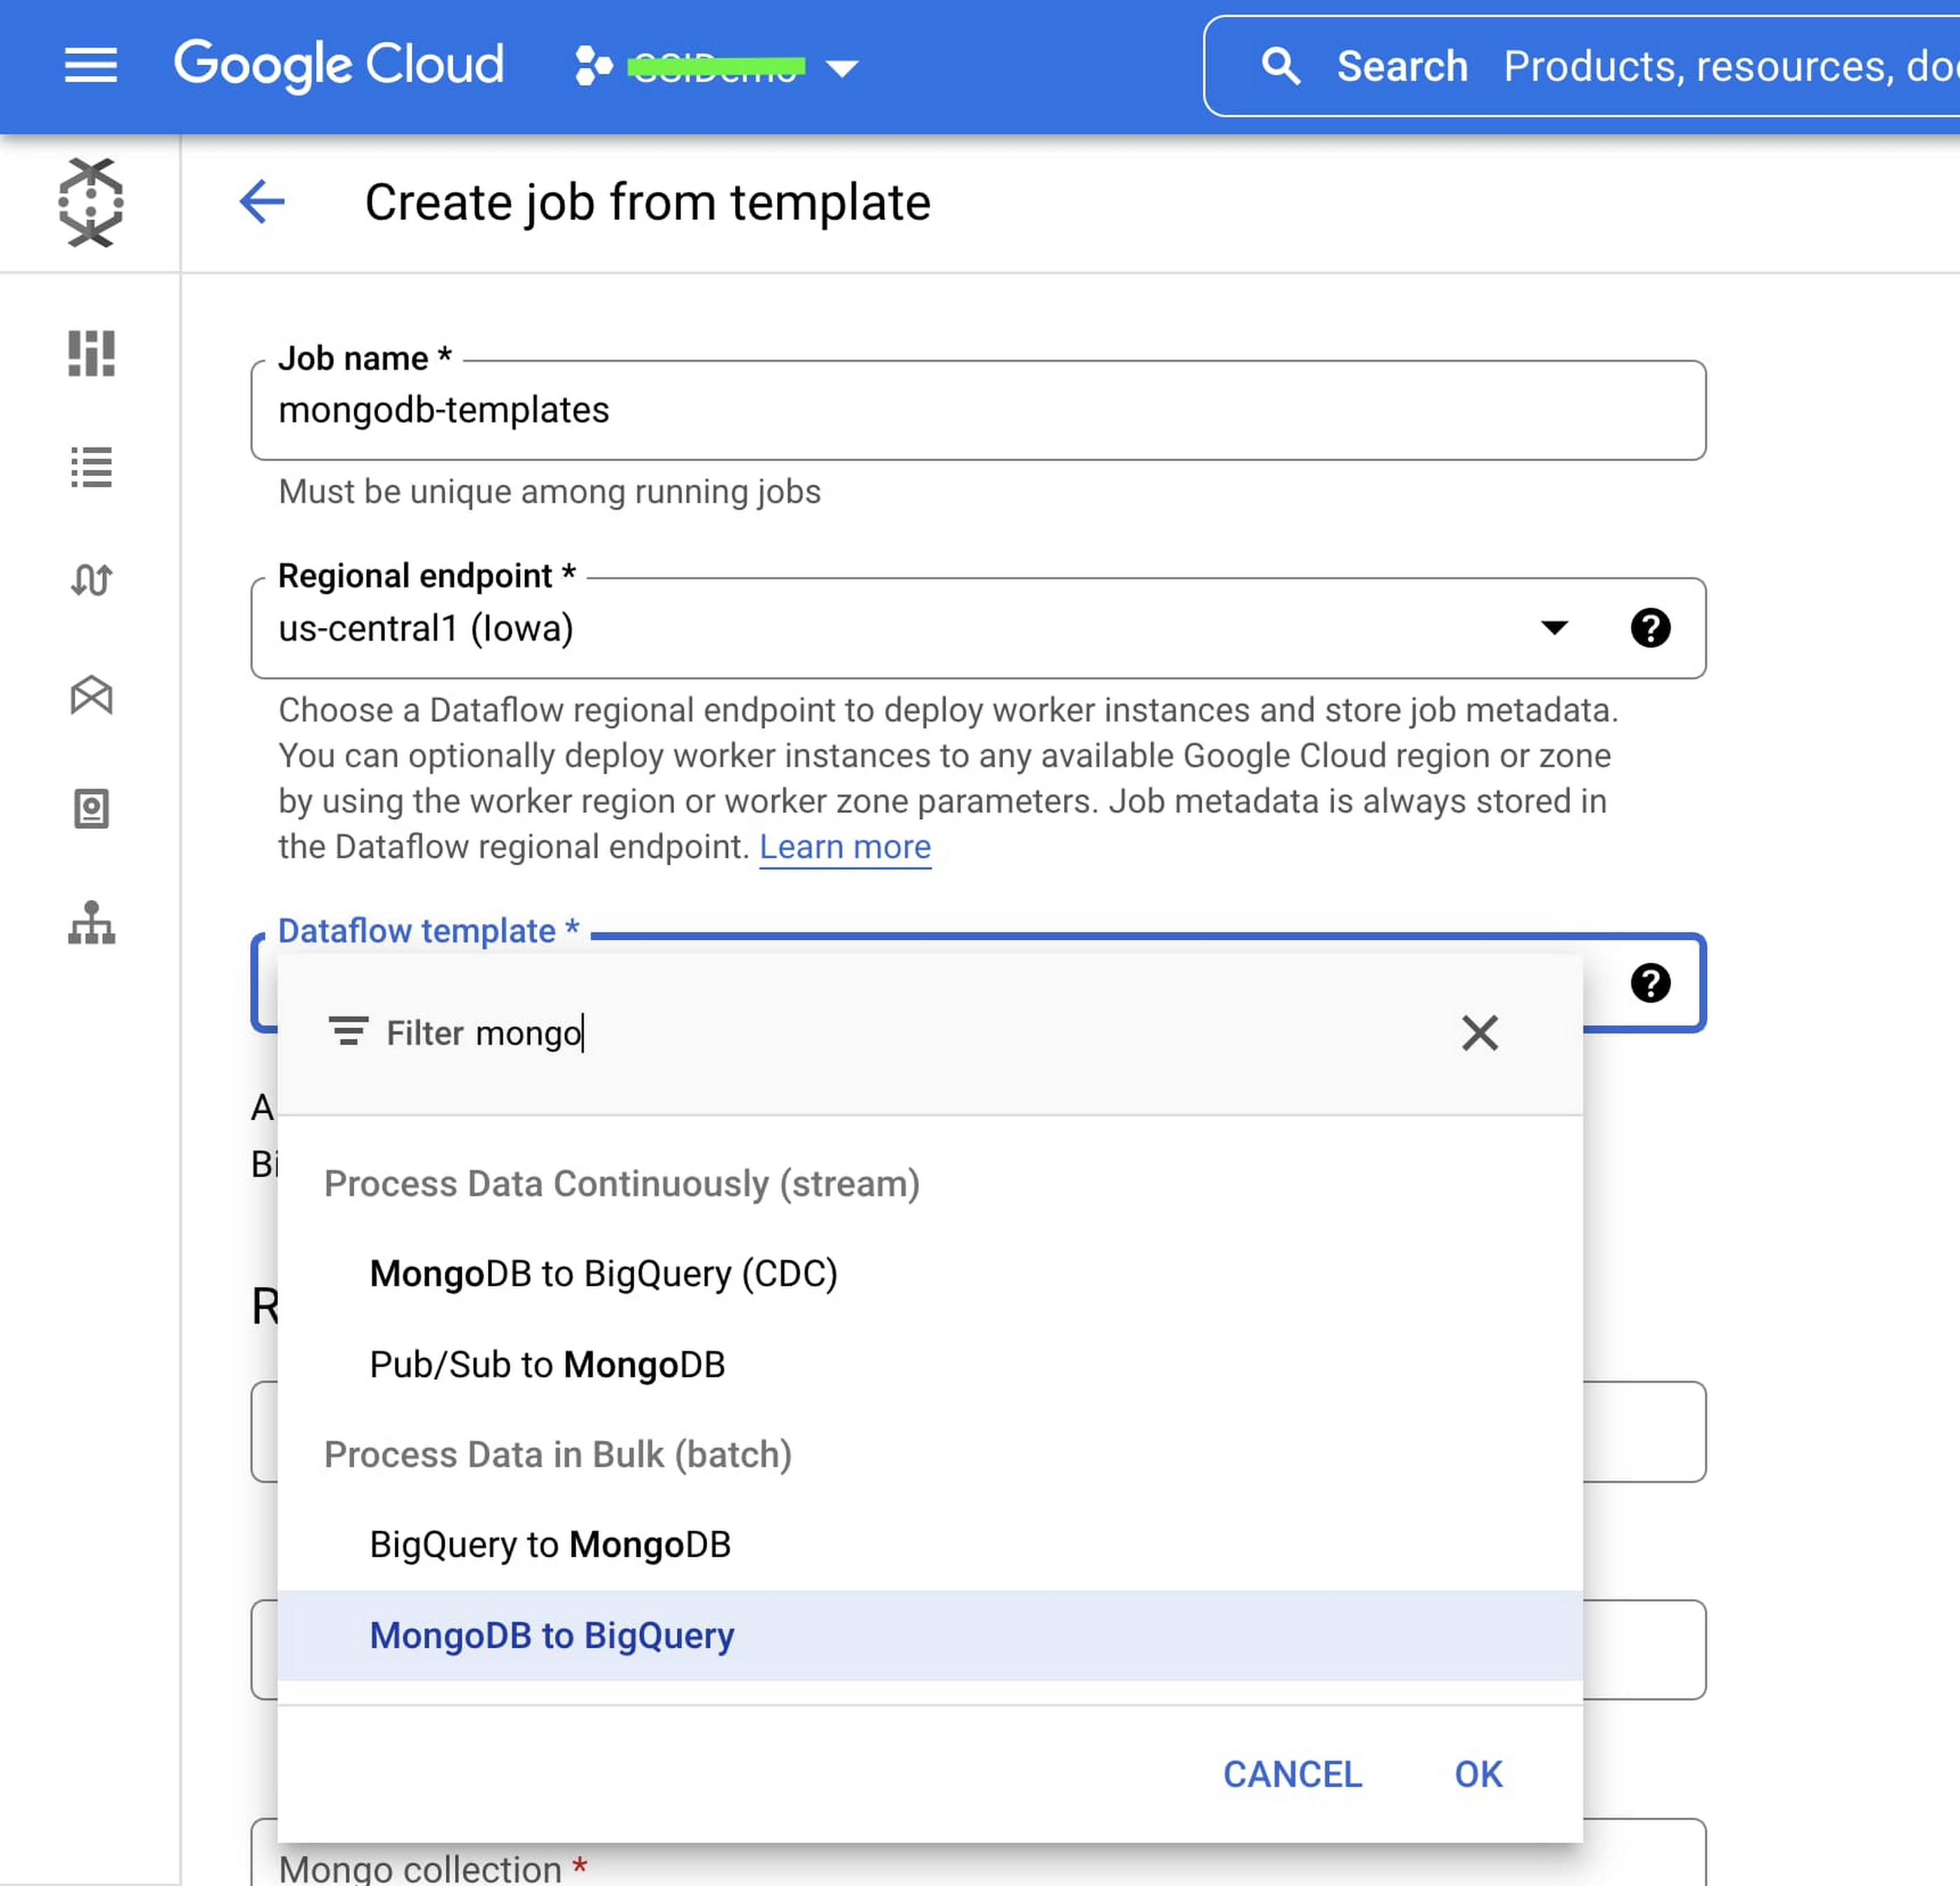
The Dataflow page in the Google Cloud console can help accelerate job creation. This eliminates the requirement to set up a java environment and other additional dependencies. Users can instantly create a job by passing parameters including URI, database name, collection name, and BigQuery table name through the UI.
Below you can see these new MongoDB templates currently available in the Dataflow page:
Below is the parameter configuration screen for the MongoDB to BigQuery (Batch) template. The required parameters vary based on the template you select.
Acknowledgement: We thank the many Google Cloud and MongoDB team members who contributed to this collaboration, and review, led by Paresh Saraf from MongoDB and Maruti C from Google Cloud.
Last year, HubSpot published an article on the benefits of using AI for call center management. More businesses are taking advantage of this opportunity.
Automated outbound calls can save you a lot of time and money as an organization, by automating the frequently repeated calling processes. For instance, having your phone system automatically ask a user for their basic information can be much more efficient than having your agents do the same. And that’s especially when you have hundreds or thousands of users to get data from. This is why a growing number of businesses are leveraging AI technology to automate their outbound calls.
Though automated outbound calling holds a lot of benefits like low time expenditure and low costs, is it really effective? Are there more valuable ways to use AI to grow your business that offer a higher ROI? These are some lessons that we learn today in this guide. For instance, we’ll dive deep into what automated outbound calls are, how AI helps them work, as well as their top benefits and drawbacks. With that said, let’s dive in.
What Are Automated Outbound Calls?
The calls your phone system program makes to get certain information from a user are termed automated outbound calls. These calls are mostly pre-recorded and the program only runs the right recording at the right time. This helps save the calling agents from repeating themselves over and over.
This is one of the ways that companies can use AI to save money. AI helps them use their human resources more efficiently, which increases productivity at the same expense.
An example of automated outbound calls is when a provider lets you know the package you ordered has been shipped through a pre-recorded message. Similarly, when a company walks you through its setup process through a pre-recorded call, it’s using the automated outbound call feature that is managed through an AI interface.
How Do Automated Outbound Calls Work?
The automated outbound calls are directed by an AI program that automatically dials a list of given phone numbers as instructed and runs the given pre-recorded message. The AI takes a variety of variables into account before processing the call.
This way, automated calling allows businesses to deliver a certain message to as many users as they want, within the click of a button. Imagine sending a product update of a brand to thousands of customers manually. Automated calling can save several hours of your employees’ time and do the same with much less hassle.
Benefits of Using AI to Handle Automated Calling
Here are the main advantages of using AI to handle automated outbound calls.
Increased Productivity
Automated calling can take the productivity of your support staff to the next level, by letting them avoid repeating themselves over and over. Instead, this feature lets them focus on solving problems that require human support, like guiding a user through a complicated procedure. This way, your calling department will be able to handle lots of users efficiently, without requiring a lot of staff. This is one of the many ways that AI increases productivity.
Low Call Center Costs
Having an automated outbound calling feature for your company can bring your call center costs down to nothing. It’s because it only takes a pre-recorded message and an AI application to make automated outbound calls. Instead of paying a lot of callers for running a phone advertising campaign, you can set up automated outbound calls and have a program do the same.
The automated outbound calling feature is widely used for marketing purposes. If you’re a business, calling your potential customers and introducing them to your services or products can be effective. Similarly, phone calls can also help you introduce a new service or product you just launched or an upcoming event to your existing customers. Either way, automated outbound calls can help you market your business a lot more effectively.
Drawbacks of Using AI to Manage Automated Calling
AI has its limitations like anything else. Below are the main cons of automated outbound calls:
May Irritate Customers
Humans love talking to humans, and not to pre-programmed machines – especially when they need some serious help. This is one way automated outbound calls can irritate your customers. When a customer picks up an automated call, they may find it annoying to not get the chance to ask a question or two, as in a regular call.
Low Conversion Rate
Another key disadvantage of automated calls is their low conversion rate. First and foremost, automated calls and robocalls often end up blocked by the user’s phone system. It’s because many users use phone systems that block callers who don’t dial a given digit, to validate if it’s a human being on the other end.
Apart from that, automated calls won’t give you the choice to target the unique pain points of each customer, which helps tremendously improve your conversion rate.
May Affect Overall Brand Image
Though automated calls are cost-effective and efficient, their user experience is nothing close to a professional humanoid call. For instance, the users will get the chance to interact and ask questions from a support agent but they can’t do the same when they receive an automated call. So, solely relying on automated calls can damage your brand image in the long run.
AI Technology Helps Companies Boost Productivity by Automating Outbound Calls
AI technology has provided a number of opportunities for companies to boost productivity. One of the benefits is by making outbound calls possible. This guide thoroughly explains what automated outbound calls are and how they work. We also looked into the top advantages and disadvantages of automated calls to help you determine if they’re a good option for your business.
To conclude, automated calls are definitely a productive feature but they shouldn’t come in the way of providing your customers with a good calling experience. Until next time, cheers!
Big data has changed the marketing profession in extraordinary ways. Global companies spent over $3.2 billion on marketing analytics software last year. This figure is expected to grow in the future.
There are many different ways that marketers can leverage data analytics to create successful marketing strategies. One of the biggest benefits is in the realm of email marketing.
Data-driven email marketing strategies have very high ROIs. However, it is important to leverage the right technology and take advantage of the best strategies.
Many data-driven marketers are taking advantage of Microsoft Outlook. They recognize that they can get a greater benefit from this email provider if they know how to work with the right data files. Some details on these processes are listed below.
Data-Driven Organizations Must Work with Data Files to Take Advantage of Outlook
Outlook has two types of data files (PST and OST) to store the data from the email servers. The PST file is mostly used to store data such as email or past account, personal archives and legacy protocols of messaging. If you are configuring an Exchange Server account with MAPI or Office 365 account on your Outlook and want to view the data which is locally cached without connecting to the Exchange Server on-premise or Online, Outlook will store such information in OST file format.
What’s the difference between PST and OST?
PST file is used by legacy messaging protocols – POP, IMAP, or older mail servers. In Outlook 2013 and earlier versions, IMAP accounts also used .pst file. In Outlook 2016 and Outlook for Microsoft 365, IMAP accounts use .ost file. The PST file is used for personal archives or to backup emails which can be easily exported. The personal archives are commonly mistaken with the Exchange Archive mailbox. The Exchange Server Archive mailbox is stored on the server itself. If the computer loses the files or gets formatted, the archive is re-synced. For such things, the Outlooks Data File (.pst) is used.
When setting up an Outlook account from local Exchange Server or Exchange Online (Office 365), an Outlook Data File (.ost) is created on your computer. This file is a copy of the actual mailbox which resides on the server. There is no need to back up the file. If something happens and the computer is reset, nothing is lost.
Outlook PST File and its Uses
PST file, i.e. Personal Folders file, is a format which is used by Outlook to store data. The file is fully portable and can be copied to another computer and opened in Outlook with no issues. PST file is commonly used with older email messaging protocols, like POP and IMAP.
POP is the internet protocol, which is used for email transfer, where the data is kept on the server until the computer or device synchronizes with the server. Once this is done, the emails downloaded on the client will be purged on the server. If something happens to the device, the data will be lost. Also, if you have multiple devices with the same account, emails would be downloaded only on one device.
This is somehow resolved with IMAP where there is synchronization between the server and the device. The emails are kept in a local PST file with only headers until it is opened and then it will be downloaded to the local server. This is not very secure as it uses PST which can be easily ported to another computer.
A PST file cannot be larger than 5 GB as large files are prone to complications and corruption. Also, opening and accessing PST files from a network share or sharing via OneDrive is highly discouraged as this may corrupt the files.
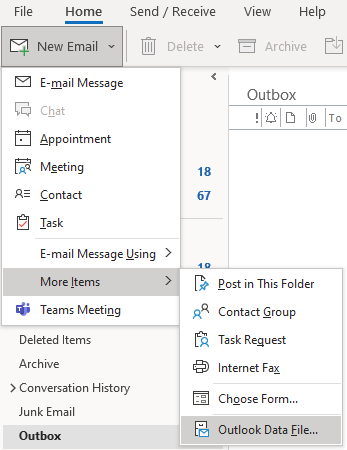
Here is how to create a new PST file:
Open Outlook and click on File.Click on the dropdown on the New Email.Click on More Items.Click on Outlook Data File.
To open an existing PST file, click on File, Open & Export, and then on Open Outlook Data File.
Once opened or created, the PST file will be shown in the left pane.
To move or copy emails to a PST or number of PST files, you can simply drag and drop the items/files.
Outlook OST File and its Uses
Outlook Data File (.OST) is automatically created when setting up an account with the local Exchange Server or Exchange Online. The OST file is a local cache of the mailbox data on the server. If you receive, send, or delete an email, this is synchronized between all the connected devices.
The OST file also acts as a buffer between the actual mailbox and the device. First an email is saved locally on the OST file and then it’s synchronized to the server once the connection is up. You can create calendar entries, tasks, contacts, and send emails while offline. When online, these will synchronize to the server.
To view the location of the OST file, go to File > Info > Account Settings > AccountSettings.
Then, click on the Data Files tab.
An OST file cannot be moved to another machine or opened from another computer and application. If there is an issue with the account or machine, you will need to re-setup the account. But any changes done while offline will be lost. Once the OST has been set, if the mail profile is re-done, you cannot reuse the OST file to recover the data. If something happens to the Exchange Server and the data is lost, you will not be able to recover any data from the local OST file in case Outlook is not opening.
In order to recover data from the OST file, you need OST to PST converter application. Stellar Converter for OST is one such application that can easily open an OST file from any version of Outlook and convert it to PST file. You will be able to view the whole hierarchy of the file. You can also export the OST data to other file formats. In addition, you can easily export OST data directly to Office 365 and any live database of Exchange Server.
Data Driven Companies Must Take Advantage of Outlook the Right Way
There are a number of reasons data-driven companies are using email marketing. Some of the best features are available in Microsoft Outlook. However, marketers need to know how to work with data files properly. Fortunately, the guidelines listed above can help.
AI has become one of the most important gamechangers for businesses and customers relying on mobile technology. This is one of the reasons companies are spending over $328 billion on AI technology. One of the many reasons that AI is changing the landscape of mobile technology is that it helps develop and distribute apps more easily than ever.
We previously talked about some of the ways that AI is making it easier to develop new mobile apps. However, we haven’t discussed the benefits of using AI to distribute apps through app marketplaces in as much detail.
AI Technology Leads to the Inception of New App Marketplaces
The number of mobile apps has skyrocketed over the last few years. In 2021, the number of mobile applications hits around 3 million on Google Play alone, while the App Store has around 3.5 million applications available for download.
With the competition so tough, app publishers are looking for other places where they can publish their solutions. And although the App Store is the main hub for mobile app development, it’s not the only place where developers can sell their creations.
There are a variety of ways that AI technology is helping app marketplaces. In order to appreciate the benefits of using AI to create a new app marketplace, it is important to first address the challenges. We will discuss these issues before identifying some of the best app stores that have been developed as a result of AI technology.
Apple’s App Store has become one of the most important platforms in mobile technology and entertainment. It’s a platform where hundreds of thousands of apps are available to users worldwide, including well-known brands like Netflix and Spotify. However, despite its success and popularity, the Apple App Store still faces several challenges that can make it difficult for developers to succeed on the platform.
The first challenge is that Apple’s app approval process is rigorous. The company maintains a list of guidelines that all developers must follow or their apps will be rejected from the iOS store. These guidelines include using only one language for all text dialogues in an app, having no duplicated content on any page, and not including third-party ads in games or apps.
Another challenge facing developers is that they must comply with Apple’s 30 percent commission fee on each sale made through the iOS app store. This fee goes directly to Apple, so if you want your app to be successful on this platform, you’ll need to find ways to offset these costs by charging higher prices or adding extras like in-app purchases or subscriptions
How AI Technology Helps Solve Challenges for App Marketplaces
There are a number of ways that AI technology can help new app marketplaces. Some of them are listed below:
Mitigate app security risks. One of the biggest challenges that App Store struggled with was dealing with apps filled with malware. AI technology has made it easier to identify apps designed with malicious purposes.Help with marketing. AI technology also helps companies implement more cost-effective marketing strategies. They can find creative ways to reach new customers more easily than ever.Improve maintenance. AI technology has also made it a lot easier to maintain websites. Companies use machine learning to identify technical issues with their sites and automate maintenance. Since app marketplaces depend on stellar user experiences, they depend on AI to meet these customer expectations.
AI is clearly of crucial importance for app marketplaces trying to compete with the App Store.
Where to publish your apps in 2022?
The App Store is the most popular destination for mobile applications. The store received more than 1 billion unique visitors in 2021 and continues to be the dominant destination for posting applications. This growth has resulted in more competition, resulting in a number of alternative stores like Google Play Store, Amazon Appstore, Steam, and others.
Google Play Store
Both the App Store and Google Play Store account for the largest shares of the market. Google Play Store offers plenty of apps and games, along with Google’s own suite of apps like Gmail and Google Maps. It also includes an app store within the Play Store itself — something Apple doesn’t do on iOS devices.
The Google Play Store is the most popular app store, and it’s a great choice for users looking for apps that don’t exist in Apple’s App Store. It’s also worth noting that there are some exclusive features in the Google Play Store that aren’t available on the iOS version, such as Material Design, which is a design standard used throughout Google products.
The Google Play Store is a bit different from Apple’s App Store. The latter requires developers to pay upfront fees and fees during the process of submitting their apps to Apple, whereas Google offers free distribution for all Android devices. However, if you want to make money from your app, you’ll need to pay for advertising, in-app purchases, and subscriptions.
Amazon Appstore
One of the e-commerce giants, Amazon also offers its own app store for Android devices called Amazon Appstore. The platform has been around since 2011 and offers access to more than 250,000 apps that have been downloaded over 1 billion times. As with other app stores, it has its own revenue share model — developers can receive 70 percent of all revenue generated through in-app purchases or subscriptions (the remaining 30 percent goes to Amazon).
The app marketplace also helps generate revenue via advertising. Moreover, app publishers can include virtual currency (Amazon Coins), extra lives for a game, or subscriptions for purchase.
GetJar
GetJar is an alternative to the App Store that’s popular in Europe and other parts of the world where Apple doesn’t have as much dominance. The GetJar store offers more than 2 million apps, games, music, and movies (with movies available in various languages).
As for monetization, developers can benefit from its freemium model which includes adverts and in-app currency. Also, GetJar Gold is one of the most popular virtual currencies in use and is available to millions of users.
Samsung Galaxy Store
The Samsung Galaxy app store is a great alternative to the App Store. It’s got a lot of great games and other apps, but it’s not as wide-reaching and convenient as the App Store.
The Galaxy app store doesn’t have as many apps as Apple’s App Store. However, low competition can be beneficial for fledgling applications and app publishers. The best part is that the app store is completely free, so users won’t have to worry about paying any fees when downloading apps from this store.
However, this app marketplace does charge for some premium services like music streaming and video streaming. Also, Samsung Galaxy Store doesn’t work with non-Samsung phones.
F-droid
The F-droid app store is a community-driven repository of open source apps, where you can easily search for, download, and install apps on your Android device. F-droid is a great alternative to the Google Play Store for Android users who want to avoid using Google’s proprietary software and its restrictions on what apps you can install and how they can be packaged. F-droid offers a much smaller range of applications than Google Play, but it’s still worth using if you’re looking for something a little different.
Takeaway
Choosing the best alternative app market may seem to be a tough task. While Google Play and the App Store have got a foothold in the market, less-known alternatives such as F-droid and GetJar can help you beat the competition. However, none of these app marketplaces can topple the Google Play Store and the App Store in terms of exposure and number of visitors. Therefore, we recommend combining distribution channels to get additional traction for your application.
The market for cloud technology is growing considerably. Ninety-one percent of companies are on the cloud. As this figure grows even further, the demand for cloud solutions will rise.
Therefore, this is one of the best times to create a cloud business. However, there are a lot of challenges that you have to consider as well. One of the biggest is finding ways to fund your cloud startup.
An enterprise cannot just become successful based on the ideas or business plans of its creator. Before your enterprise can become successful, you will need to fund it. Unfortunately, the amount of money needed to finance an enterprise can sometimes be larger than what you can bear. This is especially true for cloud startups.
The average cloud hosting company is lower than many other cloud startups. Some experts have shown that you can start a cloud hosting business for as little as $1 a month per customer. Unfortunately, starting a different type of cloud-based business might be a lot more expensive.
In this case, you will need a good investor. The good news is that many investors recognize the merits of cloud computing and are happy to get behind promising cloud startups.
Find the Best Investors for Your Cloud Startups
Investors are people who help to provide the finance an enterprise needs, for a share of the profit. In other words, they help to give you the money you need for your enterprise, for a small cut. Due to how simple this seems; you might not know other ways that an investor can benefit your cloud startup. You may even want to find a venture capitalist for your cloud business. If you don’t know, no need to worry, as some of the ways are stated below.
1. Finances
This is the basic way by which an investor can help your enterprise. Investors can help to provide finances for enterprises they think will have great profits. If you do not have the finance your business needs, an investor can help with that. All you need to do is to find a worthy investor and convince them that your enterprise is worth investing in. A good investor can help to make a difference in your enterprise. Why? because most businesses usually require a large amount of money that a single person cannot provide. An investor is usually someone who has a lot of businesses and money to spare. However, be sure you think about the profit that will be lost before you seal a deal with an investor.
2. Guidance
Aside from the fact that an investor gives you money that you need, they also help to monitor the enterprise. This is because their own money is also at stake if the enterprise crashes. Due to this, investors are also good guardians. They help to mentor you and the enterprise effectively. Before you make any decision, you are not sure of, you can check with the investor. Investors are usually people with a lot of experience, so you can trust what they tell you.
3. Connections
Investors are usually people that have experience in various forms of businesses. This experience usually comes with a lot of various connections with important people. Aside from the finance that an investor can give you, they can also provide you with connections. You can, therefore, make use of these connections in ways that will benefit your enterprise.
For example, as a cloud-based business, you might need to hire programmers or network administrators. You will want to try seeing if they can help you. You can also try seeing if they know any Python programmers as well.
4. Strategies
The cloud computing industry is very different from many other sectors. You need to find a clever monetization strategy. Investors are usually experts with a lot of different strategies for the enterprise. If you can get a good investor, he or she might be able to give you some good strategies for your cloud startup. You can be able to trust their word, as their money is also on the line. A good strategy can go a long way in helping your enterprise become successful. The best way you can get a good strategy is by getting it from someone who has already made use of it.
5. Getting resources
Aside from the finances, there are also some vital resources that every cloud startup needs to become successful. Investors usually know where you can get the best resources, such as materials, workers, and customers. This is because your investor might also have other businesses. If you have a good investor, you don’t have to worry about where to get these resources.
Find the Right Investors to Help Finance Your Cloud Startup
Investors are very useful for any cloud startup. Aside from giving finances, investors also help to do things that can boost the progress of any enterprise. Finally, data collection companies can help check where to beam your searchlight for good investors. Moreover, data collection Hello Pareto will be helpful in this regard.
Last decade made a pretty bold promise to digital advertising, which more than other industries suffers from insufficient transparency and a fraudulent environment.
The IAB Tech Lab conferences, in particular, frequently gathered blockchain evangelists and ad tech experts who discussed how this technology would finally drive authentication to programmatic chains. Reduced budget waste, elimination of intermediaries and fraudulent traffic are the core challenges of ad tech that decentralized ledger promised to resolve.
As soon as the IAB Tech Lab blockchain working group started developing principles of decentralized networks, the advertising industry was believed to be standing on the threshold of massive technology introduction into a real business. Now that we’ve marched into 2022 it’s time to recollect those talks, inspect the current market and finally understand if blockchain really brings some changes into ad tech and martech scene.
The landscape of blockchain-driven solutions: from 2018 to 2022
Currently, buy-side is most enthusiastic about blockchain implementation in ad tech, because advertisers and media buyers need good quality traffic. Globally, ad fraud will most certainly cost advertisers $81 billion in 2022. Roughly speaking, ad fraud takes $1 from $5 invested in digital ads.
In 2018-2019, budding blockchain-based advertising projects provided the first opportunity to buy clean and secure traffic, enriched with genuine data about ad campaign performance. In 2019, this environment evolved, multiplying the number of blockchain marketing startups from 22 (2017) to 290 (2019), which is more than 13 times in a year. These commercial and non-commercial projects mainly function in the area of social marketing, data, commerce, content marketing, and digital advertising, where the number grew from 10 to 105.
Starting from 2019 society has shifted its attention toward NFT technology (which also uses a blockchain ledger for protecting the ownership of digital assets). With this, blockchain is featured among the top martech trends in 2022. Over 31% of industry experts think that VR/AR, Metaverse, NFT, and Blockchain technology will define the trajectory of martech and ad tech development.
Sure, right now crypto markets are not being in the best of times – the growing cryptotrading markets recently crippled in China. In January 2022, Spain and the UK also introduced new stifling regulations to eliminate crypto advertisements. However, the growth in the number of successful blockchain advertising startups signals that companies have finally started to understand the true value of technology without associating it with the token economy.
What blockchain solutions are here and how do they reshape advertising?
Let’s recall why the industry clung to blockchain technology in the first place – because it created a distributed database that could be trusted by demand and supply partners alike. When companies add a blockchain to digital advertising, they reach the next level of clarity and accountability.
Every action or impression is recorded on a distributed ledger: which user watched the ad, which advertiser bought the impression, what was the cost and the components (commissions, actual bid), and so on. This way, all data becomes auditable to every chain participant on an event-level basis. The parties themselves can detect fraud and initiate automation removal of a suspicious component from the chain.
The majority of martech-powered solutions are currently focusing on improving transparency and mitigating advertising fraud, for example:
AdEx – the platform that connects publishers and advertisers directly, reducing the middlemen and thus hidden commissions; Rebel AI – focuses on identity to eliminate the problem of domain spoofing;XCHNG – Fights with ad fraud thanks to the application of smart contracts;AdBank – secures transactions between advertisers and publishers while also delivering transparency over payments; Papyrus – ensures fairness and efficiency of media supply chains with the blockchain network.
Apart from fraud protection, blockchain solves many problems in different areas of advertising. Based on the events recorded on the ledger, document flow, and paper bookkeeping become a matter of one click automated by smart contracts.
Additionally, blockchain in martech helps to protect the interests of users, e.g. Brave browser users, actually earn revenues in the form of BAT (Basic Attention Token) in exchange for ad watching. Since global attention is also focused on privacy protection and digital ownership, most likely the next generation of blockchain startups in marketing will be developed exactly in these niches.
What about challenges?
In the absence of regulation, many blockchain pilot projects were at risk of ending up absolutely impractical. Nevertheless, the world is adapting to blockchain anyways. Luckily, market participants joined forces that contributed to faster technology adoption and regulation development. IAB Tech Lab’s initiatives support businesses in their desire to stay aware of the best practices of blockchain integration into ad stacks. A set of specific programs are constantly being developed in order to facilitate education, raise awareness and deliver a legal framework for such platform functioning.
To better understand market readiness and realize how blockchain works in the real world, the IAB Tech Lab started a blockchain pilot program that will deliver real-world algorithm for testing blockchain-based services and products.
The members that develop blockchain solutions are invited to showcase how their blockchain-based projects can work. Their advertising blockchain initiatives have deployed working mechanisms for addressing ad fraud, transparency, and efficiencies in the reconciliation of campaign data in their own way. Some have developed 2-layer protocols to accelerate transaction speed; some have automated purchases by smart contracts and others have combined IAB Tech Lab’s ads.txt, (registry of authorized sellers) with Ethereum to achieve increased inventory purchasing transparency.
The other obstacle of the past was speed. Now, blockchain transactions occur in minutes, while processes in digital marketing occur in milliseconds. This problem apparently found a partial resolution in 2019, when blockchain startups figured out how to cover the problem with multilayered protocols architecture that execute transactions outside of the main blockchain.
Finally, the third and probably the most important problem of blockchain in ad tech is a lack of education and the shortage of professionals well-versed in blockchain implementation in advertising. Despite obviously growing curiosity and awareness, actual comprehension of blockchain, NFT, and related technologies among mass audiences is very low – even in 2022 96% of Americans fail the common quizzes that include basic crypto concepts.
However, in order to improve the state of things in this department, we need to have more educational initiatives like those presented by IAB. We also need support and educational initiatives on the local and regional levels that would raise awareness of blockchain implementation in ad tech. This awareness could encourage broader blockchain solutions implementation and would persuade companies to invest resources in employees training and education.
The takeaway
Early experiments with blockchain in advertising were quite successful, which raised the bar for subsequent projects. Marketing and advertising tech built on blockchain, NFT, and similar technologies can become the new normal, although even in 2022 it is still rather a prerogative of niche enthusiasts and small startups. Regulatory uncertainty, poor awareness, and lack of professionals are still challenges that stand in the way of the mass deployment of such solutions. However, once these obstacles are passed marketing and advertising landscape will be redefined.
It will be possible to see how much money from advertisers’ budgets reach the publisher after passing the pipeline. In turn, impressions served by websites will be easily signed and tracked. Finally, the users will be able to receive rewards for their attention and protect their digital assets.
So, obviously, blockchain in advertising doesn’t have to be overhyped, nor does it have to be underestimated. For this, we shouldn’t take it as a universal hammer able to fix every problem, but rather see it as a tool of great capacity if the problem it needs to solve is right.
Did you know that around 2.5 quintillion bytes of data are generated each day? Businesses are having a difficult time managing this growing array of data, so they need new data management tools.
Data management is a growing field, and it’s essential for any business to have a data management solution in place. A data management solution helps your business run more efficiently by making sure that your data is reliable and secure. You can use information management software to improve your decision-making process and ensure that you’re compliant with the law.
A data management solution can help you make better business decisions by giving you access to the right information at the right time. Data engineering services can analyze large amounts of data and identify trends that would otherwise be missed. If you’re looking for ways to increase your profits and improve customer satisfaction, then you should consider investing in a data management solution.
In this blog post, we’ll explore some of the advantages of using a big data management solution for your business:
Big data can improve your business decision-making.
Big data is a collection of data sets so large and complex that it becomes difficult to process using on-hand database management tools. Big data solutions are used to analyze the massive amounts of unstructured information collected from various sources, such as sensors, devices, and social media networks. This type of analysis helps you make better business decisions based on trends and patterns.
For example, if you want to know what products customers prefer when shopping at your store, you can use big data analytics software to track customer purchases. You can then optimize product placement on the shelves or product placement in advertisements based on customer preference.
Big data analytics can also help you identify trends in your industry and predict future sales. For example, if you’re a retailer and you notice that your competitor is selling more products than usual on a particular day, then you may want to increase your inventory so that you don’t miss out on any potential sales.
Big data management increases the reliability of your data.
Big data management has many benefits. One of the most important is that it helps to increase the reliability of your data. Data quality issues can arise from a variety of sources, including:
Duplicate recordsMissing recordsIncorrect data
The proper use of data management solutions can help you identify these problems and correct them quickly and easily. This reduces the risk that inaccurate information will be used in your organization’s decision-making, which could result in poor business outcomes.
Big data management solutions can also help you to ensure that your data is secure. This is especially important in the modern business environment, where cybercriminals are constantly seeking new ways to steal personal information. The right data management solution can help you to secure your data, preventing it from falling into the wrong hands. This not only helps to ensure that your customers’ personal information is safe but also protects your own organization’s sensitive information.
Data management helps you comply with the law.
Data management helps you comply with the law, including government regulations, industry regulations, and compliance standards. For example, if you have employees working in multiple countries or locations, data management would help ensure that everyone is provided equal access to the same benefits and compensation packages. In addition to meeting internal requirements for managing your company’s information responsibly, it can also help improve customer service by reducing confusion over pricing and other policies.
Data management also helps your business comply with laws that protect consumer and employee rights. For example, the Health Insurance Portability and Accountability Act (HIPAA) requires that all healthcare providers protect patient information by using security measures to prevent unauthorized access.
Information management mitigates the risk of errors.
Errors can be costly and time-consuming, so the more you reduce the risk of errors, the better. Data quality is important to achieving this goal. Big data management solutions help you to achieve accurate and timely responses to issues that may arise due to data errors.
When it comes to managing your business’ information, you need an automated solution that provides actionable insights into where your data resides and how it’s being used. This will allow you to determine which assets are most critical for operations so that you can focus on those assets when making decisions about investments in new technology or resources like human capital.
The most important element in ensuring data quality is knowing what you want your data to do. Be clear about what you’re trying to accomplish and how the data will be used before you start collecting it. This will help ensure that your efforts are not wasted on irrelevant information or flawed definitions of terms.
A big data management solution helps your business run more efficiently.
Big data management solutions help you make better decisions.
When you know what data is available and how to find it, you can make more informed decisions about your business. You can also save time by having access to the right data at the right time, which means that you won’t have to spend hours digging through a pile of Excel sheets looking for useful information. Instead, all of your critical information will be in one place so that accessing it is quick and easy—even if someone else needs access as well!
A big data management solution also helps find the right people who can work with your company’s specific needs based on their skill sets as well as their personality traits (like whether or not they’re collaborative). In addition, these solutions can help identify appropriate tools for accessing data, such as cloud storage platforms or relational database management systems (DBMSs). And finally, they’ll help identify vendors who offer services like big data analysis or predictive analytics modeling so that those resources are accessible when needed most.
Conclusion
We hope this article has helped you understand the benefits of big data management. We believe that a data management solution can help your business run more efficiently, which means you will have a better chance of success.
While there are many factors to consider when making this decision, we hope that our list of advantages provides some direction as you consider what’s best for your company.

