Blog

Built with BigQuery: How Tinyclues and Google Cloud deliver the CDP capabilities that marketers need

Built with BigQuery: How Tinyclues and Google Cloud deliver the CDP capabilities that marketers need

Editor’s note: The post is part of a series highlighting our awesome partners, and their solutions, that are Built with BigQuery.

What are Customer Data Platforms (CDPs) and why do we need them?

Today, customers utilize a wide array of devices when interacting with a brand. As an example, think about the last time you bought a shirt. You may start with a search on your phone as you take the subway to work. During that 20 minute ride, you narrow down the type of shirt . Later, as you take your lunch break, you spend a few more minutes refining your search on your work laptop and you are able to find two shirt models of interest. Pressed for time, you add both to your shopping cart at an online retailer to review at a later point. Finally, after you arrive back home and as you are checking your physical mail, you stumble across a sales advertisement for the type of shirt that you are looking for, available at your local brick and mortar store. The next day you visit that store during your lunch break and purchase the shirt. 

Many marketers face the challenge of creating a consistent 360 customer view that captures the customer lifecycle, as illustrated in the example above – including their online/offline journey, interacting with multiple data points across multiple data sources.

The evolution of managing customer data reached a turning point in the late 90’s with CRM software that sought to match current and potential customers with their interactions. Later as a backbone of data-driven marketing, Data Management Platforms (DMPs) expanded the reach of data management to include second and third party datasets including anonymous IDs. A Customer Data Platform combines these two types of systems, creating a unified, persistent customer view across channels (mobile, web etc) that provide data visibility and granularity at individual level.

A new approach to empowering marketing heroes

Tinyclues is a company that specializes in empowering marketers to drive sustainable engagement from their customers and generate additional revenue, without damaging customer equity. The company was founded in 2010 on a simple hunch: B2C marketing databases contain sufficient amounts of implicit information (data unrelated to explicit actions) to transform the way marketers interact with customers, and a new class of algorithms based on Deep Learning (sophisticated machine learning that mimics the way humans learn) holds the power to unlock this data’s potential. Where other players in the space have historically relied – and continue to rely – on a handful of explicit past behaviors and more than a handful of assumptions, Tinyclues’ predictive engine uses all of the customer data that marketers have available in order to formulate deeply precise models, down even to the SKU level. Tinyclues’ algorithms are designed to detect changes in consumption patterns in real-time, and adapt predictions accordingly.

This technology allows marketers to find precisely the right audiences for any offer during any timeframe, increasing engagement with those offers and, ultimately, revenue; additionally, marketers are able to increase campaign volume while decreasing customer fatigue and opt-outs, knowing that audiences are receiving only the most relevant messages. Tinyclues’ technology also reduces time spent building and planning campaigns by upwards of 80%, as valuable internal resources can be diverted away from manual audience-building.

Google Cloud’s Data Platform, spearheaded by BigQuery, provides a serverless, highly scalable, and cost-effective foundation to build this next generation of CDPs. 

Tinyclues Architecture:

To enable this scalable solution for clients, Tinyclues receives purchase and interaction logs from clients in addition to product and user tables. In most cases, this data is already in the client’s BigQuery instance, in which case they can be easily shared with Tinyclues utilizing BigQuery authorized views

In cases where the data is not in BigQuery, flat files are sent to Tinyclues via GCS and are ingested in the client’s data set via a lightweight Cloud Function. The orchestration of all pipelines is implemented via Cloud Composer (Google’s managed Airflow). The transformation of data is accomplished by utilizing simple select statements in the Data Built Tool (DBT), which is wrapped inside an airflow DAG that powers all data normalization and transformations. There are several other DAGs to fulfill more functionalities, including: 

Indexing the product catalog on Elastic Cloud (Elasticsearch managed service) on GCP to provide auto-complete search capabilities to TCs clients as shown below:

The export of Tinyclues-powered audiences to the clients’ activation channels, whether they are using SFMC, Braze, Adobe, GMP, or Meta.

Tinyclues AI/ML Pipeline powered by Google Vertex AI

TCs ML Training pipelines are used to train models that calculate propensity scores. They are composed using Airflow DAGs, powered by Tensorflow & Vertex AI Pipelines. BigQuery is used natively, without data movement, to perform as much feature engineering as possible in-place. 

TC uses the TFX library to run ML Pipelines in Vertex AI. Building on top of Tensorflow as their main deep learning framework of choice due to its maturity, open source platform, scalability and support for complex data structures (Ragged and Spare Tensors). 

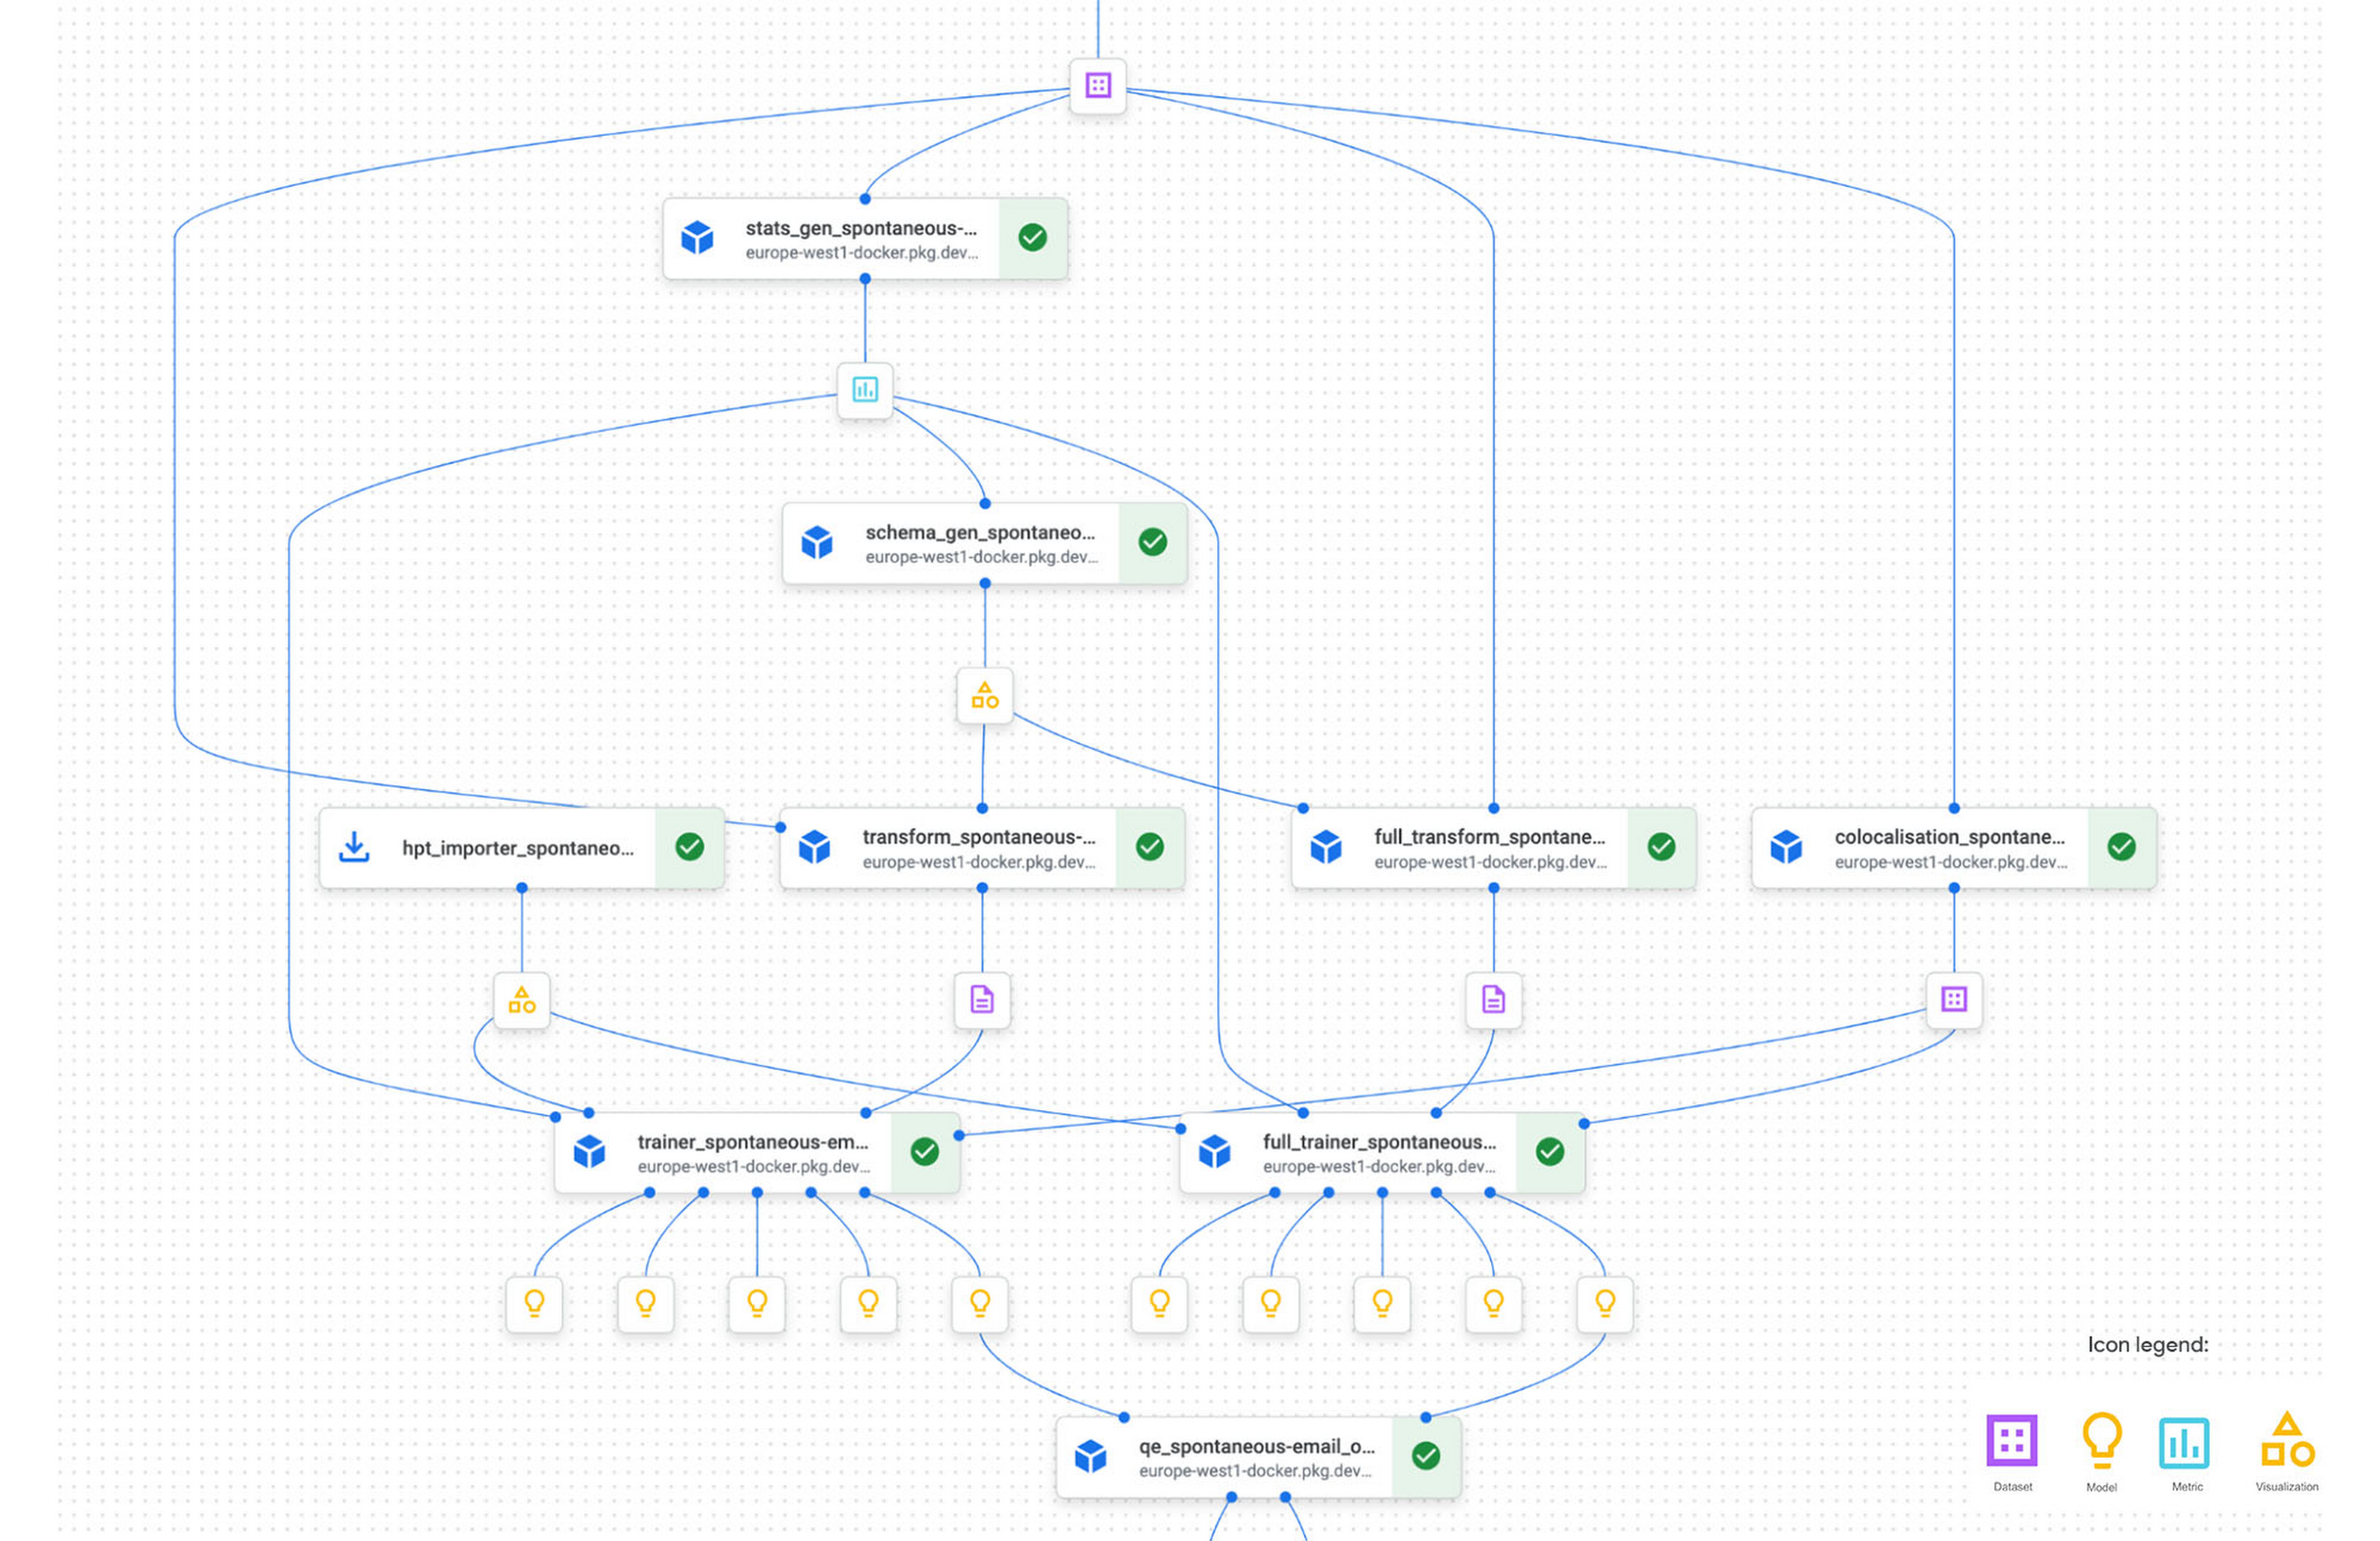
Below is a partial example of TC’s Vertex AI Pipeline graph, illustrating the workflow steps in the training pipeline. This pipeline allows for the modularization & standardization of functionality into easily manageable building blocks. These blocks are composed of TFX components (TC reuses most of the standard components in addition to customizing some such as a proprietary implementation of the Evaluator to compute both ML Metrics (which is part of the standard implementation) but also more Business Metrics like Overlap of clickers etc. The individual components/steps are chained with DSL to form a pipeline that is modular and easily orchestrated or updated as needed.

With the trained Tensorflow models available in GCS, TCs exposes these in BigQuery ML (BQML) to enable their clients to score millions of users for their propensity to buy X or Y within minutes. This would not be possible without the power of BigQuery and also frees TC from previously experienced scalability issues.

As an illustration, TC has the need to score thousands of topics among millions of users. This used to take north of 20 hours on their previous stack, and now takes less than 20 minutes thanks to the optimization work that TC has implemented in their custom algorithm and the sheer power of BQ to scale to any workload accordingly. 

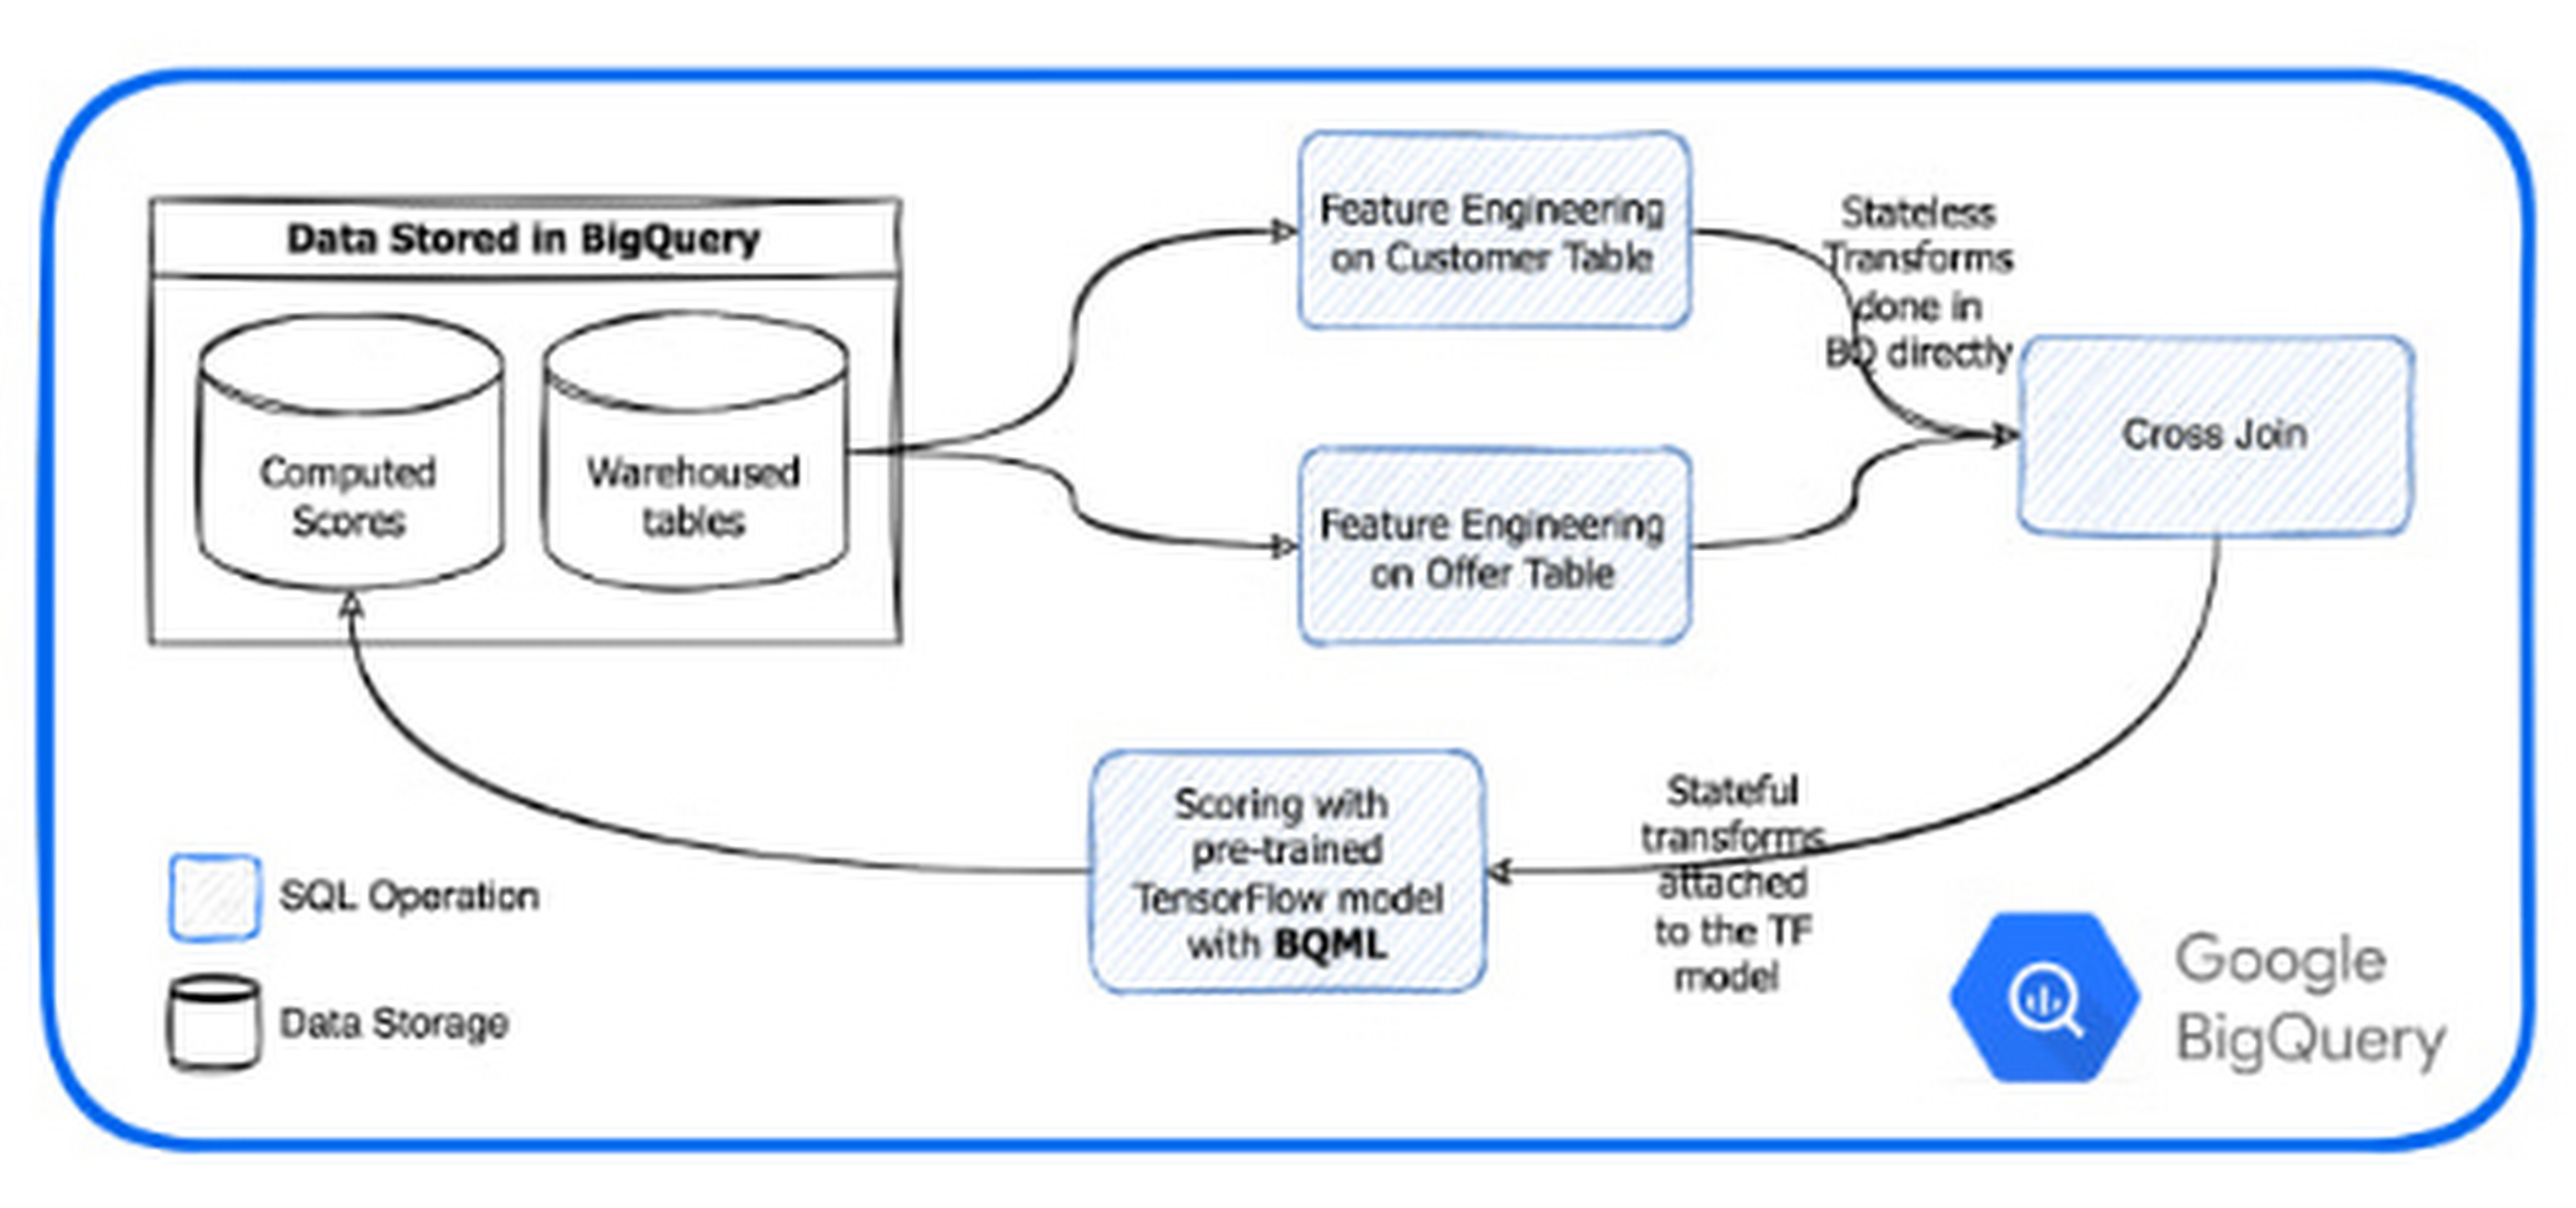
Data Gravity: Breaking the Paradigm – Bringing the Model to your Data

BQML enables TC to call pre-trained TensorFlow models within an SQL environment, thus avoiding exporting data in and out of BQ using already provisioned BQ serverless processing power. Using BQML removes the layers between the models and the data warehouse and allows them to express the entire inference pipe as a number of SQL requests. TC no longer has to export data to load it into their models. Instead, they are bringing their models to the data.

Avoiding the export of data in and out of BQ and the serverless provisioning and start of machines saves significant time. As an example, exporting an 11M lines campaign for a large client previously took 15 min or more to process. Deployed on BQML it now takes minutes with more than half of the processing time attributed to network transfers to our client system. 

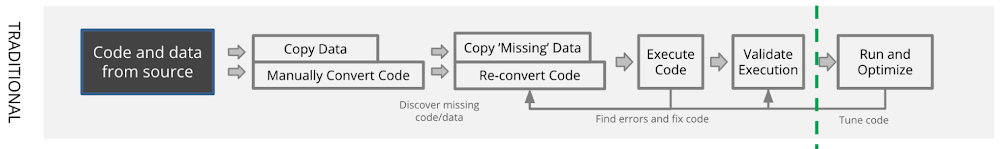
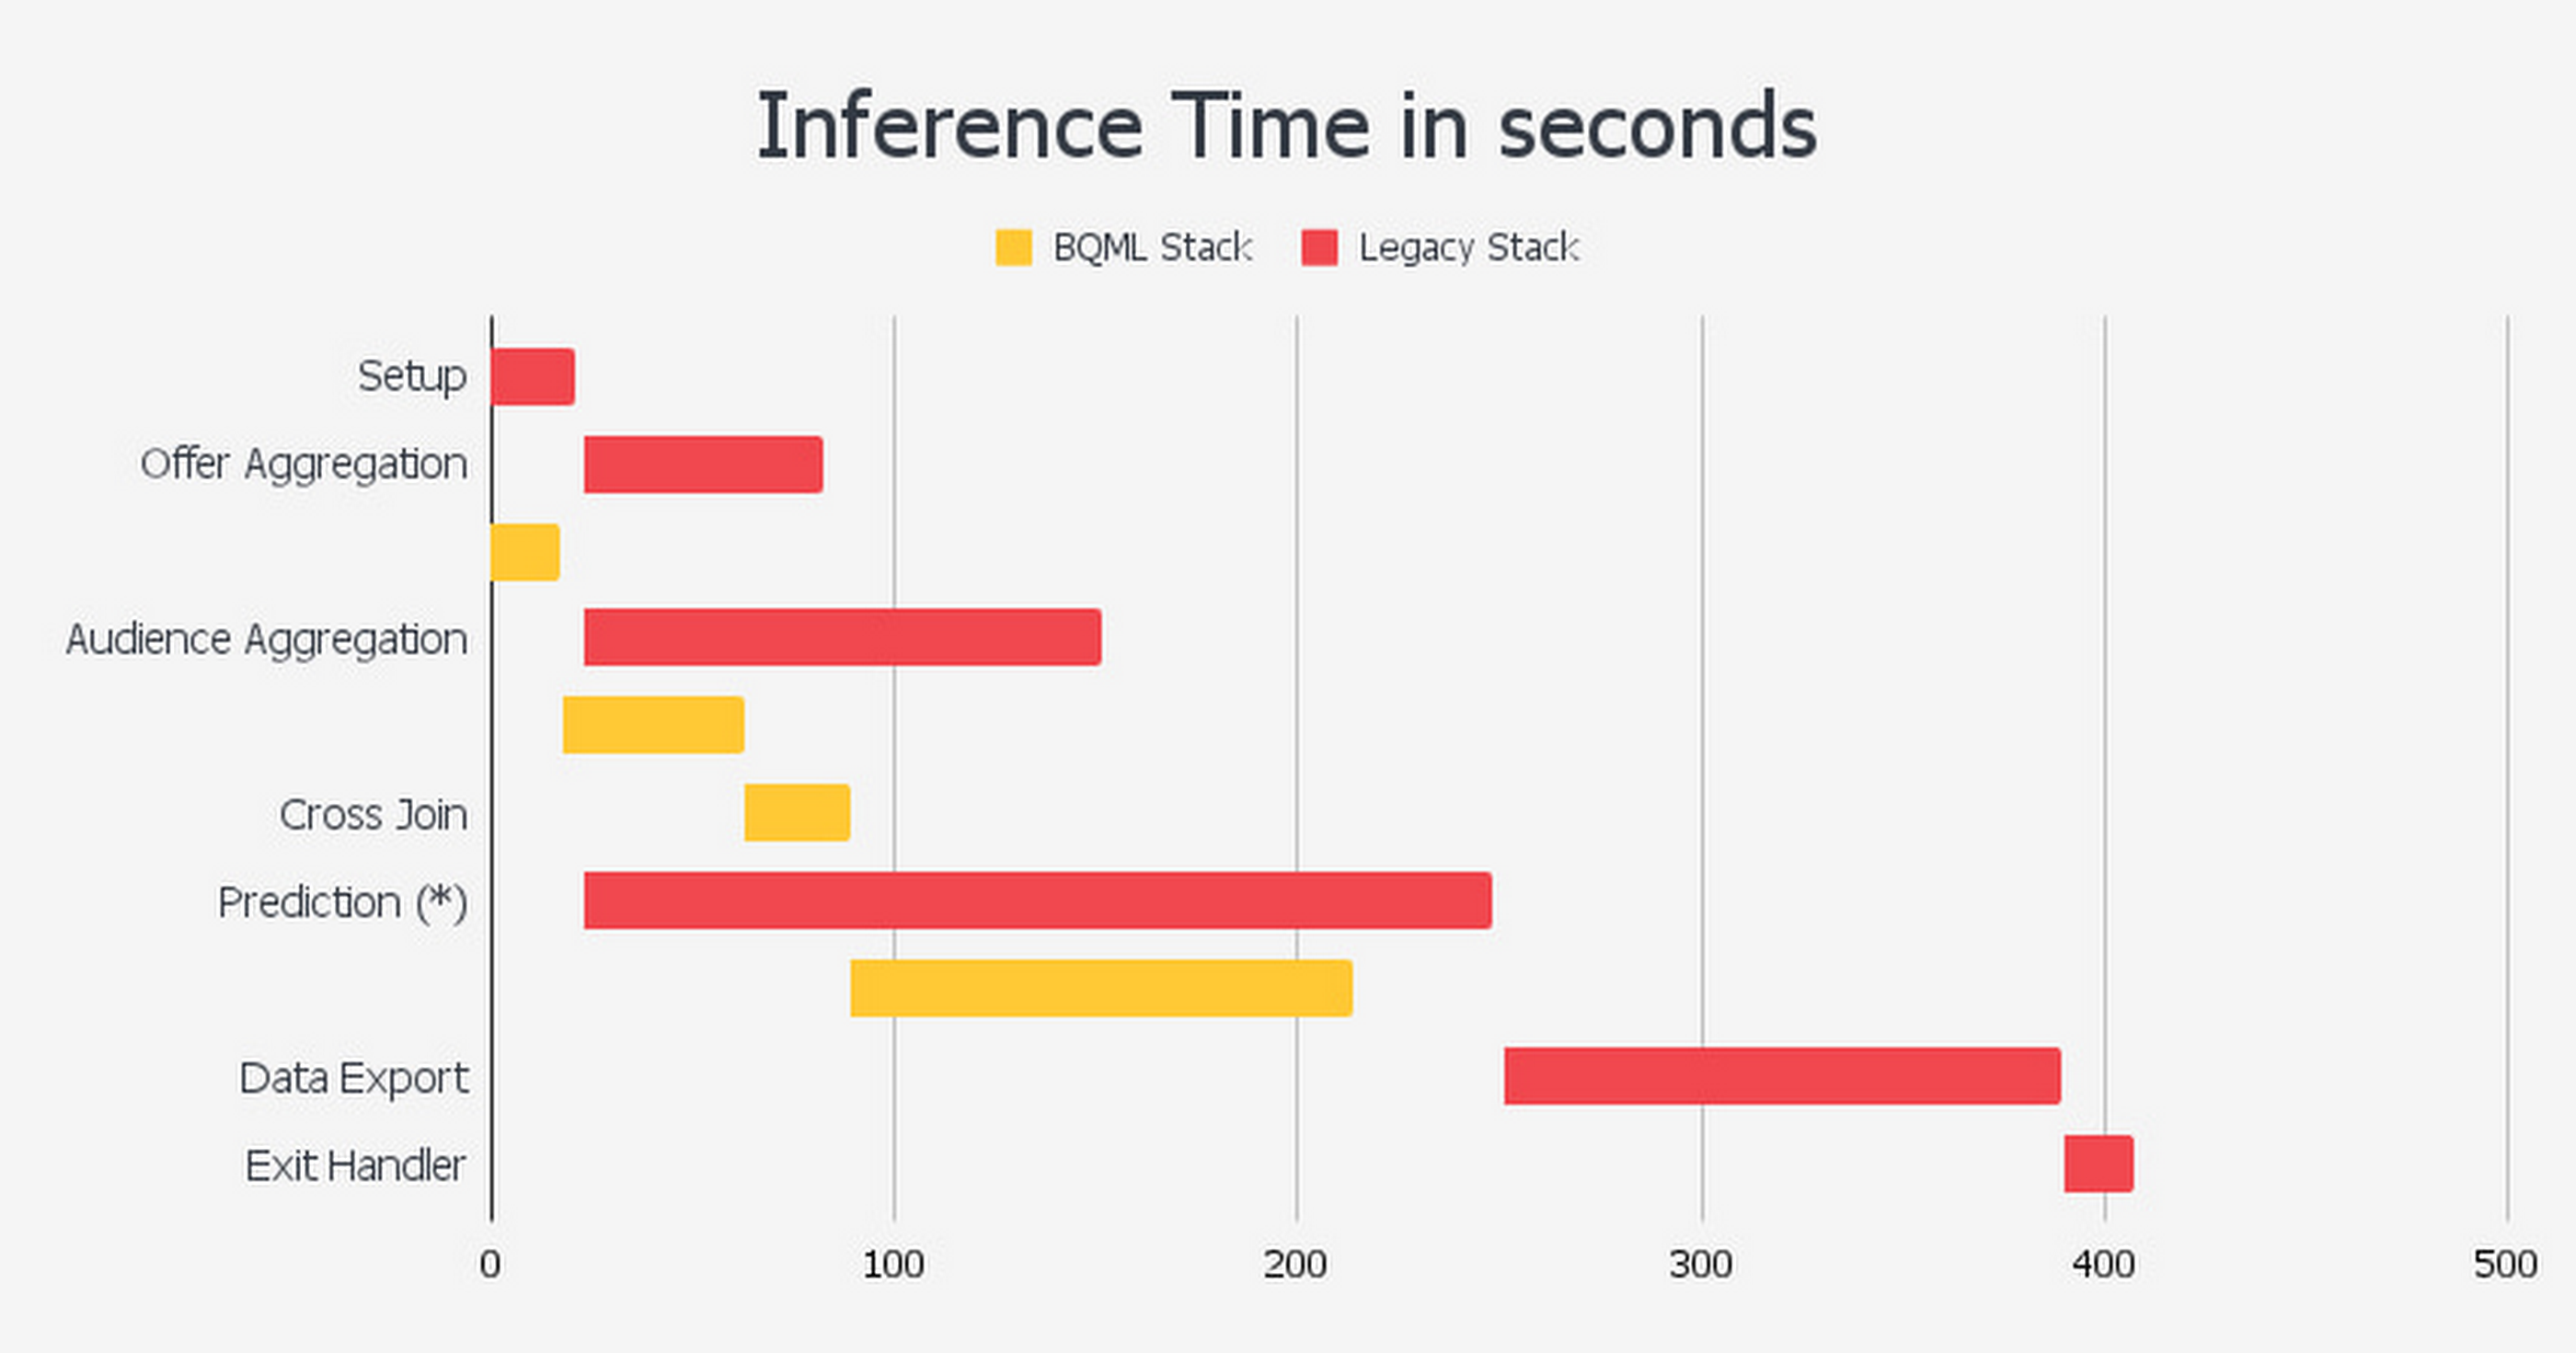
Inference times in BQML compared to TCs legacy stack:

As can be seen, using this approach enabled by BQML, the reduction in the number of steps leads to a 50% decrease in overall inference time, improving upon each step of the prediction.

The Proof is in the pudding

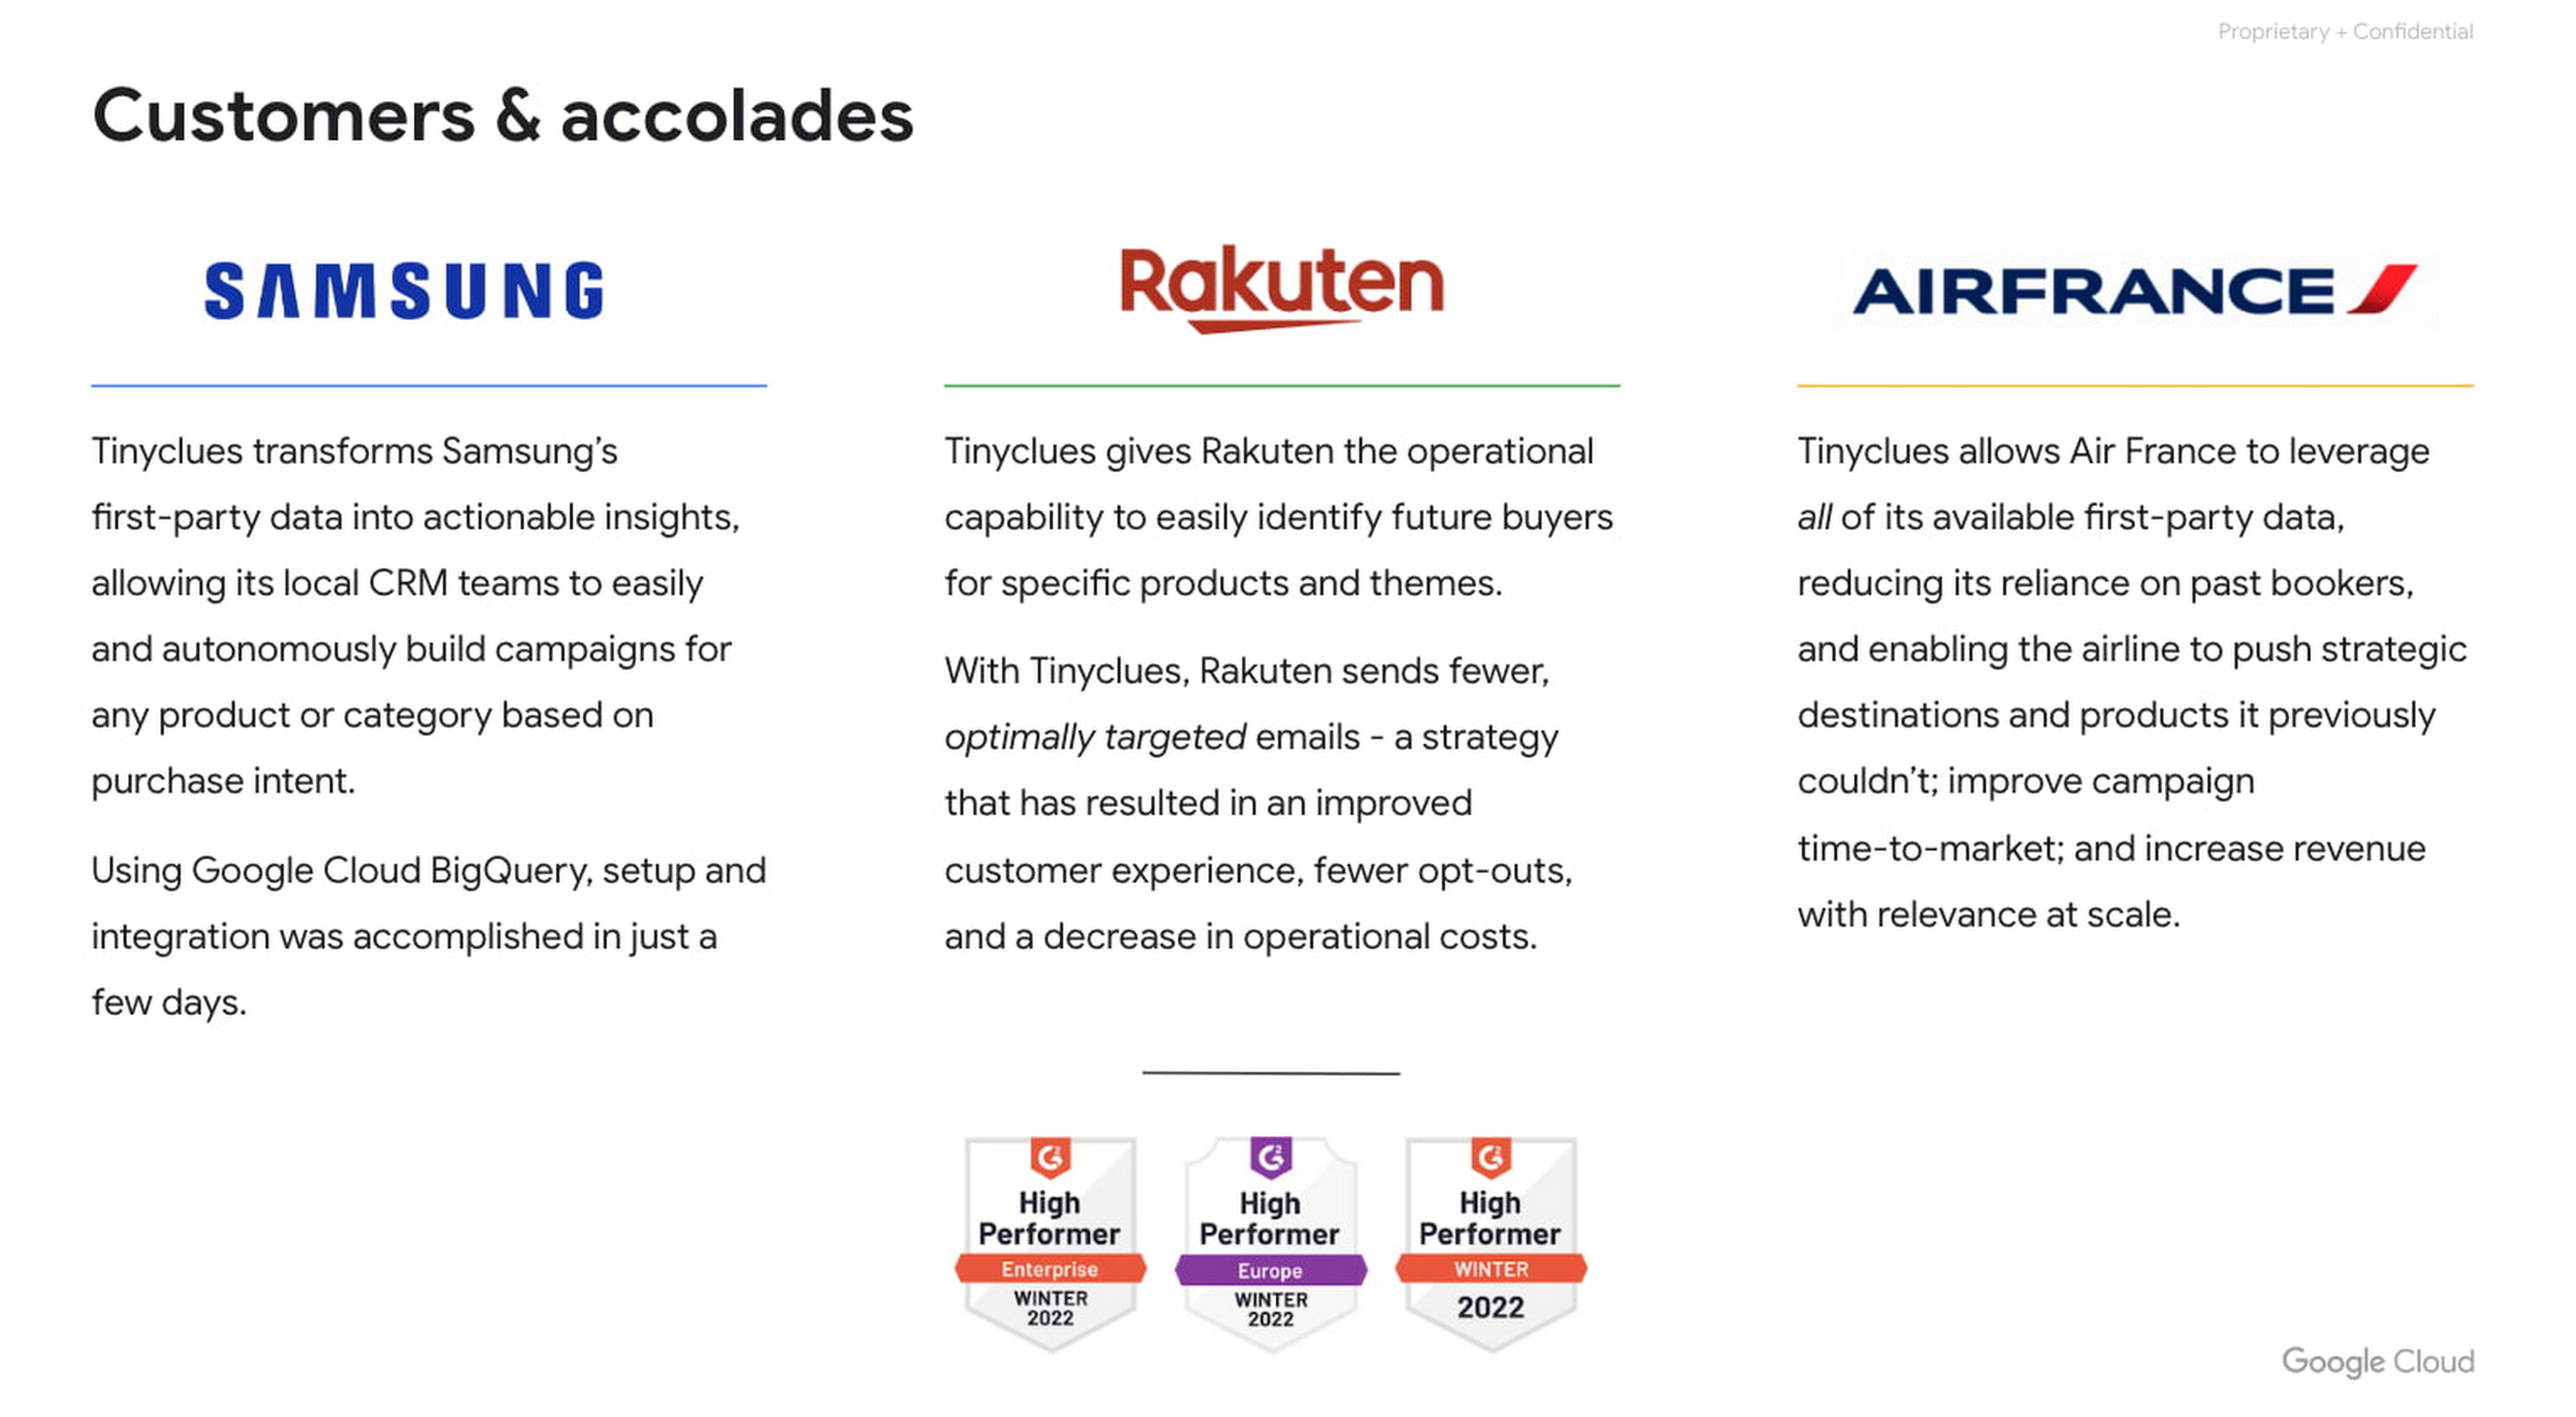
Tinyclues has consistently delivered on its promises of increased autonomy for CRM teams, rapid audience building, superior performance against in-house segmentation, identification of untapped messaging and revenue opportunities, fatigue management, and more, working with partners like Tiffany & Co, Rakuten, and Samsung, among many others.

Conclusion

Google’s data cloud provides a complete platform for building data-driven applications like the headless CDP solution developed by Tinyclues — from simplified data ingestion, processing, and storage to powerful analytics, AI, ML, and data sharing capabilities — all integrated with the open, secure, and sustainable Google Cloud platform. With a diverse partner ecosystem, open-source tools, and APIs, Google Cloud can provide technology companies the portability and differentiators they need to serve the next generation of marketing customers.  

To learn more about Tinyclues on Google Cloud, visit Tinyclues. Click here to learn more about Google Cloud’s Built with BigQuery initiative. 

We thank the many Google Cloud team members who contributed to this ongoing data platform  collaboration and review, especially Dr. Ali Arsanjani in Partner Engineering.

Related Article

Read Article

Source : Data Analytics Read More

100,000 new SUVs booked in 30 minutes: How Mahindra built its online order system

100,000 new SUVs booked in 30 minutes: How Mahindra built its online order system

Almost 70 years ago, starting in 1954, the Mahindra Group began assembling the Indian version of the Willys CJ3. Willys were arguably the first SUV in any country, and that vehicle would lay the groundwork for our Automotive Division’s continued leadership in the space, up to our iconic and best-selling Scorpio models.

When it came time to launch the newest version, the Scorpio-N this summer, we knew we wanted to attempt something as special and different as the vehicle itself. As in most markets, vehicle sales in India are largely made through dealerships. Yet past launches have shown us an enthusiasm among our tech-savvy buyers to have a different kind of sales experience, not unlike those they have come to expect from so many other products. 

As a result, we set out to build a first-of-its-kind site for digital bookings. We knew it would face a serious surge, like most e-commerce sites on a big sales day, but that was the kind of traffic automotive sites are hardly accustomed to.

To our delight, the project exceeded our wildest expectations, setting digital sales records in the process. On launch day, July 30, 2022, we saw more than 25,000 booking requests in the first minute, and 100,000 booking requests in the first 30 minutes, totaling USD 2.3 billion in car sales. 

At its peak, there were around 60,000 concurrent users on the booking platform trying to book the vehicle. Now let’s look under the hood of how to create a platform robust and scalable enough to handle an e-commerce-level rush for the automotive industry.

A cloud-first approach to auto sales and architecture

Our aim was to build a clean, lean, and highly efficient system, which is also fast, robust, and scalable. And to achieve it, we went back to the drawing board to remove all the inefficiencies in our existing online and dealer booking processes. We put on our design thinking hats, to give our customers and dealers a platform that was meant to be used during high rush launches and does the only thing which mattered during launch day: the ability for all to book a vehicle swiftly and efficiently.

While order booking use cases are quite common development scenarios, our particular challenge was to handle a large volume of orders in a very short time, and ensure almost immediate end-user response times. Each order required a sequence of business logic checks, customer notifications, payment flow, and interaction with our CRM systems. We knew we needed to build a cloud-first solution that could scale to meet the surge and then rapidly scale down once the rush was over.

We arrived at a list of required resources about three months before the launch date and planned for resources to be reserved for our Google Cloud project. We chose to build the solution on managed platform services, which allowed us to focus on developing our solution logic rather than worrying about day-two concerns such as platform scalability and security. The core platform stack is comprised of Google Kubernetes Engine (GKE), Cloud Spanner, and Cloud Memorystore (Redis), and is supported by Container Registry, Pub/Sub, Cloud Functions, reCaptcha Enterprise, Google Analytics, and Google Cloud’s operations suite. The solution architecture is described in detail in the following section.

Architecture components

The diagram below depicts the high-level solution architecture. We had three key personas interacting with our portal: customers, dealers, and our admin team. To identify the microservices, we dissected the use cases for each of these personas and designed parameterized microservices to serve them. As solution design progressed, our microservices-based approach allowed us to quickly adapt business logic and keep up with changes suggested by our sales teams. The front-end web application was created using ReactJS as a single-page application, while the microservices were built using NodeJS and hosted on Google Kubernetes Engine (GKE).

Container orchestration with Google Kubernetes Engine

GKE provides Standard and Autopilot as two modes of operation. In addition to the features provided by the Standard mode, GKE Autopilot mode adds day-two conveniences such as Google Cloud managed nodes. We opted for GKE Standard mode, with nodes provisioned across three Google Cloud availability zones in the Mumbai Google Cloud region, as we were aware of the precise load pattern to be anticipated, and the portal was going to be relatively short-lived. OSS Istio was configured to route the traffic within the cluster, which was sitting behind a cloud load balancer, itself behind the CDN. All microservices code components were built, packaged into containers, and deployed via our corporate build platform. At peak, we had 1,200 GKE nodes in operation.

All customer notifications generated in the user flow were delivered via email and SMS/text messages. These were routed via Pub/Sub, acting as a queue, with Cloud Functions draining the queues and delivering them via partner SMS gateways and Mahindra’s email APIs. Given the importance of sending timely SMS notifications of booking confirmations, two independent third-party SMS gateway providers were used to ensure redundancy and scale. Both Pub/Sub and Cloud Functions scaled automatically to keep up with notification workload.  

Data strategy  

Given the need for incredibly high transaction throughput for a short burst of time, we chose Spanner as the primary datastore as it offers the best features of relational databases and scale-out performance of NoSQL databases. Using Spanner not only provided us the scale needed to store the car bookings rapidly, but also allowed the admin teams to see real-time drill-down pivots of sales performance across vehicle models, towns and dealerships, without the need for an additional analytical processing layer. Here’s how:
Spanner uniquely offers Interleaved tables that physically collocate the child table rows with the parent table row, leading to faster retrieval. Spanner also has a scale-out model where it automatically and dynamically partitions data across compute nodes (splits) to scale out the transaction workload. We were able to prevent Spanner from dynamically partitioning data during peak traffic, by pre-warming the Spanner database with representative data, and allowing it to settle before the booking window opened. 

Together, these benefits ensured a quick and seamless booking and checkout process for our customers.

We chose Memorystore (Redis) to serve mostly static, master data such as models, cities/towns, and dealer lists. It also served as the primary store for user session/token tracking. Separate Memorystore clusters were provisioned for each of the above needs. 

UI/UX Strategy  

We kept the website in line with a lean booking process. We only had the necessary components that a customer would need to book the vehicle: 1) vehicle choice, 2) the dealership to deliver the vehicle to, 3) the customer’s personal details, and 4) payment mode.

Within the journey, we worked towards a lean system and ensured all images and other master assets were optimized for size and pushed to Cloudflare CDN, with cache enabled to reduce latency and to reduce server calls. All the static and resource files were pushed to CDN during the build process.

On the service backend side, we had around 10 microservices that were independent of each other. Each microservice was scaled proportionally to the request frequency and the data it was processing. The source code was reviewed and optimized to have fewer iterations. We made sure there were no bottlenecks in any of the microservices and had mechanisms in place to recover in case there were some failures.

Monitoring the solution

Monitoring the solution was going to be a key necessity. We anticipated that customer volume would spike when the web portal launched on a specific date and time, so the solution team required real-time operational visibility into how each component was performing. To monitor the performance of all Google Cloud services, specific Google Cloud Monitoring dashboards were developed. Custom dashboards were also developed to analyze application logs via Cloud Trace and Cloud Logging. This allowed the operations team to monitor some business metrics correlated with operations status in real time. The war room team kept track of end users’ experiences by manually navigating through the main booking flow and logging in to the portal. 

Finally, integration with Google Analytics gave our team almost real-time visibility to user traffic in terms of use cases, with the ability to drill down to get city/state-wise details. 

Preparing for the portal launch

The team did extensive performance testing ahead of the launch. The critical parameter was to achieve low, single-digit end-user response times in seconds, for all customer requests. Given that the architecture exclusively used REST APIs and sync calls wherever possible for client-server communication, the team had to test the REST APIs to arrive at the best GKE and Spanner sizing to meet the peak performance test target of 250,000 concurrent users. Locust, an open-source performance testing tool running on an independent GKE cluster, was used to perform and monitor the stress test. Numerous configurations (e.g. min/max pod settings in GKE, Spanner indexes and interleaved storage settings, introducing MemoryStore for real-time counters, etc.) were tuned during the process. We did extensive load testing which established GKE’s and Spanner’s ability to handle the traffic spike we were expecting by a significant margin.

Transforming the SUV buying experience

In India, the traditional SUV purchasing process is offline and centered around dealerships. Pivoting to an exclusive online booking experience needed internal business process tweaks to make it simple and secure for customers and dealers to do online bookings themselves. With our deep technical partnership with Google Cloud in powering the successful Scorpio-N launch event, we feel we have influenced a shift in the SUV buying experience, where we received more than 70% of the first 25,000 booking requests directly from buyers sitting in their homes. 

The Mahindra Automotive team looks forward to continuing to drive digital innovations in the Indian automotive sector with Google Cloud.

Related Article

Read Article

Source : Data Analytics Read More

Moving to Log Analytics for BigQuery export users

Moving to Log Analytics for BigQuery export users

If you’ve already centralized your log analysis on BigQuery as your single pane of glass for logs & events…congratulations! You’re already benefiting from BigQuery’s:

Petabyte-scale cost-effective analytics,

Analyzing heterogeneous data across multi-cloud & hybrid environments,

Running on fully-managed serverless data warehouse with enterprise security features,

Democratizing analytics for everyone using standard familiar SQL with extensions. 

With the introduction of Log Analytics (Public Preview), something great is now even better. It leverages BigQuery while also reducing your costs and accelerating your time to value with respect to exporting and analyzing your Google Cloud logs in BigQuery.

This post is for users who are (or are considering) migrating from BigQuery log sink to Log Analytics. We’ll highlight the differences between the two, and go over how to easily tweak your existing BigQuery SQL queries to work with Log Analytics. For an introductory overview of Log Analytics and how it fits in Cloud Logging, see our user docs.

Comparison

When it comes to advanced log analytics using the power of BigQuery, Log Analytics offers a simple, cost-effective and easy-to-operate alternative to exporting to BigQuery with Log Router (using log sink) which involves duplicating your log data. Before jumping into examples and patterns to help you convert your BigQuery SQL queries, let’s compare Log Analytics and Log sink to BigQuery.

Log sink to BigQuery

Log Analytics

Operational Overhead

Create and manage additional log sink(s) and BigQuery dataset to export a copy of the log entries

Set up a Google-managed linked BigQuery dataset with one click via Cloud Console

Cost

Pay twice for storage and ingestion since data is duplicated in BigQuery

BigQuery storage and ingestion cost are included in Cloud Logging ingestion costs

Free tier of queries from Log Analytics

Storage

Schema defined at table creation time for every log type

Log format changes can cause schema mismatch errors 

Single unified schema

Log format changes do not cause schema mismatch errors

Analytics

Query logs in SQL from BigQuery

Query logs in SQL in Log Analytics page or from BigQuery page

Easier to query JSON fields with native JSON data type 

Faster search with pre-built search indexes

Security

Manage access to log bucket

Manage access to BigQuery dataset to secure logs and ensure integrity

Manage access to log bucket

Manage only read-only access to linked BigQuery dataset

Comparing Log Analytics with traditional log sink to BigQuery 

Simplified table organization

The first important data change is that all logs in a Log Analytics-upgraded log bucket are available in a single log view _AllLogs with an overarching schema (detailed in next section) that supports all Google Cloud log types or shapes. This is in contrast to traditional BigQuery log sink where each log entry gets mapped to a separate BigQuery table in your dataset based on the log name, as detailed in BigQuery routing schema. Below are some examples:

Table path in SQL FROM clause

The second column in this table assumes your BigQuery log sink is configured to use partitioned tables. If your BigQuery log sink is configured to use date-sharded tables, your queries must also account for the additional suffix (calendar date of log entry) added to table names e.g. cloudaudit_googleapis_com_data_access_09252022.

As shown in the above comparison table, with Log Analytics, you don’t need to know apriori the specific log name nor the exact table name for that log since all logs are available in the same view. This greatly simplifies querying especially when you want to search and correlate across different logs types.

You can still control the scope of a given query by optionally specifying log_id or log_name in your WHERE clause. For example, to restrict the query to data_access logs, you can add the following:

WHERE log_id = “cloudaudit.googleapis.com/data_access”

Unified log schema

Since there’s only one schema for all logs, there’s one superset schema in Log Analytics that is managed for you. This schema is a collation of all possible log schemas. For example, the schema accommodates the different possible types of payloads in a LogEntry (protoPayload, textPayload and jsonPayload) by mapping them to unique fields (proto_payload, text_payload and json_payload respectively):

Log field names have also generally changed from camelCase (e.g. logName) to snake_case (e.g. log_name). There are also new fields such as log_id, that is log_id of each log entry.

Another user-facing schema change is the use of native JSON data type by Log Analytics for some fields representing nested objects like json_payload and labels. Since JSON-typed columns can include arbitrary JSON objects, the Log Analytics schema doesn’t list the fields available in that column. This is in contrast to traditional BigQuery log sink which has pre-defined rigid schemas for every log type including every nested field.  With a more flexible schema that includes JSON fields, Log Analytics can support semi-structured data including arbitrary logs while also making queries simpler, and in some cases faster.

Schema migration guide

With all these table schema changes, how would you compose new or translate your existing SQL queries from traditional BigQuery log sink to Log Analytics?

The following lists side-by-side all log fields and maps them to corresponding column names and types, for both cases of traditional Log sink routing into BigQuery, and the new Log Analytics. Use this table as a migration guide to help you identify breaking changes, properly reference the new fields and methodically migrate your existing SQL queries:

All fields with breaking changes are bolded to make it visually easier to track where changes are needed. For example, if you’re querying audit logs, you’re probably referencing and parsing protopayload_auditlog STRUCT field. Using the schema migration table above, you can see how that field now maps to proto_payload.audit_log STRUCT field with Log Analytics. 

Notice the newly added fields are marked in yellow cells and the JSON-converted fields are marked in red cells.

Schema changes summary

Based on the above schema migration guide, there are 5 notable breaking changes (beyond the general column name change from camelCase to snake_case):

1) Fields whose type changed from STRING to JSON (highlighted in red above):

metadataJson

requestJson

responseJson

resourceOriginalStateJson 

2) Fields whose type changed from STRUCT to JSON (also highlighted in red above):

labels

resource.labels

jsonPayload

jsonpayload_type_loadbalancerlogentry

protopayload_auditlog.servicedata_v1_bigquery

protopayload_auditlog.servicedata_v1_iam

protopayload_auditlog.servicedata_v1_iam_admin

3) Fields which are further nested:

protopayload_auditlog (now proto_payload.audit_log)

protopayload_requestlog (now proto_payload.request_log)

4) Fields which are coalesced into one:

jsonPayload (now json_payload)

jsonpayload_type_loadbalancerlogentry (now json_payload)

jsonpayload_v1beta1_actionlog (now json_payload)

5) Other fields with type changes:

httpRequest.latency (from FLOAT to STRUCT)

Query migration patterns

For each of these changes, let’s see how your SQL queries should be translated. Working through examples, we highlight below SQL excerpts and provide a link to complete SQL query in Community Security Analytics (CSA) repo for full real-world examples. In the following examples:

‘Before’ refers to SQL with traditional BigQuery log sink, and

‘After’ refers to SQL with Log Analytics

Pattern 1: Referencing nested field from a STRING column now turned into JSON: 
This pertains to some of the fields highlighted in red in the schema migration table, namely: 

metadataJson

requestJson

responseJson

resourceOriginalStateJson

Before: JSON_VALUE(protopayload_auditlog.metadataJson, ‘$.violationReason’)
After: JSON_VALUE(proto_payload.audit_log.metadata.violationReason)

Real-world full query: CSA 1.10

Before: JSON_VALUE(protopayload_auditlog.metadataJson, ‘$.ingressViolations[0].targetResource’)
After: JSON_VALUE(proto_payload.audit_log.metadata.ingressViolations[0].targetResource)

Real-world full query: CSA 1.10

Pattern 2: Referencing nested field from a STRUCT column now turned into JSON: 
This pertains to some of the fields highlighted in red in the schema migration table, namely: 

labels

resource.labels

jsonPayload

jsonpayload_type_loadbalancerlogentry

protopayload_auditlog.servicedata*

Before: jsonPayload.connection.dest_ip
After: JSON_VALUE(jsonPayload.connection.dest_ip)

Real-world full query: CSA 6.01

Before: resource.labels.backend_service_name
After: JSON_VALUE(resource.labels.backend_service_name)

Real-world full query: CSA 1.20

Before: jsonpayload_type_loadbalancerlogentry.statusdetails
After: JSON_VALUE(json_payload.statusDetails)

Real-world full query: CSA 1.20

Before: protopayload_auditlog.servicedata_v1_iam.policyDelta.bindingDeltas
After: JSON_QUERY_ARRAY(proto_payload.audit_log.service_data.policyDelta.bindingDeltas)

Real-world full query: CSA 2.20

Pattern 3: Referencing fields from protoPayload:
This pertains to some of the bolded fields in the schema migration table, namely: 

protopayload_auditlog (now proto_payload.audit_log)

protopayload_requestlog (now proto_payload.request_log)

Before: protopayload_auditlog.authenticationInfo.principalEmail
After: proto_payload.audit_log.authentication_info.principal_email

Real-world full query: CSA 1.01

Pattern 4: Referencing fields from jsonPayload of type load balancer log entry:

Before: jsonpayload_type_loadbalancerlogentry.statusdetails
After: JSON_VALUE(json_payload.statusDetails)

Real-world full query: CSA 1.20

Pattern 5: Referencing latency field in httpRequest:

Before: httpRequest.latency
After: http_request.latency.nanos / POW(10,9)

Conclusion

With Log Analytics, you can reduce the cost and complexity of log analysis, by moving away from self-managed log sinks and BigQuery datasets, into Google-managed log sink and BigQuery dataset while also taking advantage of faster and simpler querying. On top of that, you also get the features included in Cloud Logging such as the Logs Explorer for real-time troubleshooting, logs-based metrics, log alerts and Error Reporting for automated insights. 

Armed with this guide, switching to use Log Analytics for log analysis can be easy. Use the above schema migration guide and apply the 5 prescriptive migration patterns, to help you convert your BigQuery SQL log queries or to author new ones in Log Analytics.

Related Article

Read Article

Source : Data Analytics Read More

Secure streaming data with Private Service Connect for Confluent Cloud

Secure streaming data with Private Service Connect for Confluent Cloud

Data speed and security should not be mutually exclusive, which is why Confluent Cloud, a cloud-first data streaming platform built by the founders of Apache Kafka, secures your data through encryption at rest and enables secure data in motion.

However, for the most sensitive data — particularly data generated by organizations in highly regulated industries such as financial services and healthcare — only fully segregated private pipelines will do. That’s why we’re excited to announce that Confluent Cloud now supports Google Cloud Private Service Connect (PSC) for secure network connectivity. 

A better data security solution

For many companies, a multi-layer data security policy starts with minimizing network attack vectors exposed to the public internet. Blocking internet access to key resources such as Apache Kafka clusters can prevent security breaches, DDOS attacks, spam, and other issues. To enable communications, organizations have relied on virtual private cloud (VPC) peering — where two parties share network addresses across two networks — for private network connectivity, but this has its downsides. 

VPC peering requires both parties to coordinate on an IP address block for communication between the networks. Many companies have limited IP space and finding an available IP address block can be challenging, requiring a lot of back and forth between teams. This can be especially painful in large organizations with hundreds of networks connected in sophisticated topologies. Applications that need access to Kafka are likely spread across many networks, and peering them all to Confluent Cloud is a lot of work.

Another concern of VPC peering is that each party has access to the other’s network. Confluent Cloud users want their clients to initiate connections to Confluent Cloud but restrict Confluent from having access back into their network.

Google Cloud PSC can overcome these shortfalls. PSC allows for a one-way, secure, and private connection from your VPC to Confluent Cloud. Confluent exposes a service attachment for each new network, for which customers can create corresponding PSC endpoints in their own VPCs on Google Cloud. There’s no need to juggle IP address blocks as clients connect using the PSC endpoint. The one-way connection from the customer to Confluent Cloud means there is less surface area for the network security team to keep secure. Making dozens or even hundreds of PSC connections to a single Confluent Cloud network doesn’t require any extra coordination, either with Confluent or within your organization.

This networking option combines a high level of data security with ease of setup and use. Benefits of using Private Service Connect with your Confluent Cloud networks include:

A secure, unidirectional gateway connection to Confluent Cloud that must be initiated from your VPC network to allow traffic to flow over Private Service Connect to Confluent Cloud

Centralized management with Google Cloud Console to configure DNS resolution for your private endpoints 

Registration of Google Cloud project IDs helps ensure that only your trusted projects have access

No need to coordinate CIDR ranges between your network and Confluent Cloud

To learn how to use Private Service Connect with your Confluent Cloud networks, read the developer documentation on confluent.com

The power of managed Kafka on Google Cloud

Confluent on Google Cloud brings the power of real-time data streaming to organizations without the exorbitant costs and technical challenges of in-house solutions. As Confluent grows and reaches across different industries, it will continue to support more customers who face more highly regulated or other risk-averse use cases. For those customers, private connectivity from a virtual network is an ideal solution for accessing Confluent’s SaaS offerings. Confluent can now address this need by offering Private Service Connect to simplify architectures and connectivity in Google Cloud while helping to eliminate the risk of data exfiltration. 

With the addition of Private Service Connect support, it’s easier than ever for organizations in need of private connectivity to take advantage of Confluent’s fully managed cloud service on Google Cloud to help eliminate the burdens and risks of self-managing Kafka and focus more time on building apps that differentiate your business.

Get started with a free trial on the Google Cloud Marketplace today. And to learn more about the launch of Private Service Connect, visit cnfl.io/psc.

Related Article

Read Article

Source : Data Analytics Read More

Essential Productivity Hacks in Cloud-Centric Workplaces

Essential Productivity Hacks in Cloud-Centric Workplaces

The market for cloud technology is growing remarkably. One study shows spending on cloud services doubled between 2017 and 2020 from $30 billion to $60 billion.

Cloud technology is changing the face of the modern workplace. More companies than ever are leveraging the cloud to boost productivity, improve customer service strategies and streamline the research and development process.

A report by Flexera shows that 57% of all businesses have migrated their work to the cloud as of 2020. The pandemic played a huge shift in this adoption of cloud technology. The trend is likely to further accelerate as more businesses discover the benefits and feel the pressure to utilize the cloud to retain a competitive edge.

Any company that leverages cloud technology will need to so in a way that ensures maximum productivity. Keep reading to learn more.

How Can Companies Maximize Productivity with Cloud Technology?

Any successful business understands the importance of productivity in the workplace. A productive workplace ensures more profit for the company and enhances business relationships. It is directly linked to outstanding customer service and plays a significant role in maintaining client loyalty. A company thrives because of the continuous support of clients who are satisfied with the service and are willing to recommend the business to others. Additionally, the company’s employees provide excellent work because they have motivation from their management; hence, they thrive in the workplace environment.

Fortunately, the cloud can help companies boost productivity immensely. One study found that 79% of business professionals using cloud technology have reported a boost in productivity.

Productivity gains driven by cloud computing have tangible benefits for the company. Generally, a business that nurtures productivity achieves its goals. Thus, employees can expect more incentives such as raises and bonuses, which push them even more to produce excellent work for the company’s benefit. For that reason, productivity in the workplace is an essential factor in the success of any business, and business owners who recognize its significance thrive even when competition is stiff in their chosen industry.

Of course, having the right employees working in the company is key to running a productive business. However, finding the most qualified people for the company’s specific needs can take much time and effort.

The benefits of finding the right employees will also be minimal if they don’t have the right tools. Therefore, it is imperative to have the right cloud resources and know how to tap them to ensure employees stay productive.

After deciding on hiring new talent, an effective employee onboarding process helps the new hire understand more about the company and their specific responsibilities so they can fit in quickly and be more confident about accomplishing their assigned tasks.

Below are strategies to improve workplace productivity.

Provide office workers with up-to-date office equipment and cloud solutions

Regardless of whether a company is starting or established, the productivity of its employees greatly depends on the type of equipment available to them. When employees work with modern equipment, productivity increases, work is accomplished quickly, and the business runs smoothly. If the company cannot provide employees with quality tools to work with, they cannot be expected to be efficient. Additionally, the company’s image is enhanced when it is equipped with the latest technology.

There are a number of cloud tools that your company can use to ensure employees remain as productive as possible. Todoist, 1Password, Xero and Google Drive are some of the most important cloud resources for companies trying to boost productivity on the cloud.

However, it is important to not overinvest in cloud technology. You will find that some tools have a long learning curve and you don’t want to spend the resources on them if they won’t be used frequently. Make sure that you invest in cloud tools that you intend to use often enough for them to have a decent ROI.

Minimize unnecessary meetings… even on the cloud

Most of the time, employees have less time to perform productive tasks due to unnecessary meetings. Most of these meetings take up a lot of their precious time, which they could otherwise use to complete essential responsibilities. So, keep meetings to a minimum, focusing only on business plans and advisories that employees should be aware of. While meetings are crucial to building teamwork and maintaining open communication lines among employees and management, it is just as necessary to increase productivity by allowing employees to get their work done.

Some companies have resorted to using the cloud to host meetings instead of using them in person. The problem is that this might make them tempted to host meetings more often that are needed, because they are easier to setup. However, time wasted hosting cloud-based meetings is still time that is wasted.

Avoid micro-managing

The cloud makes it easier to keep on top of your employees behavior. Lots of cloud-based project management tools help employers keep tabs on their team member’s work. While there are a lot of benefits of cloud tools used to monitor employee performance, there is also a risk that you will pay too much attention to irrelevant details.

It is understandable to want to ensure that your employees perform their best and accomplish their specific tasks. It is your business, and you want to be on top of everything in the workplace. However, micro-managing can impact employee productivity, making them feel that they aren’t competent enough to get the job done. When you hire employees, you know they are capable of the work you hired them for. There is no reason why you should not offer your assistance should they come to you with questions about their assigned tasks. However, it can be stressful for employees to work when you are constantly behind them and checking if they are getting things right.

Use Cloud Technology to Enhance Productivity

Keeping your workplace productive is a sure way to keep your business flourishing. Cloud and AI technology can help boost productivity considerably. However, it is important to utilize it effectively.

The post Essential Productivity Hacks in Cloud-Centric Workplaces appeared first on SmartData Collective.

Source : SmartData Collective Read More

How to simplify and fast-track your data warehouse migrations using BigQuery Migration Service

How to simplify and fast-track your data warehouse migrations using BigQuery Migration Service

Migrating data to the cloud can be a daunting task. Especially moving data from warehouses and legacy environments requires a systematic approach. These migrations usually need manual effort and can be error-prone. They are complex and involve several steps such as planning, system setup, query translation, schema analysis, data movement, validation, and performance optimization. To mitigate the risks, migrations necessitate  a structured approach with a set of consistent tools to help make the outcomes more predictable.

Typical data warehouse migrations: Error prone, labor intensive, trial and error based

Google Cloud simplifies this with the BigQuery Migration Service – a suite of managed tools that allow users to reliably plan and execute migrations, making outcomes more predictable. It is free to use and generates consistent results with a high degree of accuracy.

Major brands like PayPal, HSBC, Vodafone and Major League Baseball use BigQuery Migration Service to accelerate time to unlock the power of BigQuery, deploy new use cases, break down data silos, and harness the full potential of their data. It’s incredibly easy to use, open and customizable. So, customers can migrate on their own or choose from our wide range of specialized migration partners.

BigQuery Migration Service: Automatically assess, translate SQL, transfer data, and validate

BigQuery Migration Service automates most of the migration journey for you. It divides the end-to-end migration journey into four components: assessment, SQL translation, data transfer, and validation. Users can accelerate migrations through each of these phases often just with the push of a few buttons. In this blog, we’ll dive deeper into each of these phases and learn how to reduce the risk and costs of your data warehouse migrations.

Step 1: Assessment
BigQuery Migration Service generates a detailed plan with a view of dependencies, risks, and the optimized migrated state on BigQuery by profiling the source workload logs and metadata.

During the assessment phase, BigQuery Migration Service guides you through a set of steps using an intuitive interface and automatically generates a Google Data Studio report with rich insights and actionable steps. Assessment capabilities are currently available for Teradata and Redshift, and will soon be expanded for additional sources.

Assessment Report: Know before you start and eliminate surprises. See your data objects and query characteristics before you start the data transfer.

Step 2: SQL Translation 
This phase is often the most difficult part of any migration. BigQuery Migration Service provides fast, semantically correct, human readable translations from most SQL flavors to BigQuery. It can intelligently translate SQL statements  in high-throughput batch and Google-translate-like interactive modes from Amazon Redshift SQL, Apache HiveQL, Apache Spark SQL, Azure Synapse T-SQL, IBM Netezza SQL/NZPLSQL, MySQL, Oracle SQL/PL/SQL/Exadata, Presto SQL, PostgreSQL, Snowflake SQL, SQL Server T-SQL, Teradata SQL/SPL/BTEQ and Vertica SQL.

Unlike most existing offerings which parse Regular Expressions, BigQuery’s SQL translation is true compiler based, with advanced customizable capabilities to handle macro substitutions, user defined functions, output name mapping and other source-context-aware nuances. The output is  detailed and prescriptive with clear “next-actions”. Data engineers and data analysts save countless hours leveraging our industry leading automated SQL translation service.

Batch Translations: Automatic translations from a comprehensive list of SQL dialects accelerate large migrations
Interactive Translations: A favorite feature for data engineers, interactive translations simplify the refactoring efforts and reduce errors dramatically and serve as a great learning aid

Step 3: Data Transfer
BigQuery offers data transfer service from source systems into BigQuery using a simple guided wizard. Users create a transfer configuration and choose a data source from the drop down list.

Destination settings walk the user through connection options to the data sources and securely connect to the source and target systems. 

A critical feature of BigQuery’s data transfer is the ability to schedule jobs. Large data transfers can impose additional burdens on operational systems and impact the data sources. BigQuery Migration Service provides the flexibility to schedule transfer jobs to execute at user-specified times to avoid any adverse impact on production environments

Data Transfer Wizard: A step-by-step wizard guides the user to move data from source systems to BigQuery

Step 4: Validation
This phase ensures that data at the legacy source and BigQuery are consistent after the migration is completed. Validation allows highly configurable, and orchestrate-able rules to perform a granular per-row, per-column, or per-table left-to-right comparison between the source system and BigQuery. Labeling, aggregating, group-by, and filtering enable deep validations.

Validation: The peace-of-mind module for BigQuery Migration Service

If you would like to leverage BigQuery Migration Service for an upcoming proof-of-concept or migration, reach out to your GCP partner, your GCP sales rep or check out our documentation to try it out yourself.

Related Article

MLB’s fan data team hits it out of the park with data warehouse modernization

See how the fan data team at Major League Baseball (MLB) migrated its enterprise data warehouse (EDW) from Teradata to BigQuery.

Read Article

Source : Data Analytics Read More

Analyzing satellite images in Google Earth Engine with BigQuery SQL

Analyzing satellite images in Google Earth Engine with BigQuery SQL

Google Earth Engine (GEE)  is a groundbreaking product that has been available for research and government use for more than a decade. Google Cloud recently launched GEE to General Availability for commercial use. This blog post describes a method to utilize GEE from within BigQuery’s SQL allowing SQL speakers to get access to and value from the vast troves of data available within Earth Engine.

We will use Cloud Functions to allow SQL users at your organization to make use of the computation and data catalog superpowers of Google Earth Engine.  So, if you are a SQL speaker and you want to understand how to leverage a massive library of earth observation data in your analysis then buckle up and read on.

Before we get started let’s spend thirty seconds on setting geospatial context for our use-case.  BigQuery excels at doing operations on vector data.  Vector data are things like points, polygons, things that you can fit into a table.  We use the PostGIS syntax so users that have used spatial SQL before will feel right at home in BigQuery.  

BigQuery has more than 175+ public datasets available within Analytics Hub.  After doing analysis in BigQuery users can use tools like GeoViz,  Data Studio, Carto and Looker to visualize those insights. 

Earth Engine is designed for raster or imagery analysis, particularly satellite imagery. GEE, which holds more than 70PB of satellite imagery, is used to detect changes, map trends, and quantify differences on the Earth’s surface. GEE is widely used to extract insights from satellite images to make better use of  land, based on its diverse geospatial datasets and easy-to-use application programming interface (API).

By using these two products in conjunction with each other you can expand your analysis to incorporate both vector and raster datasets to combine insights from 70PB of GEE and 175+ datasets from BigQuery.  For example, in this blog we’ll create a Cloud Function that pulls temperature and vegetation data from the Landsat satellite imagery within the GEE Catalog and we’ll do it all from SQL in BigQuery. If you are curious about how to move data from BigQuery into Earth Engine you can read about it in this post.

While our example is focused on agriculture this method can apply to any industry that matters to you.

Let’s get started 

Agriculture is transforming with the implementation of modern technologies. Technologies such as GPS and satellite image dissemination allow researchers and farmers to gain more information, monitor and manage agricultural resources. Satellite imagery can be a reliable source to track images of how a field is developing. 

A common analysis of imagery used in agricultural tools today is Normalized Difference Vegetation Index (NDVI). NDVI is a measurement of plant health that is visually displayed with a legend from -1 to +1. Negative values are indicative of water and moisture. But high NDVI values suggest a dense vegetation canopy. Imagery and yield tend to have a high correlation; thus, it can be used with other data like weather to drive seeding prescriptions.

As an agricultural engineer you are keenly interested in crop health for all the farms and fields that you manage.  The healthier the crop the better the yield and the more profit the farm will produce.  Let’s assume you have mapped all your fields and the coordinates are available in BQ. You now want to calculate the NDVI of every field, along with the average temperature for different months, to ensure the crop is healthy and take necessary action if there is an unexpected fall in NDVI. So the question is  how do we pull NDVI and temperature information into BigQuery for the fields by only using SQL?

Using GEE’s ready-to-go Landsat 8 imagerywe can calculate NDVI for any given point on the planet. Similarly, we can use the publicly available ERA5 dataset of monthly climate for global terrestrial surfaces to calculate the average temperature for any given point.

Architecture

Cloud Functions are a powerful tool to augment the SQL commands in BigQuery.  In this case we are going to wrap a GEE script within a Cloud Function and call that function directly from BigQuery’s SQL. Before we start, let’s get the environment set up.

Environment setup

Before you proceed we need to get the environment setup:

A Google Cloud project with billing enabled.  (Note:  this example cannot run within the BigQuery Sandbox as a billing account is required to run Cloud Functions)

Ensure your GCP user has access to Earth Engine, can create Service accounts and assign roles. You can sign up for Earth Engine at Earth Engine Sign Up. Verify if you have access, check if you can view the Earth Engine Code Editor with your GCP user.

At this point Earth Engine and BigQuery are enabled and ready to work for you. Now let’s set up the environment and define the cloud functions.

1. Once you have created your project in GCP, select it on the console and click on cloud-shell.

2. On cloud-shell, you will need to clone a git repository which contains the shell script and assets required for this demo. Run the following command on cloud shell,

code_block[StructValue([(u’code’, u’git clone https://github.com/dojowahi/earth-engine-on-bigquery.gitrncd ~/earth-engine-on-bigqueryrnchmod +x *.sh’), (u’language’, u”), (u’caption’, <wagtail.wagtailcore.rich_text.RichText object at 0x3ee1d943a550>)])]

3. Edit config.sh – In your editor of choice update the variables in config.sh to reflect your GCP project.

4. Execute setup_sa.sh. You will be prompted to authenticate and you can choose “n” to use your existing auth.

code_block[StructValue([(u’code’, u’sh setup_sa.sh’), (u’language’, u”), (u’caption’, <wagtail.wagtailcore.rich_text.RichText object at 0x3ee1d943a1d0>)])]

4. If the shell script has executed successfully, you should now have a new Service Account created, as shown in the image below

5. A Service Account(SA) in format <PROJECT_NUMBER>-compute@developer.gserviceaccount.com was created in the previous step, you need to sign up this SA for Earth Engine at EE SA signup. Check out the last line of the screenshot above it will list out SA name

The screenshot below shows how the signup process looks for registering your SA.

6. Execute deploy_cf.sh, it should take around 10 minutes for the deployment to complete.

code_block[StructValue([(u’code’, u’sh deploy_cf.sh’), (u’language’, u”), (u’caption’, <wagtail.wagtailcore.rich_text.RichText object at 0x3ee1ea169ad0>)])]

You should now have a dataset named gee and table land_coords under your project in BigQuery along with the functions get_poly_ndvi_month and get_poly_temp_month.

You will also see a sample query output on the Cloud shell, as shown below

7. Now execute the command below in Cloudshell

code_block[StructValue([(u’code’, u”bq query –use_legacy_sql=false ‘SELECT name,gee.get_poly_ndvi_month(aoi,2020,7) as ndvi_jul, gee.get_poly_temp_month(aoi,2020,7) as temp_jul FROM `gee.land_coords` LIMIT 10′”), (u’language’, u”), (u’caption’, <wagtail.wagtailcore.rich_text.RichText object at 0x3ee1ea7367d0>)])]

and you should see something like this

If you are able to get a similar output to one shown above, then you have successfully executed SQL over Landsat imagery.

Now navigate to the BigQuery console and your screen should look something like this:

You should see a new external connection us.gcf-ee-conn, two external routines called get_poly_ndvi_month, get_poly_temp_month and a new table land_coords.

Next navigate to the Cloud functions console and you should see two new functions polyndvicf-gen2 and polytempcf-gen2 as shown below.

At this stage your environment is ready. Now you can go to the BQ console and execute queries. The query below calculates the NDVI and temperature for July 2020 for all the field polygons stored in the table land_coords

code_block[StructValue([(u’code’, u’select name,rnst_centroid(st_geogfromtext(aoi)) as centroid,rngee.get_poly_ndvi_month(aoi,2020,7) AS ndvi_jul,rngee.get_poly_temp_month(aoi,2020,7) AS temp_jul rnFROM `gee.land_coords`’), (u’language’, u”), (u’caption’, <wagtail.wagtailcore.rich_text.RichText object at 0x3ee1db774d90>)])]

The output should look something like this:

When the user executes the query in BQ, the function get_poly_ndvi_month and get_poly_temp_month trigger remote calls to the cloud functions polyndvicf-gen2 and polytempcf-gen2 which would initiate the script on GEE. The results from GEE are streamed back to the BQ console and shown to the user.

What’s Next?

You can now plot this data on a map in Data Studio or Geoviz and publish it to your users

Now that your data is within BigQuery, you can join this data with your private datasets or other public datasets within BigQuery and build ML models using BigQuery ML to predict crop yields, seed prescriptions.

Summary

The example above demonstrates how users can wrap GEE functionality within Cloud Functions so that GEE can be executed exclusively within SQL. The method we have described requires someone who can write GEE scripts. The advantage is that once the script is built,  all of your SQL-speaking data analysts-scientists-engineers can do calculations on vast troves of satellite imagery in GEE directly from the BigQuery UI or API.

Once the data and results are in BigQuery you can join the data with other tables in BigQuery or with the data available through Analytics Hub.  Additionally with this method, users can combine GEE data with other functionality such as geospatial functions or BQML.  In future we’ll expand our examples to include these other BigQuery capabilities.

Thanks for reading, and remember,  if you are interested in learning more about how to move data from BigQuery to Earth Engine together, check out this blog post. The post outlines a solution for a sustainable sourcing use case for a fictional consumer packaged goods company trying to understand their palm oil supply chain which is primarily located in Indonesia. 

Acknowledgements: Shout out to David Gibson and Chao Shen for valuable feedback.

Related Article

Mosquitoes get the swat with new Mosquito Forecast built by OFF! Insect Repellents and Google Cloud

By visualizing data about mosquito populations with Google Earth Engine, SC Johnson built an app that predicts mosquito outbreaks in your…

Read Article

Source : Data Analytics Read More

Building an automated data pipeline from BigQuery to EarthEngine with Cloud Functions

Building an automated data pipeline from BigQuery to EarthEngine with Cloud Functions

Over the years, vast amounts of satellite data have been collected and ever more granular data are being collected everyday. Until recently, those data have been an untapped asset in the commercial space. This is largely because the tools required for large scale analysis of this type of data were not readily available and neither was the satellite imagery itself. Thanks to Earth Engine, a planetary-scale platform for Earth science data & analysis, that is no longer the case. 

The platform, which was recently announced as a generally available Google Cloud Platform (GCP) product, now allows commercial users across industries to operationalize remotely sensed data. Some Earth Engine use cases that are already being explored include sustainable sourcing, climate risk detection, sustainable agriculture, and natural resource management. Developing spatially focused solutions for these use cases with Earth Engine unlocks distinct insights for improving business operations. Automating those solutions produces insights faster, removes toil and limits the introduction of error. 

The automated data pipeline discussed in this post brings data from BigQuery into Earth Engine and is in the context of a sustainable sourcing use case for a fictional consumer packaged goods company, Cymbal. This use case requires two types of data. The first is data that Cymbal already has and the second is data that is provided by Earth Engine and the Earth Engine Data Catalog. In this example, the data owned by Cymbal is starting in BigQuery and flowing through the data pipeline into Earth Engine through an automated process.

A helpful way to think about combining these data is as a layering process, similar to assembling a cake. Let’s talk through the layers for this use case. The base layer is satellite imagery, or raster data, provided by Earth Engine. The second layer is the locations of palm plantations provided by Cymbal, outlined in black in the image below. The third and final layer is tree cover data from the data catalog, the pink areas below. Just like the layers of a cake, these data layers come together to produce the final product. The goal of this architecture is to automate the aggregation of the data layers.

Another example of a use case where this architecture could be applied is in a methane emission detection use case. In that case, the first layer would remain the same. The second layer would be facility location details (i.e. name and facility type) provided by the company or organization. Methane emission data from the data catalog would be the third layer. As with methane detection and sustainable supply chain, most use cases will involve some tabular data collected by companies or organizations. Because the data are tabular, BigQuery is a natural starting point. To learn more about tabular versus raster data and when to use BigQuery versus Earth Engine, check out this post.

Now that you understand the potential value of using Earth Engine and BigQuery together in an automated pipeline, we will go through the architecture itself. In the next section, you will see how to automate the flow of data from GCP products, like BigQuery, into Earth Engine for analysis using Cloud Functions. If you are curious about how to move data from Earth Engine into BigQuery you can read about it in this post.

Architecture Walkthrough

Cymbal has the goal of gaining more clarity in their palm oil supply chain which is primarily located in Indonesia. Their specific goal is to identify areas of potential deforestation. In this section, you will see how we can move the data Cymbal already has about the locations of palm plantations into Earth Engine in order to map those territories over satellite images to equip Cymbal with information about what is happening on the ground. Let’s walk through the architecture step by step to better understand how all of the pieces fit together. If you’d like to follow along with the code for this architecture, you can find it here.

Architecture

Step by Step Walkthrough

1. Import Geospatial data into BigQuery
Cymbal’s Geospatial Data Scientist is responsible for the management of the data they have about the locations of palm plantations and how it arrives in BigQuery.

2. A Cloud Scheduler task sends a message to a Pub/Sub topic
A Cloud Scheduler task is responsible for starting the pipeline in motion. Cloud Scheduler tasks are cron tasks and can be scheduled at any frequency that fits your workflow. When the task runs it sends a message to a Pub/Sub topic.

3. The Pub/Sub topic receives a message and triggers a Cloud Function

4. The first Cloud Function transfers the data from BigQuery to Cloud Storage
The data must be moved into Cloud Storage so that it can be used to create an Earth Engine asset

5. The data arrives in the Cloud Storage bucket and triggers a second Cloud Function

6. The second Cloud Function makes a call to the Earth Engine API and creates an asset in Earth Engine
The Cloud Function starts by authenticating with Earth Engine. It then makes an APIcall creating an Earth Engine asset from the Geospatial data that is in Cloud Storage.

7. AnEarth Engine App (EE App) is updated when the asset gets created in Earth Engine
This EE App is primarily for the decision makers at Cymbal who are primarily interested in high impact metrics. The application is a dashboard giving the user visibility into metrics and visualizations without having to get bogged down in code.

8. A script for advanced analytics is made accessible from the EE App
An environment for advanced analytics in the Earth Engine code editor is created and made available through the EE App for Cymbal’s technical users. The environment gives the technical users a place to dig deeper into any questions that arise from decision makers about areas of potential deforestation.

9. Results from analysis in Earth Engine can be exported back to Cloud Storage
When a technical user is finished with their further analysis in the advanced analytics environment they have the option to run a task and export their findings to Cloud Storage. From there, they can continue their workflow however they see fit.

With these nine high-level steps, an automated workflow is achieved that provides a solution for Cymbal, giving them visibility into their palm oil supply chain. Not only does the solution address the company wide goal, it also keeps in mind the needs of various types of users at Cymbal. 

Summary

We’ve just walked through the architecture for an automated data pipeline from BigQuery to Earth Engine using Cloud Functions. The best way to deepen your understanding of this architecture and how all of the pieces fit together is to walk through building the architecture in your own environment. We’ve made building out the architecture easy by providing a Terraform Script available on GitHub. Once you have the architecture built out, try swapping out different elements of the pipeline to make it more applicable to your own operations. If you are looking for some inspiration or are curious to see another example, be sure to take a look at this post which brings data from Earth Engine into BigQuery. The post walks through creating a Cloud Function that pulls temperature and vegetation data from the Landsat satellite imagery within the GEE Catalog from SQL in BigQuery. Thanks for reading.

Related Article

Analyzing satellite images in Google Earth Engine with BigQuery SQL

Learn how to use BigQuery SQL inside Google Earth Engine to analyze satellite imagery to track farm health.

Read Article

Source : Data Analytics Read More

CCAI Platform goes GA: Faster time to value with AI for your Contact Center

CCAI Platform goes GA: Faster time to value with AI for your Contact Center

Customers reach out to contact centers for help in moments of urgent need, but due to increasing demands, new channels, peak times, and operational pressures, contact centers often struggle to provide timely help. To bridge this gap, enterprises are increasingly investing in AI-driven solutions that balance addressing customer expectations with operational efficiency. 

But building and generating value from such solutions can be complicated and challenging. Google Cloud built Contact Center AI (CCAI) to streamline and shorten this time to value, and CCAI Platform, our newest addition, takes a crucial step in this effort by introducing end-to-end call center capabilities. After debuting these new capabilities in March, we are excited to announce that CCAI Platform is now generally available across the US, Canada, UK, Germany, France, and Italy—with more markets soon to come! 

Delivering world-class customer experiences and accelerating time-to-value with CCAI

CCAI encompasses a comprehensive set of offerings to address the top pain points of the three main user groups in the contact center: contact center owners, their agents, and the customers they serve. 

Dialogflow lets the contact center manager scale their operations while balancing cost and customer satisfaction, including reducing painful, long waiting times endured by end users. Using Dialogflow, contact center managers can build complex chat and voice virtual agents—a proven, cost-effective way to scale contact centers while continuing to provide great customer experiences. Available 24/7, without any waiting queue, these virtual agents can converse naturally with customers, identify their issues, and address them effectively.  

Agent Assist reduces overall handling time and coaches human agents to become more effective and helpful. The service uses AI to “listen” to the voice and chat conversations between the human representative and the customer, then provides real-time guidance and recommendations to the agent, based on historical conversations, knowledge bases, and best practices of experienced agents. It also automates post-call actions such as transcription and call summarization, saving significant time and overhead at the end of every call.

CCAI Insights stores and analyzes all the customer conversations in the contact center, whether with human or virtual agents, to provide leaders with real-time, actionable data points on customer queries, agent performance, sentiment trends, and opportunities for automation.

At the heart of these technologies is our conversational AI brain. It uses Google Research’s technology to talk, understand, and interact, enabling and orchestrating high-quality conversational experiences at scale.

CCAI Platform: a modern CCaaS and the shortest path to CCAI value

While the value of the CCAI offerings is clear to our customers, we also hear from them that integrating these solutions with legacy infrastructure takes too long. 

To minimize these integration difficulties, accelerate time-to-value using the CCAI offerings, and help businesses provide outstanding customer experiences, we’re pleased to announce the general availability of CCAI Platform, the Contact Center as a Service (CCaaS) solution from Google Cloud built in partnership with UJET. 

CCAI Platform is a modern, turnkey Contact Center as a service solution, designed with user-first, AI-first, and mobile-first principles. It offers:

Turnkey core Contact Center capabilities out-of-the-box, for faster time to production, lower implementation overhead, and custom development needed

AI-powered experiences, from routing to better handling customer interactions

Deep integration with CCAI’s offerings, to provide a unified end-to-end experience for contact center transformation

Mobile-first design that enables interactions in line with the way people expect to communicate across channels

CRM-centered design with automated updates, so agents can focus on the customer

Deployment flexibility, with customer data residing in their CRM and the flexibility to bring their own telephony carrier to minimize cost

All of this is available without the typical need to integrate complex technologies from multiple providers. 

“With Google Cloud and CCAI Platform, we will quickly move our contact center to the cloud, supporting both our customers and agents with industry-leading CX innovations, all while streamlining operations through more efficient customer care operations,” said Dean Kontil, Division CIO of KeyBank. 

For customers looking to change platforms for a cloud-native CCaaS with deep Google AI integrations, CCAI Platform offers end-to-end capabilities that accelerate call center transformations. We also remain strongly committed to customer choice, and customers will continue to have the option to integrate our latest and greatest CCAI offerings through our existing OEM partners.

The Contact Center conversation is just beginning

This launch is part of a broader effort to deliver more value, faster, to more CCAI customers. As companies replace interactive voice response (IVR) with intelligent virtual agents (IVA) and begin to collect and analyze data, use cases are likely to grow more sophisticated—which is one reason Google Cloud is continuing to invest in technologies to make our CCAI offerings even more useful, as well as best practices like the following: 

CCAI Agent Assist and Insights are a great first step in AI transformation. They let contact center owners enable call transcription and use Topic Modeling to identify conversation themes that demand attention. Human agents can automatically generate high-quality conversation summaries to reduce call wrap-up time, and the associated costs, while improving business insights. We are working to make these features available both in CCAI Platform and with our partner ISVs.

Chat and call steering are the first step for IVA automation. Another area of broad impact is conversational chat or call steering, in which friction is reduced by routing customers to the correct virtual or live agent experience. Many call centers rely on IVR systems in which customers have to use a keypad to select an option. Enterprise leaders tell us that attrition is very high throughout this process: some customers angrily hang up without resolution and, just as bad, many simply pound a single key in hopes of reaching a human agent, leading to the customer reaching the wrong person because their issue was never correctly identified or routed. Using Dialogflow’s natural language understanding (NLU) capabilities can sweep away such problems, with the customer more likely to not only reach the appropriate resources, but also share conversational data from which insights can be gleaned. It’s an approach that can pay dividends right away, and a quick first step to IVA automation. 

In coming months, we will continue to work on these and other capabilities that are targeted to deliver higher and quicker value to our customers. We plan to release pre-built components to help companies tackle call center use cases in specific industries, for example. We’ll also continue to partner with companies that share our vision of transforming customer experiences with AI, such as TTEC, a provider of customer experience technology and software. 

“TTEC Digital and Google Cloud have a shared vision for transforming global CX delivery through artificial intelligence, digital innovation, and operational excellence,” said Sam Thepvongs, VP of TTEC Digital. “With CCAI Platform, we can offer our largest enterprise customers a strategic blueprint for moving to the cloud while adopting a leading, AI-powered contact center platform. We couldn’t be more excited about this evolution of Google Cloud’s groundbreaking CCAI portfolio, and the opportunity to help our customers digitally transform their CX through this partnership.”

To get started with CCAI Platform, visit our solutions page or checkout our new omni channel demo video—and don’t forget to join us at Google Cloud Next ’22, where I’ll be sharing exciting new updates for CCAI in my session, “Delight customers in every interaction with Contact Center AI.”

Related Article

Making AI more accessible for every business

How Google Cloud creates artificial intelligence and machine learning services for all kinds of businesses and levels of technical expert…

Read Article

Source : Data Analytics Read More

How Formula 1 Teams Leverage Big Data for Success

How Formula 1 Teams Leverage Big Data for Success

We have previously talked about ways that big data is changing the world of sports. Formula 1 teams are among those most affected.

Ever since the Oakland A’s switched their recruitment policy from a players’ running speed and strength to a more sophisticated and nuanced look at the on-base slugging percentage, the world of sports has become more and more accustomed to utilizing sports analytics in their team-building.

Such was Billy Beane’s and his team’s success that a book, Moneyball, and a film followed as sports teams switched their focus to analyzing how a player performed metrics vital to their role in the team and, based on their findings, signing the players which best fit these parameters rather than going for the more highly fancied, and often more expensive, names. It worked. With a budget one-third of their more glamorous rivals, the A’s reached the playoffs in back-to-back seasons, and everyone sat up and took note. Even tennis has gotten involved with The Guardian announcing Wimbledon would be using big data to enrich spectator’s experience this year.

Formula 1 has also embraced analytics. After all, at its heart, it is a sport all about stats – the fastest car wins! But they have been doing so a lot longer than most other sports. Back in the 1980s, teams were using telemetry to stream information from the car to the pit team. But any one car can be transmitting millions of points of data from dozens of sensors over a race weekend, all being checked and analyzed by the pit team in real-time, who can react accordingly to this constant flow of information. For example, the Mercedes AMG F1 W08 EQ Power + is rammed with 200 sensors, while Red Bull’s RB12 tech team are analyzing data from some 10,000 different parts. At one US Formula 1 Grand Prix, it was estimated nearly as much data was transmitted by the competing teams as is stored in the US Library of Congress! ‘It’s not about big data,’ said Christian Dixon at Mercedes back in 2017, ‘it’s about the right data.’

While most race fans will only be interested in mph and pit stop times, the cars team, both trackside and at HQ, will be minutely examining the temperature of the brakes and tires, pressures, air flow, cornering speed, biometric data of the driver and looking for ways to eke out another 0.1% of performance improvement. Even having advance warning of damp conditions midway through the race could enable the team to factor in an earlier wheel change than they would have liked to anticipate the wetter track, perhaps knocking a second or two off the driver’s time and all those saved seconds do mount up and do make a difference.

Lewis Hamilton is very keen on data and would often talk with the technical team about weather conditions, track conditions and recent performances as part of the preparation for the next race. Hamilton, of course, is still a top driver, although he is unlikely to get that record-breaking eighth world title, as he currently trails Max Verstappen in the current Ladbrokes Formula 1 odds. Much like Wimbledon, Verstappen’s Red Bull team look to involve their fans more by providing them with the latest statistics and behind-the-scenes access across its website and social media channels.

Beane’s data revolution has spread across all sports in the last 20 years and, as we have seen now, reaches out to improve fans’ experience of their favorite sport. Who knows how it will change sports over the next 20 years?

The post How Formula 1 Teams Leverage Big Data for Success appeared first on SmartData Collective.

Source : SmartData Collective Read More