While there has been a lot of attention given to wildfires, floods, and hurricanes, heat-related weather events are still understudied and underreported. Every summer, heat waves pose a major threat to the health of people and ecosystems. 83% of the North American population lives in cities, where the urban heat island (UHI) effect leads to higher local temperatures compared to surrounding rural areas.
But not everyone living in US cities experiences summer heat waves and urban heat islands equally. Communities with lower incomes or people of color are more likely to be impacted by extreme heat events, both due to fewer green spaces in urban areas and not having access to air conditioning. While there have been many studies that have shed light on environmental inequities between neighborhoods of varying income levels, there has been little analysis of what it will take to provide all people with protection from severe heat.
In the summer of 2019, TC Chakraborty, then a PhD candidate at the Yale School of the Environment, and Tanushree Biswas, then Spatial Data Scientist at The Nature Conservancy, California, met at one of our Geo for Good Summits. The summits bring together policymakers, scientists, and other change-makers who use Google’s mapping tools. They wanted to share ideas in their areas of expertise (urban heat and tree cover, respectively) and explore a potential path to address urban climate change inequities using open tools and a suite of datasets. Given the ability of tree cover to help mitigate local heat in cities, they wondered how much space is actually available for trees in lower income urban neighborhoods.
If this available space were to be quantified, it would provide estimates of severalco-benefits of tree cover beyond heat mitigation, from carbon sequestration to air pollution reduction, to decreased energy demand for cooling, to possible health benefits. Chakraborty and Biswas believed that increasing the tree canopy in this available space could provide economic opportunities for green jobs as well as more equitable climate solutions. Inspired by this shared vision, they joined forces to explore the feasibility of adding trees to California’s cities.
Three years later, in June 2022, Chakraborty, Biswas, and co-authors L.S. Campbell, B. Franklin, S.S. Parker, and M. Tukman published a paper to address this challenge. The study combines medium-to-high-resolution satellite observations with census data to calculate the feasible area available for urban afforestation — planting new trees — for over 200 urban clusters in California. The paper demonstrates a systematic approach that leverages publicly available data on Google Earth Engine, Google’s planetary-scale platform for Earth science data & analysis, which is free of charge for nonprofits, academics, and research use cases. Results from the study can be explored through a Earth Engine web application: Closing Urban Tree Cover Inequity (CUTI).
California is the most populated state in the United States, the fifth largest economy in the world and frequently impacted by heat waves. This makes California a prime location to demonstrate approaches to strategically reducing surface UHI (SUHI), which has the potential to positively impact millions, especially those vulnerable to heat risk. Chakraborty et al. (2022) found that underprivileged neighborhoods in California have 5.9% less tree cover (see Fig. 1 for an illustrative example for Sacramento) and 1.7 °C higher summer SUHI intensity than more affluent neighborhoods. This disparity in tree cover can be partially closed through targeted urban afforestation.
Fig 1. Street and satellite views of an underprivileged and a more affluent neighborhood in Sacramento.
Leveraging the wealth of data for cities in California, including heat-related mortality and morbidity data, sensitivity of residential energy demand to temperature, and carbon sequestration rates of California’s forests, the researchers calculated co-benefits of several urban afforestation scenarios. For their maximum possible afforestation scenario, they found potential for an additional 36 million (1.28 million acres of) trees, which can provide economic co-benefits, estimated to be worth as much as $1.1 billion annually:
4.5 million metric tons of annual CO2 sequestration
Reduction in heat-related medical visits (~4000 over 10 years)
Energy usage and cost reductions
Stormwater runoff reduction
Property value increase
With a focus on reducing disparities in SUHI and tree cover within these cities, the study provides suitability scores for scaling urban afforestation at the census-block group level across California. By focusing on California neighborhoods with high suitability scores, the authors estimate that an annual investment of $467 million in urban afforestation would both reduce heat disparities and generate $712 million of net annual benefits. Specifically, these benefits would go to 89% of the approximately 9 million residents in the lowest income quartiles of California cities. This annual investment equates to a 20-year commitment of $9.34 billion or 10,000 Electric Vehicles annually.
Fig. 2 Maps showing a median income, b current canopy cover percentage, c summer daytime surface urban heat island (SUHI) intensity, and d available area for planting trees as percentage of total area for census block groups in the Los Angeles urban cluster (Image source: TC Chakraborty and Tanushree Biswas).
The adverse effects of climate change disproportionately impact cities, so it’s critical to start thinking about viable solutions to address environmental disparities within urban communities. Providing urban planners with data-driven tools to design climate-resilient cities is a key first step. The Chakraborty et al. study leverages Earth Engine data, tech, and cloud compute resources to provide actionable insights to address environmental disparities in cities. It’s a great example of how Earth Engine can help inform urban policy and provide a bird’s-eye view of logistical support for scalable climate solutions that enable innovation and investment opportunities. In the future, Chakraborty and Biswas hope to further scale this analysis across U.S. cities to provide baseline data that can help move us towards equitable climate adaptation for everyone.
Google wants to support this kind of research! If you are a researcher working on climate impact, apply to the Google Cloud Climate Innovation Challenge in partnership with The National Science Foundation (NSF) and AI Institute for Research on Trustworthy AI in Weather, Climate, and Coastal Oceanography (AI2ES) for free credits to fuel your research.
Thanks to TC Chakraborty and Tanushree Biswas for their help in preparing this blog post.
The Oden Technologies solution is an analytics layer for manufacturers that combines and analyzes all process information from machines and production systems to give real-time visibility to the biggest causes of inefficiency and recommendations to address them. Oden empowers front-line plant teams to make effective decisions, such as prioritizing resources more effectively, solving issues faster, and realizing optimal behavior.
Use cases: Challenges and problems solved
Manufacturing plants have limited resources and would like to use them optimally by eliminating any inefficiencies and making recommendations and providing data points as a key input for decision making. These data points are based on a torrent of data coming from multiple devices.
Oden’s customers are manufacturers with continuous and batch processes, such as in plastics extrusion, paper and pulp, and chemicals. Oden powers real-time and historical dashboards and reports necessary for this decision-making through leveraging the underlying Google Cloud Platform.
Oden’s platform aggregates streaming, time-series data from multiple devices and instruments and processes them in real-time. This data is in the form of continuously sampled real-world sensor readings (metrics) that are ingested into CloudIoT and transformed in real-time using Dataflow before being written to Oden’s time series database. Transformations include data cleaning, normalization, synchronization, smoothing, outlier removal, and multi-metric calculations that are built in collaboration with manufacturing customers. The time-series database then powers real-time and historical dashboards and reports.
One of the major challenges of working with real-time manufacturing data is handling network disruptions. Manufacturing environments are often not well served by ISPs and can experience network issues due to environmental and process conditions or other factors. When this happens, data can be backed up locally and arrive late after the connection recovers. To avoid overloading real-time dataflow jobs with this late data, BigQuery supports late data handling and recoveries.
In addition to the sensor data, Oden collects metadata about the production process and factory operation such as products manufactured on each line, their specifications and quality. Integrations provide the metadata via Oden’s Integration APIs running on Google Kubernetes Engine (GKE), which then writes it to a PostgreSQL database hosted in CloudSQL. The solution then uses this metadata to contextualize the time-series data in manufacturing applications.
Oden uses this data in several ways, including real-time monitoring and alerting, dashboards for line operators and production managers, historical query tools for quality engineers, and machine learning models trained on historical data and scored in real-time to provide live predictions, recommendations, and insights. This is all served in an easy to access and understand UI, greatly empowering employees across the factory to use data to improve their lines of business.
The second major challenge in manufacturing systems, is achieving quality specifications on the final product for it to be sold. Typically, Quality Assurance is conducted offline: after production has completed, a sample is taken from the final product, and a test is performed to determine physical properties of the product. However, this introduces a lag between the actual time period of production, and information about the effectiveness of that production—sometimes hours (or even days) after the fact. This prevents proactive adjustments that could correct for quality failures, and results in considerable waste.
Solution architecture
At the heart of the Oden platform is Google BigQuery, which plays an important backstage role in Oden’s data-driven software. Metric data is written simultaneously to BigQuery via a BigQuery Subscription through Cloud PubSub and metadata from CloudSQL is accessible via BigQuery’s Federated Queries. This makes BigQuery an exploratory engine for all customer data allowing Oden’s data scientists and engineers to support the data pipelines and build Oden’s machine learning models.
Sometimes these queries are ad-hoc analysis that helps understand data better. For example, here’s a BigQuery query joining both the native BigQuery metrics table and a Federated Query to the metadata in PostgreSQL This query helps determine the average lag between the event time and ingest time of customer metrics by day for November:
code_block[StructValue([(u’code’, u’SELECTrn customer_id,rn metric_id,rn TIMESTAMP_TRUNC(ingest_time, DAY) AS ingest_day,rn AVG(TIMESTAMP_DIFF(ingest_time, ingest_time, MILLISECOND)) AS diff_msrnFROMrn `oden-production.metrics.metrics`rnJOINrn EXTERNAL_QUERY(“oden-production.us.metadatadb”,rn “SELECT customer_id::text, metric_id::text FROM customer_metrics”)rnWHERErn ingest_time >= ‘2022-11-01’rn AND ingest_time < ‘2022-12-01’rnGROUP BYrn customer_id,rn metric_id,rn ingest_day’), (u’language’, u”), (u’caption’, <wagtail.wagtailcore.rich_text.RichText object at 0x3e2c879c2c90>)])]
In addition to ad-hoc queries, there are also several key features of Oden that use BigQuery as their foundation. Below, two major features that leverage BigQuery as the highly scalable source of truth for data are covered.
Use case 1: The data reliability challenge of manufacturing and the cloud
As mentioned earlier, one of the major challenges of working with real-time manufacturing data is handling network disruptions. After the connection recovers, you encounter data that has been backed up and is out of temporal sequence. To avoid overloading real-time dataflow jobs with this late data, BigQuery is used to support late data handling and recoveries.
The data transformation jobs that run on Dataflow are written in the Apache Beam framework and usually perform their transformations by reading metrics from an input Pubsub topic and writing back to an output topic. This forms a directed acyclic graph (DAG) of transformation stages before the final metrics are written to the time-series database. But the streaming jobs degrade in performance when handling large bursts of late data putting the ability at risk to meet Service Level Agreements (SLAs), which guarantee customers high availability and fast end-to-end delivery of real-time features.
A key tenet of the Apache Beam model is that transformations can be applied to both bounded and unbounded collections of data. With this in mind, Apache Beam can be used for both streaming and batch processing. Oden takes this a step further with a universal shared connector for every one of the transformation jobs which allows the entire job to switch between a regular “streaming mode” and an alternative “Batch Mode.” In “Batch Mode,” the streaming jobs can do the same transformation but use Avro files or BigQuery as their data source.
This “Batch Mode” feature started as a method of testing and running large batch recoveries after outages. But it has since evolved into a solution to late data handling problems. All data that comes in “late” to Oden bypasses the real-time Dataflow streaming jobs and is written to a special “Late Metrics” PubSub topic and then to BigQuery. Nightly, these “Batch Mode” jobs are deployed and data is queried that wasn’t processed that day out of BigQuery and results written back to the time-series database. This creates two SLAs for customers; a real-time one of seconds for “on-time” data and a batch one of 24 hours for any data that arrives late.
Occasionally, there is a need to backfill transformations of these streaming jobs due to regressions or new features to backport over old data. In these cases, batch jobs are leveraged again. Additionally, jobs specific to customer data are joined with metrics and customer configuration data hosted in CloudSQL via BigQuery’s Federated queries to CloudSQL.
By using BigQuery for recoveries, dataflow jobs continue to run smoothly, even in the face of network disruptions. This allows maintaining high accuracy and reliability in real-time data analysis and reporting. Since moving to separate BigQuery-powered late-data handling, the median system latency of calculated metrics feature for real-time metrics is under 2s which allows customers to observe and respond to their custom multi-sensor calculated metrics instantly.
Use case 2: Building and delivering predictive quality models
The next use case deals with applying machine learning to manufacturing: predicting offline quality test results using real-time process metrics. This is a challenging problem in manufacturing environments, where not only is high accuracy and reliability necessary, but the data is also collected at different sampling rates (seconds, minutes, and hours) and stored in several different systems. The merged datasets represent the comprehensive view of data to factory personnel, who use the entire set of context information to make operational decisions. This ensures Predictive Quality models access this same full picture of the manufacturing process as it provides predictions.
At Oden, BigQuery addresses the two key challenges of machine learning in the manufacturing environment:
Using time series data stored in time series database, summary aggregates are performed to construct features as input for model training and scoring.
Using federated queries to access context metadata, data is merged with the aggregates to fully characterize the production period. This allows easily combining the data from both sources and using it to train machine learning models.
Oden uses a variety of models and embeddings — ranging from linear models (Elastic Nets, Lasso), ensemble models (boosted trees, random forests) to DNNs that allow addressing the different complexity-accuracy-interpretability requirements of customers.
The chart shows out-of-sample predictions of offline quality test values, compared with the actual values that were observed after the end of production. The predicted values provide lead time of quality problems of up to one hour.
Models are trained using an automated pipeline based on Apache Airflow and scikit learn, and models are stored in Google Cloud Storage for versioning and retrieval. Once the models are trained, they can be used to predict the outcomes of quality tests in real-time via a streaming Dataflow job. This allows factory floor operators to identify and address potential problems before they become more serious or have a large impact. This improves the overall efficiency of the production process, and reduces the amount of waste that a factory generates. Factory floor operators receive up-to-date information about the quality characteristics of current production conditions, up to an hour before the actual test value is available for inspection. This gives early warning to help catch quality failures. In turn, this reduces material waste and machine downtime, metrics that are central to many manufacturers’ continuous improvement initiatives, as well as their day-to-day operations.
Operators come to rely upon predictive models to execute their roles effectively, regardless of their experience level or their familiarity with a specific type of production or machinery, and up-to-date models are critical to the success of the predictions in improving manufacturing processes. Hence, in addition to training, life-cycle management of models and ML ops are important considerations in deploying reliable models to the factory floor. Oden is focusing on leveraging Vertex AI to make the ML model lifecycle more simple and efficient.
Oden’s Predictive Quality model empowers operators to take proactive steps to optimize production on the factory floor, and allows for real-time reactions to changes in the manufacturing process. This contributes to cost reduction, energy savings, and reduced material wasted.
The future of BigQuery at Oden
Actionable data, like the processed data generated by Oden, has become such a critical part of making predictions and decisions to remain competitive in the manufacturing space. In order to use these insights to their full potential, businesses need a low barrier to access data, unify the data with other data sources, derive richer insights and make learned decisions. Oden already leads the market in having trustworthy, usable, and understandable insights from combined process, production, and machine data that is accessible from everyone within the plant to improve their line of business. There is opportunity to go beyond the Oden interface to integrate with even more business systems The data can be made available in the form of finished datasets, hosted in BigQuery. Google Cloud has launched a new service called Analytics Hub , powered by BigQuery with the intent to make data sharing easier, secure, searchable, reliable and highly scalable.
Analytics Hub is based on the Publish-Subscribe model where BigQuery datasets are enlisted into a Data exchange as a Shared dataset, which hosts hundreds of listings. It lets users share multiple BigQuery objects such as views, tables, external tables, models etc into the Data exchange. A Data exchange can be marked public or private for a dedicated sharing. On the other end, businesses can subscribe to one or more listings in their BigQuery instance, where it is consumed as a Linked dataset to run queries against. Analytics Hub sets up a real-time data pipeline with a low-code no-code approach to share data, while giving Oden complete control over what data needs to be shared for better governance.
This empowers advanced users, who have use-cases that exceed the common workflows already achievable with Oden’s configurable dashboard and query tools, to leverage the capabilities of BigQuery in their organization. This brings Oden’s internal success with BigQuery directly to advanced users. With BigQuery, they can join against datasets not in Oden, express complex BigQuery queries, load data directly with Google’s BigQuery client libraries, and integrate Oden data into third party Business Intelligence software such as Google Data Studio.
Better together
Google Cloud and Oden are forging a strong partnership in several areas, most of which are central to customers needs. Oden has developed a turnkey solution by using the best in class Google Cloud tools and technologies, delivering pre-built models to accelerate time to value and enabling manufacturers to have accessible and impactful insights without hiring a data science team. Together, Google and Oden are expanding the way manufacturers access and use data by creating a clear path to centralize production, machine, and process data into the larger enterprise data platform paving the way for energy savings, material waste reduction and cost optimization,
Click here to learn more about Oden Technologies or to request a demo.
The Built with BigQuery advantage for ISVs
Google is helping tech companies like Oden Technologies build innovative applications on Google’s data cloud with simplified access to technology, helpful and dedicated engineering support, and joint go-to-market programs through the Built with BigQuery initiative, launched in April ‘22 as part of the Google Data Cloud Summit. Participating companies can:
Get started fast with a Google-funded, pre-configured sandbox.
Accelerate product design and architecture through access to designated experts from the ISV Center of Excellence who can provide insight into key use cases, architectural patterns, and best practices.
Amplify success with joint marketing programs to drive awareness, generate demand, and increase adoption.
BigQuery gives ISVs the advantage of a powerful, highly scalable data warehouse that’s integrated with Google Cloud’s open, secure, sustainable platform. And with a huge partner ecosystem and support for multi-cloud, open source tools and APIs, Google provides technology companies the portability and extensibility they need to avoid data lock-in.
We thank the Google Cloud and Oden team members who co-authored the blog: Oden: Henry Linder, Staff Data Scientist & Deepak Turaga, SVP Data Science and Engineering. Google: Sujit Khasnis, Solutions Architect & Merlin Yammsi, Solutions Consultant
BigQuery BI Engine is a fast, in-memory analysis system for BigQuery currently processing over 2 billion queries per month and growing. BigQuery has its roots in Google’s Dremel system and is a data warehouse built with scalability as a goal. On the other hand BI Engine was envisioned with data analysts in mind and focuses on providing value on Gigabyte to sub-Terabyte datasets, with minimal tuning, for real time analytics and BI purposes.
Using BI Engine is simple – create a memory reservation on the project that runs BigQuery queries, and it will cache data and use the optimizations. This post is a deep dive into how BI Engine helps deliver blazing fast performance for your BigQuery queries and what users can do to leverage its full potential.
BI Engine optimizations
The two main pillars of BI Engine are in-memory caching of data and vectorized processing. Other optimizations include CMETA metadata pruning, single-node processing, and join optimizations for smaller tables.
Vectorized engine
BI Engine utilizes the “Superluminal” vectorized evaluation engine which is also used for YouTube’s analytic data platform query engine – Procella. In BigQuery’s row-based evaluation, the engine will process all columns within a row for every row. The engine is potentially alternating between column types and memory locations before going to the next row. In contrast, a vectorized engine like Superluminal will process a block of values of the same type from a single column for as long as possible and only switch to the next column when necessary. This way, hardware can run multiple operations at once using SIMD, reducing both latency and infrastructure costs. BI Engine dynamically chooses block size to fit into caches and available memory.
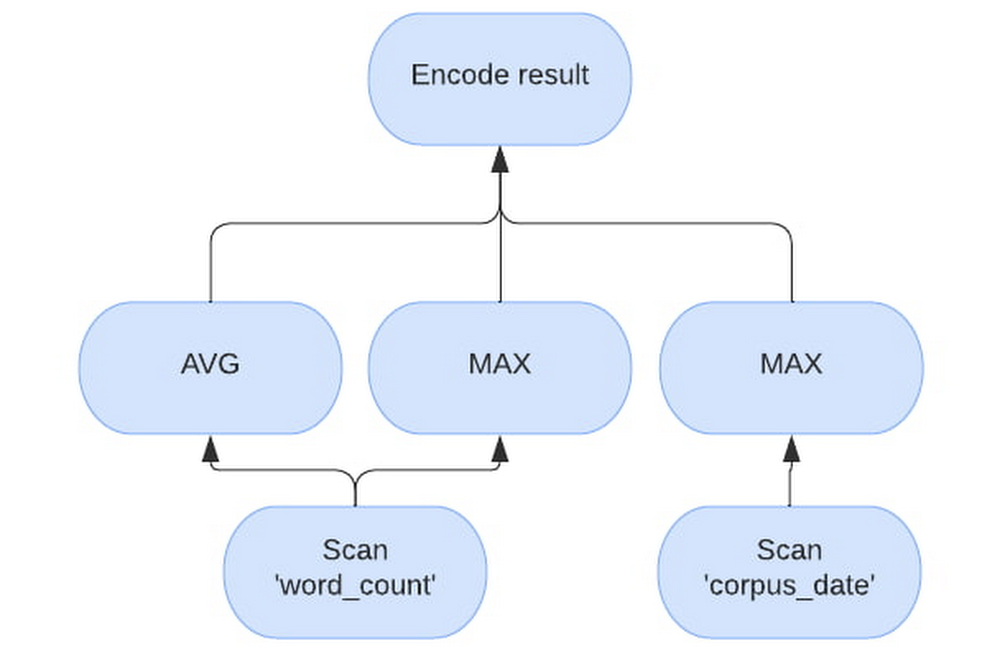
For the example query, “SELECT AVG(word_count), MAX(word_count), MAX(corpus_date) FROM samples.shakespeare”, will have the following vectorized plan. Note how the evaluation processes “word_count” separately from “corpus_date”.
In-memory cache
BigQuery is a disaggregated storage and compute engine. Usually the data in BigQuery is stored on Google’s distributed file system – Colossus, most often in blocks in Capacitor format and the compute is represented by Borg tasks. This enables BigQuery’s scaling properties. To get the most out of vectorized processing, BI Engine needs to feed the raw data at CPU speeds, which is achievable only if the data is already in memory. BI Engine runs Borg tasks as well, but workers are more memory-heavy to be able to cache the data as it is being read from Colossus.
A single BigQuery query can be either sent to a single BI Engine worker, or sharded and sent to multiple BI Engine workers. Each worker receives a piece of a query to execute with a set of columns and rows necessary to answer it. If the data is not cached in the workers memory from the previous query, the worker loads the data from Colossus into local RAM. Subsequent requests for the same or subset of columns and rows are served from memory only. Note that workers will unload the contents if data hasn’t been used for over 24 hours. As multiple queries arrive, sometimes they might require more CPU time than available on a worker, if there is still reservation available, a new worker will be assigned to same blocks and subsequent requests for the same blocks will be load-balanced between the workers.
BI Engine can also process super-fresh data that was streamed to the BigQuery table. Therefore, there are two formats supported by BI Engine workers currently – Capacitor and streaming.
In-memory capacitor blocks
Generally, data in a capacitor block is heavily pre-processed and compressed during generation. There are a number of different ways the data from the capacitor block can be cached, some are more memory efficient, while others are more CPU efficient. BI Engine worker intelligently chooses between those preferring latency and CPU-efficient formats where possible. Thus actual reservation memory usage might not be the same as logical or physical storage usage due to the different caching formats.
In-memory streaming data
Streaming data is stored in memory as blocks of native array-columns and is lazily unloaded when blocks get extracted into Capacitor by underlying storage processes. Note that for streaming, BI workers need to either go to streaming storage every time to potentially obtain new blocks or serve slightly stale data. BI Engine prefers serving slightly stale data and loading the new streaming blocks in the background instead.
BI Engine worker does this opportunistically during the queries, if the worker detects streaming data and the cache is newer than 1 minute, a background refresh is launched in parallel with the query. In practice, this means that with enough requests the data is no more stale than the previous request time. For example if a request arrives every second, then the streaming data will be around a second stale.
First requests loading data are slow
Due to the read time optimizations, loading data from previously unseen columns can take longer than BigQuery does. Subsequent reads will benefit from these optimizations.
For example, the query above here is backend time for a sample run of the same query with BI Engine off, first run and subsequent run.
Multiple block processing and dynamic single worker execution
BI Engine workers are optimized for BI workloads where the output size will be small compared to the input size and the output will be mostly aggregated. In regular BigQuery execution, a single worker tries to minimize data loading due to network bandwidth limitations. Instead, BigQuery relies on massive parallelism to complete queries quickly. On the other hand, BI Engine prefers to process more data in parallel on a single machine. If the data has been cached, there is no network bandwidth limitation and BI Engine further reduces network utilization by reducing the number of intermediate “shuffle” layers between query stages.
With small enough inputs and a simple query, the entire query will be executed on a single worker and the query plan will have a single stage for the whole processing. We constantly work on making more tables and query shapes eligible for a single stage processing, as this is a very promising way to improve the latency of typical BI queries.
For the example query, which is very simple and the table is very small, here is a sample run of the same query with BI Engine distributed execution vs single node (default).
How to get most out of BI Engine
While we all want a switch that we can toggle and everything becomes fast, there are still some best practices to think about when using BI Engine.
Output data size
BI optimizations assume human eyes on the other side and that the size of output data is small enough to be comprehensible by a human. This limited output size is achieved by selective filters and aggregations. As a corollary, instead of SELECT * (even with a LIMIT), a better approach will be to provide the fields one is interested in with an appropriate filter and aggregation.
To show this on an example – query “SELECT * FROM samples.shakespeare” processes about 6MB and takes over a second with both BigQuery and BI Engine. If we add MAX to every field – “SELECT MAX(word), MAX(word_count), MAX(corpus), MAX(corpus_date) FROM samples.shakespeare”, both engines will read all of the data, perform some simple comparisons and finish 5 times faster on BigQuery and 50 times faster on BI Engine.
Help BigQuery with organizing your data
BI Engine uses query filters to narrow down the set of blocks to read. Therefore, partitioning and clustering your data will reduce the amount of data to read, latency and slot usage. With a caveat, that “over partitioning” or having too many partitions might interfere with BI Engine multi-block processing. For optimal BigQuery and BI Engine performance, partitions larger than one gigabyte are preferred.
Query depth
BI Engine currently accelerates stages of the query that read data from the table, which are typically the leaves of the query execution tree. What this means in practice is that almost every query will use some BigQuery slots.That’s why one gets the most speedup from BI Engine when a lot of time is spent on leaf stages. To mitigate this, BI Engine tries to push as many computations as possible to the first stage. Ideally, execute them on a single worker, where the tree is just one node.
For example Query1 of TPCH 10G benchmark, is relatively simple. It is 3 stages deep with efficient filters and aggregations that processes 30 million rows, but outputs just 1.
Running this query in BI Engine we see that the full query took 215 ms with “S00: Input” stage being the one accelerated by BI Engine taking 26 ms.
Running the same query in BigQuery gets us 583ms, with “S00: Input” taking 229 ms.
What we see here is that the “S00: Input” stage run time went down 8x, but the overall query did not get 8x faster, as the other two stages were not accelerated and their run time remained roughly the same. With breakdown between stages illustrated by the following figure.
In a perfect world, where BI Engine processes its part in 0 milliseconds, the query will still take 189ms to complete. So the maximum speed gain for this query is about 2-3x.
If we, for example, make this query heavier on the first stage, by running TPCH 100G instead, we see that BI Engine finishes the query 6x faster than BigQuery, while the first stage is 30 times faster!
vs 1 second on BigQuery
Over time, our goal is to expand the eligible query and data shapes and collapse as many operations as feasible into a single BI Engine stage to realize maximum gains.
Joins
As previously noted, BI Engine accelerates “leaf” stages of the query. However, there is one very common pattern used in BI tools that BI Engine optimizes. It’s when one large “fact” table is joined with one or more smaller “dimension” tables. Then BI Engine can perform multiple joins, all in one leaf stage, using so-called “broadcast” join execution strategy.
During the broadcast join, the fact table is sharded to be executed in parallel on multiple nodes, while the dimension tables are read on each node in their entirety.
For example, let’s run Query 3 from the TPC-DS 1G benchmark. The fact table is store_sales and the dimension tables are date_dim and item. In BigQuery the dimension tables will be loaded into shuffle first, then the “S03: Join+” stage will, for every parallel part of store_sales, read all necessary columns of two dimension tables, in their entirety, to join.
Note that filters on date_dim and item are very efficient, and the 2.9M row fact table is joined only with about 6000 rows. BI Engine plan will look a bit different, as BI Engine will cache the dimension tables directly, but the same principle applies.
For BI Engine, let’s assume that two nodes will process the query due to the store_sales table being too big for a single node processing. We can see on the image below that both nodes will have similar operations – reading the data, filtering, building the lookup table and then performing the join. While only a subset of data for the store_sales table is being processed on each, all operations on dimension tables are repeated.
Note that
“build lookup table” operation is very CPU intensive compared to filtering
“join” operation performance also suffers if the lookup tables are large, as it interferes with CPU cache locality
dimension tables need to be replicated to each “block” of fact table
The takeaway is when join is performed by BI Engine, the fact table is sometimes split into different nodes. All other tables will be copied multiple times on every node to perform the join. Keeping dimension tables small or selective filters will help to make sure join performance is optimal.
Conclusions
Summarizing everything above, there are some things one can do to make full use of BI Engine and make their queries faster
Less is more when it comes to data returned – make sure to filter and aggregate as much data as possible early in the query. Push down filters and computations into BI Engine.
Queries with a small number of stages get the best acceleration. Preprocessing the data to minimize query complexity will help with optimal performance. For example, using materialized views can be a good option.
Joins are sometimes expensive, but BI Engine may be very efficient in optimizing typical star schema queries.
We have talked about ways that big data can help grow your business. But big data can also help demonstrate the importance of pursuing a degree in business as well.
Data analytics technology is constantly shedding new insights into our lives. Many things are well observed through anecdotal experiences, but we have had a hard time proving them before data analytics technology became mainstream.
The value of technical MBAs and other degrees is a prime example. A growing number of experts are using data analytics technology to help illustrate the ROI that they offer.
What value does an MBA provide? How can data analytics technology help back it up?
Data Analytics Technology Proves Technical MBA Degrees Offer Huge Value
Getting a graduate degree is a big decision. It has its appeal, sure. Better pay. Career advancement. And, of course, you are also just sincerely interested in the subject matter. You may have chosen a career in healthcare or another admirable profession because you want to have a positive impact on people’s lives. You believe that getting an MBA might help you do that a little bit better.
On the other hand, you can’t really think of a bigger commitment. It’s expensive. It takes a lot of time. What is a motivated professional to do?
You might want to consider investing in a technical MBA. You might have been skeptical of the benefits in the past, but data analytics technology has helped many professionals get a better sense of the value that it offers.
Data analytics has helped companies evaluate the salaries of different professionals before and after they got their degrees. This has helped provide data-driven insights into the benefits of getting this specialized degree.
Data analytics has also helped professionals discover the unique opportunities that they can pursue with a technical MBA. They can use data mining tools to find job opportunities that are best suited for their credentials.
In this article, we take a look at how getting your MBA can positively impact your career trajectory. It will cover some of the factors that data analytics has evaluated to gauge the ROI of this degree.
Specialized MBAs in big data
You may also pursue a specialized MBA with a focus in big data or a similar field. As the linked article from Fortune shows, these degrees are in huge demand as more companies are looking for experts in business analytics.
Leverage
Getting an MBA provides you with valuable career leverage. Your employer may not be interested in paying you more than they already are. However, now that you have an MBA you are a hotter commodity than you used to be. If the hospital that you work for now doesn’t want to fork over more money, there will probably be one somewhere that is more willing.
Of course, you can’t get too crazy. No one is going to double your salary overnight. But feel out the market a little bit. If there is a big demand for people with your specialty — right now there is — it can help with your negotiations.
The general rule of thumb is to start 5-10% higher than you actually expect to get. That way you can negotiate a little bit and still wind up with a number you are happy with.
Data analytics helps people with MBAs prove the value of their degree. They can use data mining to find meaningful insights on the benefits of their education, which they can bring up in their job interviews.
Networking
Networking isn’t exactly what people think it is. You don’t go to a party one day and meet Ms. HospitalOverlord. “An MBA, you say? You’ll come work for me, won’t you? How does one million dollars a year sound?”
You don’t get jobs just because you know people, but connections do help you stand out in otherwise crowded candidate pools. Graduate school is a particularly good place to meet people. Many of your fellow students will already be professionally situated. They may have firsthand knowledge about job openings. If not, they may be able to put you in contact with someone who does.
Similarly, your instructors will probably also work closely within the industry. If they are not currently involved professionally with hospitals, they will almost certainly know people who are.
These connections add up to new opportunities.
The benefits of networking are even more significant in the age of big data. People can use digital platforms like LinkedIn to establish more connections, which helps them leverage big data.
Upskilling
The most obvious benefit of graduate school for your career trajectory is that it equips you with new skills. Strip away everything else, and this is the real value of your degree. It’s what your employers are looking for in an MBA.
Well, ok. But I’ve been working in the industry for ten years. I learn on the job.
You do. But you do it through a lens that is at least ten years old. Most people stagnate with the same professional perspective they had when they left school. It’s not really their fault. It’s difficult to grow professionally while also trying to, you know, do your job.
Getting an MBA is a sure way to refresh your understanding of key concepts and get a new understanding of current trends. For example, people who graduated ten years ago entered a professional landscape with a much different understanding of digital technologies.
You may not have learned enough about data implementation or digital records to satisfy current expectations.
Of course, it’s a good idea to routinely update your skills, and you don’t always need to go in for a full degree to do it. There are upskilling curriculums that can be completed in weeks instead of years. They serve as an excellent way to brush up on new concepts and potentially acquire a little bit of professional momentum in the process.
But while these are handy opportunities to take advantage of from time to time, they don’t have quite the same career impact that an MBA has.
You Just Stand Out
Finally, MBAs stand out more than people without advanced degrees. If your objective is to move up the corporate ladder, you are going to need to be competitive. Though it may cynical to say it, working hard only gets you so far. Everyone at your level works hard. That’s how they got there in the first place.
If you’re neck and neck with a coworker for a promotion, having an advanced degree may be just the thing that tips you over the edge. And again, it’s not only about moving up at the hospital where you are at right now.
MBAs can open up doors all over the place. If you aren’t getting the career traction you are hoping for at your current hospital, the MBA will make it much easier to change lanes and nab a better position for yourself.
Big Data Shows the True Value of an MBA
A growing number of people are discovering the value of MBAs. Data analytics technology has helped make the case that they are even more valuable than previously thought. People with specialized MBAs may benefit even more, since big data has become so important in business.
Nursing professionals will need to appreciate the importance of big data and know how to use it effectively. Keep reading to learn more.
The Growing Relevance of Big Data in the Nursing Profession
Healthcare technology is changing all the time. These developments creep into the hospital routine and have a direct impact not just on how nurses do their jobs, but also on how well the patients do in and out of the hospital.
Big data is especially important for the nursing sector. A 2017 study from Harvard Medical School discusses some of the changes big data has created for nurses.
It’s a big deal. So, what’s out there? And how is it impacting patients, and their eventual path to recovery? In this article, we talk about how big data technology impacts nurses and the communities they serve.
Data Processing and Implementation
Nurses and hospitals in general are using data to improve their ability to serve the community. During the height of Covid, data processing was used to anticipate surges and help hospital nurses and administrators plan out how to best use their limited resources.
It’s used now to predict other viral surges — the flu for example — and provide more general evaluations of local health. Big data is driving big changes in healthcare.
While hospitals mostly do the same things, the communities that they serve can be very different. Maybe Town X has significantly higher levels of obesity than the national averages would indicate. Data analysis allows Town X’s hospital to anticipate what sort of medical conditions these high obesity levels will produce, and plan accordingly.
Town Y, on the other hand, has a factory that produces high emissions. The data there has not only helped the hospital treat the various respiratory conditions that those emissions have produced, but it is also helping locals motion for increased sanctions on the factory.
Data is so important to modern healthcare that nurses can now specialize in it. Analytic nursing is still a relatively obscure facet of the industry. However, as data technology in healthcare continues to expand, data comprehension is a professional skill that will only grow in importance and demand.
Patient Independence
The last twenty years of healthcare-related technological developments have given patients increased autonomy during their stays in the hospital. Being admitted can be a traumatic experience for many people, even excepting the fact that it usually means their health is bad.
Once you’re admitted, you are at the mercy of the doctors and nurses working on your floor. You can’t eat without them bringing you food. You can’t even sleep uninterrupted without getting woken up every few hours for a test or a check-in.
It has to be this way of course. If you didn’t need these things, you probably wouldn’t need to be in the hospital at all. But it can be a demoralizing experience. Good thoughts breed good outcomes, so it is important to provide patients with as much independence as possible.
Smart hospital beds make this possible. For the patient, it means they can do things like adjust their position and comfort levels without calling in a nurse. A process that used to not only mean bothering the floor staff, but also sitting in your bed for who knows how long, waiting for them to come by.
For the floor nurses, it means fewer interruptions for small tasks, so they can focus more on patient care.
An adjustable bed? That doesn’t sound terribly smart.
Well. Fair enough. The patient experiences the bed in terms of its adjustability. The increased level of autonomy and comfort that they are given. However, the adjustability features are the tip of the iceberg. The bed can also monitor patient activity and provide data on things like heart rate, or even sleep patterns — important metrics that can make a big difference in healthcare outcomes.
Remote Patient Monitoring
So while the patient is sleeping on their fancy bed, Drew is down the hall making his rounds. He’s a good nurse, but one of his most distinct limitations — often cited on his employee evaluations — is that he can’t be in two places at once.
So when he is checking in on Molly Gordon, a young woman who was recently diagnosed with type one diabetes, he has no idea that Malcolm Ingram’s heart rate just plummeted down the hall.
Until his remote monitoring technology sounds the alert. Drew, along with several other nurses respond to the call. Malcolm is saved thanks to remote monitoring technology.
Heart monitors and other wearable healthcare devices make it easier for doctors and nurses to see what their patients are doing from anywhere.
Better yet, you don’t have to be in a hospital to use wearables. Heart monitors, pacemakers, glucose monitors, and other common healthcare devices are now often infused with Bluetooth technology. Referred to as the Internet of Things (IoT) these devices communicate directly with doctors or the patient themselves to provide up-to-the-minute health updates that can be lifesaving.
Malcolm’s story could have played out just as easily at home. Heartrate plummets. His heart monitor sends out the alert. .The company could theoretically call an ambulance. Or perhaps his emergency contact — a sister living down the street — gets the message and intervenes.
There are more ways than ever to provide high-quality healthcare evaluations, and data collection remotely.
A Wearables Postscript
As a short epilogue for the wearables conversation, it’s worth remembering that you don’t need to have a pre-existing condition to get in on the wearables game. Fitness trackers are a common wearable that people all over the world use.
In fact, Malcolm’s FitBit was how he first learned that his heart rate tends to dip in his sleep. These devices provide people with important information about their sleeping habits, heart rate, and even their blood pressure. Data points they might otherwise have only gotten once a year.
Big Data is Crucial for the Nursing Profession
A growing number of nursing professionals are discovering the benefits of big data technology. The benefits of using data technology are well documented.
Any sports player or fan should be aware that data analysis has become a significant part of sports. As individuals and teams seek to gain an advantage over the opposition, analyzing data and using the results to shape your performance is one of the best ways to get ahead.
Whether you are an English Premier League soccer team, a Moneyball baseball team, a roller skater, a golfer, or a National Hockey League franchise, the collection and use of data in sports are now commonplace. According to Bloomberg, the market for sports research and data analysis net worth is expected to be around $8.4 Billion by 2026.
In this brief article, we explore the impact of data analytics on sports.
Data in Individual Sports
Data analytics are commonplace in individual sports such as roller skating and can be used in a variety of ways. For example, when going for a skate fitting, the use of the 3D skate lab gives a 3D scan of your feet and suggests the most suitable skate style for you. For example, it can recommend the most suitable roller skates for wide feet, sprinters, or roller hockey players.
In terms of performance, data techniques such as tracking learning detection and video analysis, provide roller skate coaches with tools in which they can convey suitable technical improvements to skaters.
In sports such as speed skating, knowing and learning the technical improvements required to maximize speed can be the difference between finishing in first or second place.
Helping You Win
Data is used in sports to gain an advantage over the opposition. Depending on the sport, data is used in different ways. For example, in soccer, management will use key performance indicators to review whether a prospective transfer of a player should take place. These indicators may include the player’s sprint speed or distance covered per goal.
Increasingly, soccer teams look at stats such as expected goals (Xg) as a key metric to understand underlying performance levels other than the actual scoreline. The cut-through of soccer stats is so clear that even pundits after the game are now discussing Xg as a tool to better describe the narrative of a soccer game.
When Leicester City blew everyone away to win the English Premier League in 2015-16, it was credited largely to their extensive data analytics team, who managed to use data to craft a perfectly balanced squad that implemented the manager’s style of play.
Another of the most famous pioneering examples of using data analytics to improve performance was made in the Moneyball film. Billy Beane, General Manager of the Oakland Athletics baseball team used sabermetrics to help recruit players for the team, despite having a shoestring budget. Oakland Athletics become famous in the 2002 season for a 20-game winning streak.
Driving Consumer Engagement
Data analytics don’t only impact the way individuals and teams play a sport, but also how the general public engages with the sport.
Most large-scale sports organizations have staff responsible for monitoring digital engagement and online content to boost engagement with a sporting individual or team. Using online tools such as social media, digital and communication experts use online analytics to best shape marketing campaigns.
For example, a sports team that wants to connect with millennials may use Instagram as the primary tool to roll out a marketing campaign. But if their focus was Gen Z, they may use other social media sites such as Snapchat to attract the younger audience.
Benefiting The Sport Ecosystem
The whole sporting ecosystem also gains a benefit from the increase in data analytics. For example, analytics are increasingly used to help manage crowds inside stadiums, manage congestion before and after matches, and even help sell more food and drink inside stadiums.
Many large-scale sports teams now partner with retailers, payment providers, and telecommunications firms that can provide real-time data on consumer behavior. Understanding crowd behavior in stadiums with large crowds can be particularly helpful as it can guide the messaging and communication strategy with the crowd.
Data and Equipment
Data is very popular for individual sports such as golf and tennis to help guide players to purchase certain equipment pieces.
For example, you may wish to purchase an expensive Driver to boost your golf game. Many YouTubers and golf professionals will use devices such as launch monitors to conduct product reviews on golf clubs to give you quick insights into whether certain clubs are a match for your playing style.
Launch monitors in golf are also great for assessing your performance. Real-time insights into your carry distance, club head speed, and spin revolutions can help you understand your golf game better.
Final words
Data in sports is a serious business. It can be used in a variety of different ways from understanding the strengths and weaknesses of the opposition, improving the understanding of your game, improving digital engagement of yourself or your team, helping you select the best equipment piece, and also helping with crowd management.
Arvind Ltd has been in the apparel industry for more than 90 years, with its retail powerhouse Arvind Fashions Ltd being the backbone of well-known names in the retail fashion industry in India.
Arvind Fashions Ltd (Arvind) has seen significant growth in its portfolio with new franchises being added every year. The six high conviction brands include Tommy Hilfiger, Calvin Klein, Sephora, Arrow, U.S. Polo Assn. & Flying Machine.
To secure a foundation for future growth, the company has embarked on a digital transformation (DX) journey, focusing on profitability and improving the customer experience. The key objectives for Arvind’s DX is to unlock the value of existing applications, gain new insights, and build a solid workflow with resilient systems.
Getting Google Cloud to address the challenges around insights & analytics was a natural step forward, since Arvind had already formed a relationship with Google Cloud, starting with its productivity and collaboration tools during the pandemic.
Key Challenges
Arvind’s enterprise applications estate is a mix of SAP, Oracle POS, logistics management systems and other applications. Having so many different applications made it a challenge for the company to bring all of this data together to drive retail insights and at the same time maintain the freshness of its products.
As a case in point, the existing sales reporting and inventory reconciliation process had been enabled by a mix of automated and semi-automated desktop applications. There were challenges to scale the infrastructure in order to process large amounts of data at a low latency.
The synchronization of master data across functions was critical to build the data platform that provides consistent insights to multiple stakeholders across the organization.
Solution Approach – Modern Data Platform
There are several ways to solve the challenges above and do more by building a modern data analytics platform. For example, using a data lake based approach that builds use case by use case, hybrid data estates and so on. Regardless of the approach, it is important to define the solution based on certain principles.
In Arvind’s scenario, the key business principles considered are that data platforms should support Variety, Variability, Velocity and Volume. Each of these 4 V’s are critical business pivots to successful fashion retailing. Variety in SKU’s to deal with myriad fashion trends every season, Variability in shopping footfalls due to different festivities, weekends and special occasions, Velocity to be agile and responsive to customer needs, and Volumes of data that bring richer insights.
This is where Google BigQuery enabled data platform comes in, as it is able to meet the needs above.
Solution Architecture – Current Capabilities & Future Vision
BigQuery is the mothership of the data and analytics platform on Google Cloud. Its serverless construct ensures that data engineering teams focus only on insights & analytics. Storage and compute is decoupled and can be independently scaled. BigQuery has been leveraged to service both the raw as well as the curated data zones.
With BigQuery procedures, it is possible to process the data natively within the data warehouse itself. Procedures have been leveraged to process the data in a low latency manner with the familiar SQL.
But then what happens to advanced analytics and insights? With simplicity being our key guiding principle, BigQuery machine learning ensures that data analysts can create, train and deploy analytics models even with complex requirements. It can also consume data from Looker Studio, which is seamlessly integrated with BigQuery.
Here are the key principles and highlights of the data platform that have been achieved:
Simple, yet exhaustive – We needed a solution with vast technical capabilities such as data lake & data warehouse, data processing, data consumption, analytics amongst others. And at the same time it needed to be simple to implement and run ongoing operations.
Agility – High quality analytics use cases typically require a significant amount of time, effort and skill set. While building a simple solution we ensured that the selection of technology services ensured agility in the long term.
Security – An organization can be truly successful if the insights and analytics operations are democratized. But while data is made available to a wider community, we need to ensure data governance and security.
Ease of operations – Data engineering teams spend a lot of time doing infrastructure setting and management operations. With BigQuery, teams can put in more effort on building the data pipelines and models to feed into analytics instead of worrying about the infrastructure operations.
Costs – Decoupling storage and compute allows for flexible pricing. A pay-as-you-go model is the ideal solution to managing costs.
Business Impact
The ingestion frequency of the store level inventory (~800 stores) has now been changed to daily. With the additional data volumes and processing the scaling on BigQuery has been seamless. There are new processes and dashboards to address the reconciliation and root cause analysis. Operational efficiencies have improved leading to better productivity and turn around time of critical processes.
The discrepancies in various reconciliation activities have drastically reduced by an order of magnitude of 300X due to the capabilities offered by the data platform. Not only is it possible to identify discrepancies but the data platform has also enabled in identifying the root causes for the same as well.
Arvind Fashions Ltd have also been able to enhance some of the existing business processes and systems with insight from the data platform.
It’s going to be an exciting journey for Arvind Fashions Ltd and Google Cloud. There are several initiatives ready for kick off such as getting more apps on the edge devices, warehouse analytics, advanced customer data platforms, predicting the lifecycle of designs, style codes and other exciting initiatives.