How PLAID put the ‘real’ in real-time user analytics with Bigtable

How PLAID put the ‘real’ in real-time user analytics with Bigtable

Editor’s note: Today we hear from PLAID, the company behind KARTE, a customer experience platform (CxP) that helps businesses provide real-time personalized and seamless experiences to their users. PLAID recently re-architected its real-time user analytics engine using Cloud Bigtable, achieving latencies within 10 milliseconds. Read on to learn how they did it. 

Here at PLAID, we rely on many Google Cloud products to manage our data in a wide variety of use cases: AlloyDB for PostgreSQL for relational workloads, BigQuery for enterprise data warehousing, and Bigtable, an enterprise-grade NoSQL database service. Recently, we turned to Bigtable again to help us re-architect our core customer experience platform — a real-time user analytics engine we call “Blitz.” 

To say we ask a lot of Blitz is understatement: our high-traffic environment receives over 100,000 events per second, which Blitz needs to process within a few hundred milliseconds end-to-end. In this blog post, we’ll share how we re-architected Blitz with Bigtable and achieved truly real-time analytics under heavy write traffic. We’ll delve into the architectural choices and implementation techniques that allowed us to accomplish this feat, namely, implementing a highly scalable, low-latency distributed queue.

What we mean by real-time user analytics

But first, let’s discuss what we mean when we say ‘real-time user analytics’. In a real-time user analytics engine, when an event occurs for a user, different actions can be performed based on event history and user-specific statistics. Below is an example of an event data and a rule definition that filters to a specific user for personalized action.

code_block[StructValue([(u’code’, u'{rn $meta: {rn name: “nashibao”,rn isMember: 1rn },rn $buy: {rn items: [{rn sku: “xxx”,rn price: 1000,rn }]rn }rn}’), (u’language’, u”), (u’caption’, <wagtail.wagtailcore.rich_text.RichText object at 0x3e3cdca79e90>)])]
code_block[StructValue([(u’code’, u’match(“userId-xxx”,rn DAY.Current(‘$meta.isMember’, ‘last’) = 1,rn ALL.Current(‘$buy.items.price’, ‘avg’) >= 10000,rn WEEK.Previous(‘$buy.items.price’, ‘sum’) <= 100,rn WEEK.Previous(‘$session’, ‘count’) > 10,rn …rn)’), (u’language’, u”), (u’caption’, <wagtail.wagtailcore.rich_text.RichText object at 0x3e3cdca79490>)])]

This is pseudo-code for a rule to verify whether “userId-xxx” is a user who is a “member”, has an average purchase price of 10,000 yen or more in a year, had a session count of 10 or more last week, but who purchased little to nothing.

When people talk about real-time analytics, they usually mean near-real-time, where statistics can be seconds or even minutes out-of-date. However, being truly real-time requires that user statistics are always up-to-date, with all past event histories reflected in the results available to the downstream services. The goal is very simple, but it’s technically difficult to keep user statistics up-to-date — especially in a high-traffic environment with over 100,000 events per second and required latency within a few hundred milliseconds. 

Our previous architecture

Our previous analytics engine consisted of two components: a real-time analytics component (Track) and a component that updates user statistics asynchronously (Analyze).

Figure 3: Architecture of the previous analytics engine

The key points of this architecture are:

In the real-time component (Track), the user statistics generated in advance from the key-value store are read-only, and no writing is performed to it.

In Analyze, streaming jobs roll up events over specific time windows.

However, we wanted to meet the following strict performance requirements for our distributed queue:

High scalability – The queue must be able to scale with high-traffic event numbers. During peak daytime hours, the reference value for the write requests is about 30,000 operations per second, with a write data volume of 300 MiB/s.

Low latency that achieves both fast writes and reads within 10 milliseconds.

But the existing messaging services could not meet both high-scalability and low-latency requirements simultaneously — see Figure 4 below.

Figure 4: Comparison between existing messaging services

Our new real-time analytics architecture

Based on the technical challenges explained above, Figure 5 below shows the architecture after the revamp. Changes from the existing architecture include:

We divided the real-time server into two parts. Initially, the frontend server is responsible for writing events to the distributed queue.

The real-time backend server reads events from the distributed queue and performs analytics.

Figure 5: Architecture of the revamped analytics engine

In order to meet both our scalability and latency goals, we decided to use Bigtable, which we already used as our low-latency key-value store, to implement our distributed queue. Here’s the specific method we used.

Bigtable is mainly known as a key-value store that can achieve latencies in the single-digit milliseconds and be scaled horizontally. What caught our attention is the fact that performing range scans in Bigtable that specify the beginning and end of row keys is also fast.

The specific schema for the distributed queue can be described as follows:

code_block[StructValue([(u’code’, u’Row key = ${prefix}_${user ID}_${event timestamp}rnValue = event data’), (u’language’, u”), (u’caption’, <wagtail.wagtailcore.rich_text.RichText object at 0x3e3cdeba9c90>)])]

The key point is the event timestamp added at the end. This allows us to perform range scans by specifying the start and end of the event timestamps.

Furthermore, we were able to easily implement a feature to delete old data from the queue by setting a time-to-live (TTL) using Bigtablegarbage collection feature.

By implementing these changes, the real-time analytics backend server was able to ensure that the user’s statistics remain up-to-date, regardless of any unreflected events. 

Additional benefits of Bigtable

Scalability and low latency weren’t the only things that implementing a distributed queue with Bigtable brought to our architecture. It was also  cost-effective and easy to manage.

Cost efficiency

Thanks to the excellent throughput of the SSD storage type and a garbage collection feature that keeps the amount of data constant by deleting old data, we can operate our real-time distributed queue at a much lower cost than we initially anticipated. In comparison to running the same workload on Pub/Sub, our calculations show that we operate at less than half the cost.

Less management overhead

From an infrastructure operation perspective, using the Bigtable auto-scaling feature reduces our operational cost. In case of a sudden increase in requests to the real-time queue, the Bigtable cluster can automatically scale out based on CPU usage. We have been operating this real-time distributed queue for over a year reliably with minimal effort.

Supercharging our real-time analytics engine

In this blog post, we shared our experience in revamping our core real-time user analytics engine, Blitz, using Bigtable. We successfully achieved a consistent view of the user in our real-time analysis engine under high traffic conditions. The key to our success was the innovative use of Bigtable to implement a distributed queue that met both our high scalability and low latency requirements. By leveraging the power of Bigtable low-latency key-value store and its range scan capabilities, we were able to create a horizontally scalable distributed queue with latencies within 10ms.

We hope that our experience and the architectural choices we made can serve as a valuable reference for global engineers looking to enhance their real-time analytics systems. By leveraging the power of Bigtable, we believe that businesses can unlock new levels of performance and consistency in their real-time analytics engines, ultimately leading to better user experiences and more insightful decision-making.

Looking for solutions to up your real-time analytics game? Find out how Bigtable is used for a wide-variety of use cases from content engagement analytics and music recommendations toaudience segmentation, fraud detectionand retail analytics.

Source : Data Analytics Read More

Accelerate BigLake performance to run large-scale analytics workloads

Accelerate BigLake performance to run large-scale analytics workloads

Data lakes have historically trailed data warehouses in key features, especially query performance that limited the ability to run large-scale analytics workloads. With BigLake, we lifted these restrictions. This blog post shares an under-the-hood view of how BigLake accelerates query performance through a scalable metadata system, efficient query plans and materialized views.

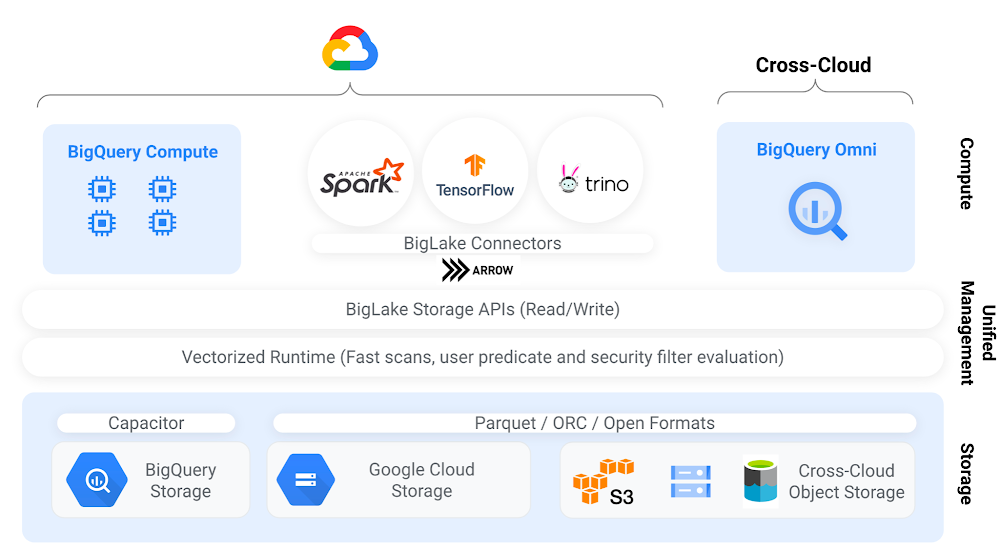
BigLake allows customers to store a single copy of the data on cloud object storage in open file formats such as Parquet, ORC, or open-source table formats such as Apache Iceberg. BigLake tables can be analyzed using BigQuery or an external query engine through high-performance BigLake storage APIs (not supported in BigQuery Omni currently). These APIs embed Superluminal, a vectorized processing engine that allows for efficient columnar scans of the data and enforcement of user predicates and security filters. There is zero expectation of trust from external query engines, which is especially significant for engines such as Apache Spark that run arbitrary procedural code. This architecture allows BigLake to offer one of the strongest security models in the industry.  

Several Google Cloud customers leverage BigLake to build their data lake houses at scale.  

“Dun & Bradstreet aspires to build a Data Cloud with a centralized data lake and unified data process platform in Google Cloud. We had challenges in performance and data duplication. Google’s Analytics Lakehouse architecture allows us to run Data Transformation, Business Analytics, and Machine Learning use cases over a single copy of data. BigLake is exactly the solution that we needed.” –  Hui-Wen Wang, Data Architect, Dun & Bradstreet

Accelerate query performance

Below, we describe recent performance improvements to BigLake tables by leveraging Google’s novel data management techniques across metadata, query planning and materialized views.  

Improve metadata efficiency

Data lake tables typically require query engines to perform a listing operation on object storage buckets — and listing of large buckets with millions of files is inherently slow. On partitions that query engines cannot prune, the engine needs to peek at the file footers to determine if it can skip data blocks, requiring several additional IOs to the object store. Efficient partition and file pruning is crucial to speeding up query performance.

We are excited to announce the general availability of metadata caching for BigLake tables.  This feature allows BigLake tables to automatically collect and maintain physical metadata about files in object storage. BigLake tables use the same scalable Google metadata management system employed for BigQuery native tables, known as Big Metadata

Using Big Metadata infrastructure, BigLake caches file names, partitioning information, and physical metadata from data files, such as row counts and per-file column-level statistics. The cache tracks metadata at a finer granularity than systems like the Hive Metastore, allowing BigQuery and storage APIs to avoid listing files from object stores and achieve high-performance partition and file pruning.

Optimize query plans

Query engines need to transform an SQL query into an executable query plan. For a given SQL query, there are usually several possible query plans. The goal of a query optimizer is to choose the most optimal plan. A common query optimization is dynamic constraint propagation where the query optimizer dynamically infers predicates on the larger fact tables in a join from the smaller dimension tables. While this optimization can speed up queries using normalized table schemas, most implementations require reasonably accurate table statistics.

The statistics collected by metadata caching enable both BigQuery and Apache Spark to build optimized high-performance query plans. To measure the performance gains, we performed a power run of the TPC-DS Hive Partitioned 10T benchmark where each query is executed sequentially. Both the Cloud Storage bucket and the BigQuery dataset were in the us-central1 region and a 2000 slot reservation was used. The below chart shows how the BigQuery slot usage and the query execution time have improved for queries through the statistics collected by the BigLake metadata cache. Overall, the wall clock execution time decreased by a factor of four with metadata caching.

Supercharge Spark performance

The open-source Spark BigQuery connector allows reading BigQuery and BigLake tables into Apache Spark DataFrames. The connector uses BigQuery storage APIs under the hood and is integrated to Spark using Spark’s DataSource interfaces.  

We recently rolled out several improvements in the Spark BigQuery connector, including: 

Support for dynamic partition pruning.

Improved join reordering and exchange reuse.

Substantial improvements to scan performance.

Improved Spark query planning: table statistics are now returned through Storage API.

Asynchronous and cached statistics support.

Materialized views on BigLake tables

Materialized views are precomputed views that periodically cache the results of a query for improved performance. BigQuery materialized views can be queried directly or can be used by the BigQuery optimizer to accelerate direct queries on the base tables.

We are excited to announce the preview of materialized views over BigLake tables. These materialized views function like materialized views over BigQuery native tables, including automatic refresh and maintenance. Materialized views over BigLake tables can speed up queries since they can precompute aggregations, filters and joins on BigLake tables. Materialized views are stored in BigQuery native format and have all the performance characteristics of BigQuery native storage.

Next steps

If you’re using external BigQuery tables, please upgrade to BigLake tables and take advantage of these features by following the documentation for metadata caching and materialized views. To benefit from the Spark performance improvements, please use newer versions of Spark (>= 3.3) and the Spark-BigQuery connector. To learn more, check out this introduction to BigLake tables, and visit the BigLake product page.

Acknowledgments:
Kenneth Jung, Micah Kornfield, Garrett Casto,  Zhou Fang, Xin Huang, Shiplu Hawlader, Fady Sedrak, Thibaud Hottelier, Lakshmi Bobba, Nilesh Yadav, Gaurav Saxena, Matt Gruchacz, Yuri Volobuev, Pavan Edara, Justin Levandoski and rest of the BigQuery engineering team. Abhishek Modi, David Rabinowitz, Vishal Karve, Surya Soma and rest of the Dataproc engineering team.

Source : Data Analytics Read More

Transform your Apache Iceberg lakehouse with BigLake

Transform your Apache Iceberg lakehouse with BigLake

When your data is siloed data across lakes and warehouses, it can be hard to transform outcomes with your data. Apache Iceberg is an open table format that provides data management capabilities for data hosted on object stores and enables organizations to run analytics and AI use cases over a single copy of data. A growing community of data engineers, customers, and industry partners are contributing, integrating, and deploying Iceberg, making it the standard for organizations building open-format lakehouses. 

To help customers on this journey, we announced support for Iceberg through BigLake in October, 2022. Since its preview, many customers have started building lakehouse workloads using Apache Iceberg as their data management layer, and this support is now generally available. 

Unify analytics, streaming and AI use cases over a single copy of data

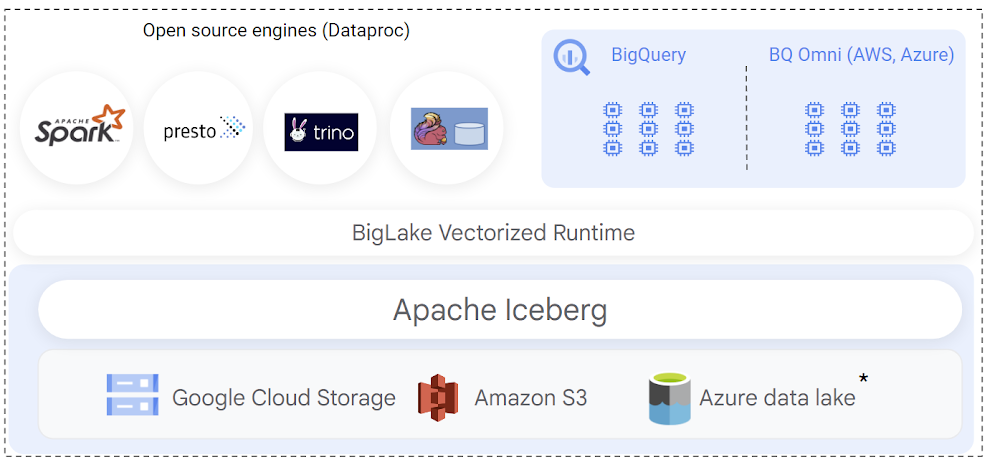
You can use open-source engines to process and ingest data into Iceberg tables, and BigQuery can query those tables. Since the preview, customers have also used Spark, Trino and Flink to process Iceberg tables and make those tables available to their BigQuery users. Then, BigLake Metastore provides shared metadata for Iceberg tables across BigQuery and open-source engines, eliminating the need to maintain multiple table definitions. Further, you can provide BigQuery datasets and table properties when creating new Iceberg tables in Spark, and those tables become automatically available for the BigQuery user to query.

*Coming soon

When implementing Iceberg lakehouse workloads, query performance is a top priority for data warehouse users. BigQuery natively integrates with the Iceberg transaction logs and leverages its rich metadata for efficient query planning. Query plans are designed to reduce BigQuery compute consumption by lowering the amount of scanned data, by optimizing joins, and by improving data-plane parallelism. The net result is that you get better query performance and lower slot usage when querying BigLake Iceberg tables. 

This GA release also adds support to provide automatic synchronization of table schema in BigQuery when the table is modified through an open-source engine. 

Engine-agnostic, industry-leading security and governance built-in

Customers have been telling us that building Iceberg lakehouses in a secure and governed manner is a top priority. BigLake support for Iceberg provides fine-grained access control, including row- and column-level security as well as data masking to simplify this. These features are designed to work independently of the query engine. During the preview, we expanded BigQuery to also support differential privacy for all tables including Iceberg. 

You can also define security policies on a BigLake Iceberg table using BigQuery. Security policies are then enforced regardless of the query engine used — BigQuery natively enforces these policies at runtime, and open-source engines can securely access the data using the BigQuery Storage API. The BigQuery Storage API enforces the security policies at the data-plane layer, and is offered via pre-built connectors for Spark, Trino, Presto and TensorFlow. You can also use client libraries to build connectors for custom applications. 

New use cases with multi-cloud Iceberg lakehouse

The open nature of Apache Iceberg lets you build multi-cloud lakehouses with uniform management of data. With this launch, you can now create BigLake Iceberg tables on Amazon S3, and query them using BigQuery Omni. BigLake’s performance and fine-grained access control features seamlessly extend to multi-cloud Iceberg tables, so you can securely perform cross-cloud analytics with BigQuery. We’ll extend similar support to Azure data lake Gen 2 in the coming weeks. 

Apache Iceberg’s format uniformity across clouds also enables new data sharing use cases to help you share data with your customers, partners and suppliers, regardless of which cloud they are using. BigLake Iceberg tables on Cloud Storage or on Amazon S3 can be shared through Analytics Hub and consumed via BigQuery or OSS engines via BigQuery Storage Read API, providing an open sharing standard and the flexibility to use multiple query engines. A notable example of this is the recently announced Salesforce Data Cloud data sharing use case, which enables bi-directional cross-cloud data sharing between Salesforce and BigQuery and which is powered by Iceberg. 

Getting started

To create and query your first Iceberg table, following the documentation. or run a quick proof of concept on our analytics lakehouse with the Iceberg jump start solution

Source : Data Analytics Read More

A guide for understanding and optimizing your Dataflow costs

A guide for understanding and optimizing your Dataflow costs

Dataflow is the industry-leading platform that provides unified batch and streaming data processing capabilities, and supports a wide variety of analytics and machine learning use cases. It’s a fully managed service that comes with flexible development options (from Flex Templates and Notebooks to Apache Beam SDKs for Java, Python and Go), and a rich set of built-in management tools. It seamlessly integrates with not just Google Cloud products like Pub/Sub, BigQuery, Vertex AI, GCS, Spanner, and BigTable, but also third-party services like Kafka and AWS S3, to best meet your analytics and machine learning needs.

Dataflow’s adoption has ramped up in the past couple of years, and numerous customers now rely on Dataflow for everything from designing small proof of concepts, to large-scale production deployments. As customers are always trying to optimize their spend and do more with less, we naturally get questions related to cost optimization for Dataflow. 

In this post, we’ve put together a comprehensive list of actions you can take to help you understand and optimize your Dataflow costs and business outcomes, based on our real-world experiences and product knowledge. We’ll start by helping you understand your current and near-term costs. We’ll then share how you can continuously evaluate and optimize your Dataflow pipelines over time. Let’s dive in!

Understand your current and near-term costs

The first step in most cost optimization projects is to understand your current state. For Dataflow, this involves the ability to effectively: 

Understand Dataflow’s cost components

Predict the cost of potential jobs

Monitor the cost of submitted jobs

Understanding Dataflow’s cost components

Your Dataflow job will have direct and indirect costs. Direct costs reflect resources consumed by your job, while indirect costs are incurred by the broader analytics/machine learning solution that your Dataflow pipeline enables. Examples of indirect costs include usage of different APIs invoked from your pipeline, such as: 

BigQuery Storage Read and Write APIs

Cloud Storage APIs

BigQuery queries

Pub/Sub subscriptions and publishing, and

Network egress, if any

Direct and indirect costs influence the total cost of your Dataflow pipeline. Therefore, it’s important to develop an intuitive understanding of both components, and use that knowledge to adopt strategies and techniques that help you arrive at a truly optimized architecture and cost for your entire analytics or machine learning solution. For more information about Dataflow pricing, see the Dataflow pricing page.

Predict the cost of potential jobs

You can predict the cost of a potential Dataflow job by initially running the job on a small scale. Once the small job is successfully completed, you can use its results to extrapolate the resource consumption of your production pipeline. Plugging those estimates into the Google Cloud Pricing Calculator should give you the predicted cost of your production pipeline. For more details about predicting the cost of potential jobs, see this (old, but very applicable) blog post on predicting the cost of a Dataflow job.

Monitor the cost of submitted jobs

You can monitor the overall cost of your Dataflow jobs using a few simple tools that Dataflow provides out of the box. Also, as you optimize your existing pipelines, possibly using recommendations from this blog post, you can monitor the impact of your changes on performance, cost, or other aspects of your pipeline that you care about. Handy techniques for monitoring your Dataflow pipelines include:

Use metrics within the Dataflow UI to monitor key aspects of your pipeline.

For CPU intensive pipelines, profile the pipeline to gain insight into how CPU resources are being used throughout your pipeline. 

Experience real-time cost control by creating monitoring alerts on Dataflow job metrics which ship out of the box, and that can be good proxies for the cost of your job. These alerts send real-time notifications once the metrics associated with a running pipeline exceeds a predetermined threshold. We recommend that you only do this for your critical pipelines, so you can avoid notification fatigue. 

Enable Billing Export into BiqQuery, and perform deep, ad-hoc analyses of your Dataflow costs that help you understand not just the key drivers of your costs, but also how these drivers are trending over time. 

Create a labeling taxonomy, and add labels to your Dataflow jobs that help facilitate cost attribution during the ad-hoc analyses of your Dataflow cost data using BigQuery. Check out this blog post for some great examples of how to do this.

Run your Dataflow jobs using a custom Service Account. While this is great from a security perspective, it also has the added benefit of enabling the easy identification of APIs used by your Dataflow job.

Optimize your Dataflow costs

Once you have a good understanding of your Dataflow costs, the next step is to explore opportunities for optimization. Topics to be considered during this phase of your cost optimization journey include: 

Your optimization goals

Key factors driving the cost of your pipeline

Considerations for developing optimized batch and streaming pipelines

Let’s look at each of these topics in detail.

Goals

The goal of a cost optimization effort may seem obvious: “reduce my pipeline’s cost.” However, your business may have other priorities that have to be carefully considered and balanced with the cost reduction goal. From our conversations with customers, we have found that most Dataflow cost optimization programs have two main goals:

1. Reduce the pipeline’s cost

2. Continue meeting the service level agreements (SLAs) required by the business

Cost factors

Opportunities for optimizing the cost of your Dataflow pipeline will be based on the key factors driving your costs. While most of these factors will be identified through the process of understanding your current and near term costs, we have identified a set of frequently recurring cost factors, which we have grouped into three buckets: Dataflow configuration, performance, and business requirements.

Dataflow configuration includes factors like: 

Should your pipeline be streaming or batch? 

Are you using Dataflow services like Streaming Engine, or FlexRS

Are you using a suitable machine type and disk size?

Should your pipeline be using GPUs?

Do you have the right number of initial and maximum workers

Performance includes factors like: 

Are your SDK versions (Java, Python, Go) up to date

Are you using IO connectors efficiently? One of the strengths of Apache Beam is a large library of IO connectors to different storage and queueing systems. Apache Beam IO connectors are already optimized for maximum performance. However, there may be cases where there are trade-offs between cost and performance. For example, BigQueryIO supports several write methods, each of them with somewhat different performance and cost characteristics. For more details, see slides 19 – 22 of the Beam Summit session on cost optimization.

Are you using efficient coders? Coders affect the size of the data that needs to be saved to disk or transferred to a dedicated shuffle service in the intermediate pipeline stages, and some coders are more efficient than others. Metrics like total shuffle data processed and total streaming data processed can help you identify opportunities for using more efficient coders. As a general rule, you should consider whether the data that appears in your pipeline contains redundant data that can be eliminated by both filtering out unused columns as early as possible, and using efficient coders such as AvroCoder or RowCoder. Also, remember that if stages of your pipeline are fused, the coders in the intermediate steps become irrelevant. 

Do you have sufficient parallelism in your pipeline? The execution details tab, and metrics like processing parallelism keys can help you determine whether your pipeline code is taking full advantage of Apache Beam’s ability to do massively parallel processing (for more details, see parallelism). For example, if you have a transform which outputs a number of records for each input record (“high fan-out transform”) and the pipeline is automatically optimized using Dataflow fusion optimization, the parallelism of the pipeline can be suboptimal, and may benefit from preventing fusion. Another area to watch for is “hot keys.” This blog discusses this topic in great detail. 

Are your custom transforms efficient? Job monitoring techniques like profiling your pipeline and viewing relevant metrics can help you catch and correct your inefficient use of custom transforms. For example, if your Java transform needs to check if the data matches a certain regular expression pattern, then compiling that pattern in the setup method and doing the matching using the precompiled pattern in the “process element” method is much more efficient. The simpler, but inefficient alternative is to use the String.matches() call in the “process element” method, which will have to compile the pattern every time. Another consideration regarding custom transforms is that grouping elements for external service calls can help you prepare optimal request batches for external API calls. Finally, transforms that perform multi-step operations (for example, calls to external APIs that require extensive processes for creating and closing the client for the API) can often benefit from splitting these operations, and invoking them in different methods of the ParDo (for more details, see ParDo life cycle). 

Are you doing excessive logging? Logs are great. They help with debugging, and can significantly improve developer productivity. On the other hand, excessive logging can negatively impact your pipeline’s performance. 

Business requirements can also influence your pipeline’s design, and increase costs. Examples of such requirements include: 

Low end-to-end ingest latency

Extremely high throughput

Processing late arriving data

Processing streaming data spikes

Considerations for developing optimized data pipelines 

From our work with customers, we have compiled a set of guidelines that you can easily explore and implement to effectively optimize your Dataflow costs. Examples of these guidelines include: 

Batch and streaming pipelines: 

Consider keeping your Dataflow job in the same region as your IO source and destination services.

Consider using GPUs for specialized use cases like deep-learning inference.

Consider specialized machine types for memory- or compute-intensive workloads.

Consider setting the maximum number of workers for your Dataflow job.

Consider using custom containers to pre-install pipeline dependencies, and speed up worker startup time.

Where necessary, tune the memory of your worker VMs.

Reduce your number of test and staging pipelines, and remember to stop pipelines that you no longer need.

Batch pipelines:

Consider FlexRS for use cases that have start time and run time flexibility.

Run fewer pipelines on larger datasets. Starting and stopping a pipeline incurs some cost, and processing a very small dataset in a batch pipeline can be inefficient.

Consider defining the maximum duration for your jobs, so you can eliminate runaway jobs, which keep running without delivering value to your business.

Summary

In this post, we introduced you to a set of knowledge and techniques that can help you understand the current and near-term costs associated with your Dataflow pipelines. We also shared a series of considerations that can help you optimize your Dataflow pipelines, not just for today, but also as your business evolves over time. We shared lots of resources with you, and hope that you find them useful. We look forward to hearing about the savings and innovative solutions that you are able to deliver for your customers and your business.

Source : Data Analytics Read More

Top hacks from Cloud BI Hackathon 2022

Top hacks from Cloud BI Hackathon 2022

Last December, we, the Looker team, hosted our annual Cloud BI Hackathon for our developer community to collaborate, learn, and inspire each other. Nearly 300 participants from over 80 countries joined our 43 hour long virtual hackathon. Our participants hacked away with our developer features, data modeling, and data visualizations to create more than 30 applications, tools, and data experiences with Looker and Looker Studio. Let’s look at the winning projects and some great honorable mentions. In every case we were able to, we’ve added links to GitHub repositories to enable you to reproduce these hacks.

Best Hack winner

Data Studio Labs – “Google Sheets What-If” Community Connector by Harsha W. and Vindiw W.

The Best Hack winner enables your Looker Studio report to not only read from but write to a Google Sheet. You can create a sheet with various different calculations, change the sheet’s inputs from within your Looker Studio report, and immediately see the results. This creative Looker Studio Community Connector implementation empowers report viewers to perform What-If Analysis straight from within Looker Studio. Try out the connector and check out the GitHub repository for more details on how to use it.

Nearly Best Hack winners

Roast My Looker Instance by Josh T. and Dylan A.

This chatbot examines your Looker instance and snarkily reports on issues like abandoned dashboards, inactive users, and slow Explores. This hack is a fun way to use data fetched from the Looker API. Check out the GitHub repository for more details.

Bytecode Dashboard Version Masters by Michael C., Brent C., Rebecca T., and Michelle M.

This hack allows you to version control your dashboards with a convenient UI all within Looker. You can edit existing user-defined dashboards, keep a history of changes made, and revert the dashboard changes. This app uses the Looker extension framework and Looker’s Embed SDK, showing the technical possibilities when you combine multiple Looker developer features. Check out the GitHub repository for more details.

Honorable mentions

GoX.ai – Looker Studio Forecasting by Sakthi V., Paul E., and Aravinda S.

This custom-built visualization predicts values from its data source and enables forecasting directly in Looker Studio. Users can change the forecasting method and configure method parameters right from within Looker Studio’s report editor and visualize the forecasted results instantly. This hack demonstrates Looker Studio Community Visualization’s extensibility and flexibility. Check out the GitHub repository for more details.

Data Lineage and Metadata Search in Looker Studio by Luis P.

This Looker Studio report makes it easy for you to search for keywords in your entire SQL code and trace the lineage of your data as it feeds from one table into another. This hack creatively turns a static Looker Studio report into a troubleshooting tool for data developers.

Looker-loos by Grant S., Josh F, and Jeremy C.

This Looker dashboard defines a workflow to comprehensively view the health of your company with innovative custom filters that provide multiple period over period comparisons (like year over year or month over month), the measure, and the type of delta. This hack creatively uses complex LookML to enhance Looker dashboard’s functionality. Check out the GitHub repository for more details.

linked-dashboards by Markus B. and Ana N.

This hack provides a convenient UI that enhances navigation by grouping related dashboards in folders and synchronizes filters between the grouped dashboards. The hack is built with the Looker extensions framework and Looker Embed SDK, and serves as a useful tool for data analysts.

Wrap up

Since 2018, we have hosted our hackathon annually and we strive to improve each hackathon to create a safe space to collaborate, learn, and inspire each other. The event is not only a great opportunity for our developer community to learn about Looker and Looker Studio, but also for us to learn from our talented participants. For example, using our participants’ feedback, we are working on documentation and community outreach improvements to further enable our developer community. 

At Cloud BI Hackathon 2022, our developer community proved once again how talented, creative, and collaborative they are. We saw how our developer features like Looker Studio Community Visualizations, Looker’s Embed SDK, and Looker API enable our developer community to build powerful, useful — and sometimes entertaining — tools and data experiences. 

We hope these hackathon projects inspire you to build something fun and new. Check out our linked documentation throughout this post to get started. We’ll see you at the next hackathon later this year!

Source : Data Analytics Read More

Built with BigQuery: Quantum Metric unlocks data for frictionless customer experiences

Built with BigQuery: Quantum Metric unlocks data for frictionless customer experiences

In today’s fast-paced digital landscape, businesses are facing unprecedented challenges in meeting the evolving needs of their customers. COVID-19 accelerated the shift towards digital, with even non-digital companies now forced to adapt to the new reality. In such a market context, Quantum Metric has emerged as a leading player, helping companies navigate the complexities of digital transformation and improve their customer experience. The rise of e-commerce, the increasing importance of customer experience, and the growing demand for personalized services have turned this into a table stakes capability. 

Quantum Metric’s platform provides a comprehensive solution for enabling businesses to analyze and optimize their digital experiences across all channels. At the heart of Quantum Metric’s solution is BigQuery, Google’s fully managed, petabyte-scale analytics data warehouse with 99.99% availability that enables businesses to analyze vast amounts of data in real-time to make data-driven decisions and have actionable insights to drive better outcomes.

Use cases: Challenges and problems resolved

Use case 1: Retargeting

Sometimes someone lands on your website or mobile app but fails to accomplish what you want them to do, such as adding an item to their shopping cart or creating a new checking account. Frustrated customers don’t convert, open an account, or buy an airline ticket. They just leave.

Oftentimes, we don’t know why the error happened or what we can do to fix it. Wouldn’t it be great to reach out to a potential customer with a nice message to say, “Sorry, but we understand what happened and we want to make it right.”? How might customers feel if they received an email or chat prompt shortly after encountering a problem, so that they could speak with a representative? 

Together, Quantum Metric and BigQuery address this problem. With the Quantum Metric and BigQuery integration, you can investigate user behavior, including what exactly happens when a cohort of users (e.g. Android users) don’t convert.

For example, behavioral signals have helped a Retailer personalize retargeting messages for customers who struggled online or saw “out of stock” messages. The retailer’s Marketing Analytics team claimed they were getting more out of retargeting spend with deeper insights into what happened during a customer’s session.

Use case 2: Informing a customer data platform (CDP)

Customer data platforms (CDPs) can enable real-time decision making, which is one of the major benefits of big data analytics. Experience data adds a layer of activation, especially if it’s delivered in real time. 

Imagine you are an airline company optimizing the digital transformation journey. Most airlines offer loyalty status or programs, and this program is usually built in tandem with a CDP. This allows airlines to get a 360-degree view of the customer from multiple sources of data across different systems. When you combine customer data with experience data, you can better understand how important segments of your audience are navigating through your website and mobile app. 

For example, you can see when loyalty members are showing traits of frustration and deploy a rescue via chat, or even trigger a call from a special support agent. You can also send follow-up offers like promos to drive frustrated customers back to your website. The combined context of behavior data and customer loyalty status data allows you to be more pragmatic and effective with your resources. This means taking actions to maintain and strengthen your customer’s loyalty and drive conversion.

Use case 3: Personalization

The above CDP example is just the beginning of what you can achieve with the Quantum Metric and BigQuery integration. With a joined dataset, informed by real-time behavioral data, you can start to develop truly impactful personalization programs.

Imagine you are a large retailer that sells mostly commodities and need to perform well on Black Friday. With Quantum Metric and BigQuery, your business has real-time data on product engagement, such as clicks, taps, view time, frustration, and other statistics. When your business combines these insights with products available by region and competitive pricing data, you have a recipe for success when it comes to generating sales on Black Friday. 

With these data insights, retailers can create cohorts of users (age, device, loyalty status, purchase history, etc.) and these cohorts receive personalized product recommendations based on business, technical and behavior data. These recommendations will tend to perform better with consumers, since the product recommendations are in-stock and tailored to the customers’ needs.

Solution: Why Quantum Metric built on Google Cloud

Quantum Metric chose to partner with Google Cloud because of its world-class infrastructure, high reliability and scalability. This provides Quantum Metric with access to Google Cloud’s Data Analytics and AI/ML capabilities, allowing for advanced analysis and world-class data privacy. Quantum Metric’s solution also integrates with a variety of Google Cloud products, including Google Cloud’s Contact Center AI platform, to provide an end-to-end customer experience offering.

Quantum Metric’s platform is built and offered exclusively on Google Cloud, allowing for easy integration with BigQuery to unify and coalesce datasets, making it an ideal application to simplify and unlock secure data sharing.  For instance, Analytics Hub is a capability in addition to BigQuery that enables secure data sharing and assets across organizational boundaries.

The key features of the solution are: 

Data capture: With complete data capture of the customer experience, increase customer empathy across digital, IT, and support teams.

Intelligence layer: We process all that data through our ML engine, using Google’s Data Loss Prevention capability to ensure customer data is correctly classified. Creating automated segments and baselines that drive real-time anomaly detection. 

Analysis and visualization: Tools that span the needs of your teams, for example: alerting and monitoring of friction for product/IT ops to helping UX make design optimizations with journeys and heatmaps.

Pre-built industry guides are built on top of that data capture, intelligence, and visualization to automatically surface tailored insights, actions and use-cases categorized by sub-journey.

“Google BigQuery unlocked such vast power and scale that we realized we were limiting ourselves previously using a relational database. Google BigQuery differentiates our analytics products from the competition, because no matter what questions we ask or how much data we put in, we get results in seconds.” – Mario Ciabarra, Founder & CEO, Quantum Metric

Solution Architecture

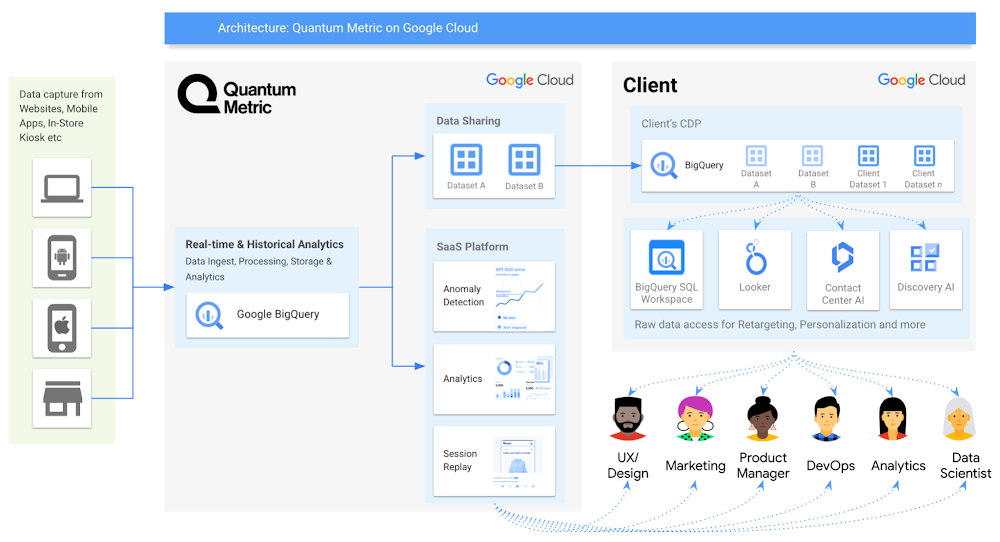
Below is an architecture diagram of how Quantum Metric operates on Google Cloud.

Data from various sources such as websites, mobile devices, kiosks are ingested into BigQuery using Google Cloud services. This data is in turn processed and analyzed for both real-time and historical analytics and stored in BigQuery datasets. Quantum Metric Platform provides out of the box dashboards to cater to multiple audiences ranging from Marketing, Product Managers to Analysts. In addition, the raw datasets can be shared securely with the client so they can query in their BigQuery instance or even coalesce with other datasets to develop more insights using Looker. 

Benefits & Outcomes

Some of the notable outcomes from the solution are around:

Product — Automatically alert on customer friction, size the revenue impact of issues, and gain immediate visibility into experiences like promotions or payments.

Analytics — Enable business stakeholders to self-serve insights. Understand the why behind friction, and measure the impact of releases without manual tagging.

Technology — Identify technical issues with out-of-the-box anomaly detection, gain real-time monitoring of the front end experience, and prioritize the backlog based on impact.

Optimizing the retail experience with advanced analytics

Canadian Tire Corporation uses Google Cloud and Quantum Metric to understand its digital engagement with its massive loyalty program and provide exceptional online and in-store customer experiences. Here are a few of their results:

Increases omnichannel sales by up to 15% through more tailored online and in-store experiences.

Democratizes access to insights about customer behavior to improve sales, merchandising, and marketing.

Reduces friction across the digital customer journey for better shopping experiences and brand loyalty.

Quantum Metric’s integration with BigQuery enables Canadian Tire to respond to customer needs, demands, and preferences faster and smarter. Canadian Tire also takes advantage of our unique ability to offer ungated access to all its data in Google BigQuery, as it merges data sets from Google Analytics, transactional information, and Quantum Metric itself.

Click here to learn more about Quantum Metric.

The Built with BigQuery advantage for ISVs and Data Providers

Google is helping companies like Quantum Metric build innovative applications on Google’s data cloud with simplified access to technology, helpful and dedicated engineering support, and joint go-to-market programs through the Built with BigQuery initiative. Participating companies can: 

Accelerate product design and architecture through access to designated experts who can provide insight into key use cases, architectural patterns, and best practices. 

Amplify success with joint marketing programs to drive awareness, generate demand, and increase adoption.

BigQuery gives ISVs the advantage of a powerful, highly scalable data warehouse that’s integrated with Google Cloud’s open, secure, sustainable platform. And with a huge partner ecosystem and support for multi-cloud, open source tools and APIs, Google provides technology companies the portability and extensibility they need to avoid data lock-in.

Click here to learn more about Built with BigQuery.

We thank the Quantum Metric and Google Cloud team members who collaborated on the blog:
Quantum Metric: Kayla Kirkby, VP of Partner Marketing, Mario Ciabarra (CEO)
Google: Tom Cannon, Head of Built with BigQuery

Related Article

Built with BigQuery: Lytics launches secure data sharing and enrichment solution on Google Cloud

Lytics leverages Google BigQuery to offer data infrastructure as a service, and Google Cloud AI/ML stack to identify and create unique au…

Read Article

Source : Data Analytics Read More

Optimize your cloud by exporting Active Assist recommendations to a BigQuery dataset

Optimize your cloud by exporting Active Assist recommendations to a BigQuery dataset

Active Assist provides insights and recommendations to help Google Cloud customers proactively optimize their cloud environments for cost, security, performance, and sustainability. If you’re like most customers, you’ve likely encountered these insights and recommendations in the console — either in the Recommendations Hub or embedded on a resource page, like IAM or the VM list pages. (Note that for the rest of this post, we’ll use the word “recommendations” to mean “insights and recommendations.”)

We heard from customers who love recommendations that it should be easier to discover and work with these valuable suggestions across an entire organization, so last year we launched the Recommendations BigQuery export feature to Preview. This allows you to automatically export the recommendations to a BigQuery dataset, which you can then investigate with tools like DataStudio or Looker, and integrate with your company’s existing monitoring solutions and workflows. 

Many of you have told us how powerful this feature is, so we’ve been working hard on improvements to make it even more useful. We’re happy to announce that BQ Export 1.0 is now in GA, and that BQ Export 2.0 is in Preview, with new support for Billing Account-level recommendations and cost optimization recommendations that include discount information. This post will cover what’s new with Active Assist BQ Export, as well as a couple other new features of Active Assist.

New features to Active Assist BigQuery Export

Before we dive into the details, if you’re new to Recommendations BQ Export check out our handy getting started guide. It covers the permissions you’ll need and how to set up the export, including instructions for using a service account. It also includes some sample queries and instructions for interacting with the data using Google Sheets. You may also want to check out our prior blog post showing how to optimize your cloud spend with BigQuery and Looker.   

Now, on to what’s new!

1. Non-project scoped recommendations
You can now see non-project scoped recommendations, such as billing account, organization, and folder-level recommendations in your export to BigQuery. This ensures that in your export, you are able to see the full portfolio of recommendations that are available to you. 

2. Custom contract Pricing 
If you have any applicable custom contract pricing for your company, your cost-related recommendations now take those into account (based on your historical costs) in the cost saving calculation when you export them to BigQuery. This will ensure that you have the most accurate cost savings data we have for you and your organization to help you make the best judgment and prioritization when choosing to adopt recommendations. However, you must have the correct permissions first in order to see the custom contract pricing. If the user executing the export to BigQuery does not have the correct permissions, you may continue to see list pricing in your estimated savings. Also, note that the console UI and the Recommender API already have this support.

3. Export now available globally
Customers outside of the US can now set up an export of recommendations to a BigQuery dataset. 

Improvements to Active Assist discoverability and usability

1. Global Recommender Viewer role: You can now add the global Recommender Viewer role, which gives you view access to all insights and recommendations available to you, simplifying permission management for new recommenders. Newly launched recommendations will also automatically be added as they become generally available.  

2. Dismiss recommendations via Recommender API: You can now directly dismiss recommendations via our API, allowing you to focus on the recommendations you care about and work more efficiently. 

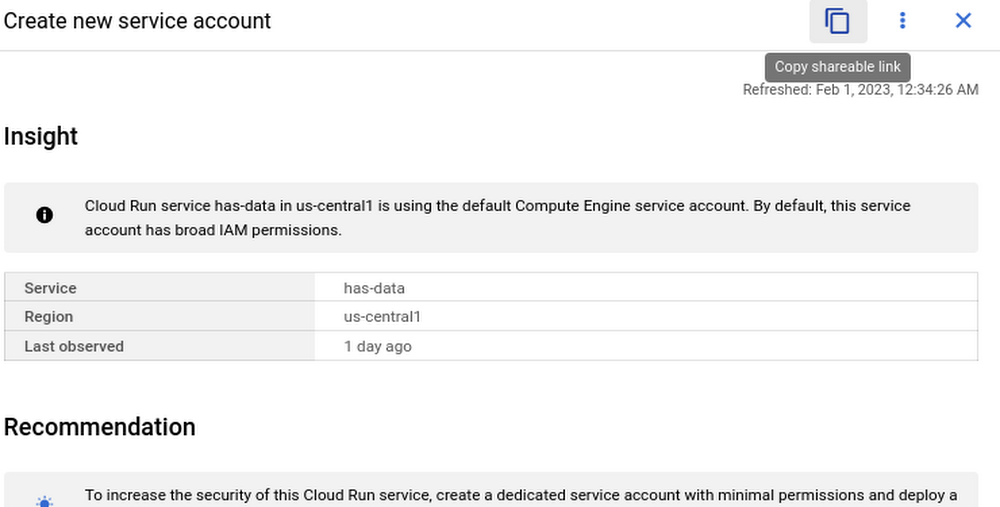
3. Shareable links: Another feature that quietly launched recently is the availability of shareable URLs that link to recommendation details in the console. You can access these links in the UI from the upper right of the details panel of any recommendation.

However, these links become even more powerful when combined with Recommendations BigQuery Export. The URLs all have a standard format. This means that within the BigQuery export tables you can easily calculate a new column containing these links using an expression like:

code_block[StructValue([(u’code’, u’u201chttps://console.cloud.google.com/home/recommendations/view-link/u201d + rnname +rnu201c?project=u201d + rncloud_entity_id’), (u’language’, u”), (u’caption’, <wagtail.wagtailcore.rich_text.RichText object at 0x3ec5ae61b290>)])]

This example is for project level recommendations (where cloud_entity_type = PROJECT_NUMBER). 

For cloud_entity_type = FOLDER, use:

code_block[StructValue([(u’code’, u’u201chttps://console.cloud.google.com/home/recommendations/view-link/u201d + rnname +rnu201c?folder=u201d + rncloud_entity_id’), (u’language’, u”), (u’caption’, <wagtail.wagtailcore.rich_text.RichText object at 0x3ec5b735ba50>)])]

For cloud_entity_type = ORGANIZATION, use:

code_block[StructValue([(u’code’, u’u201chttps://console.cloud.google.com/home/recommendations/view-link/u201d + rnname +rnu201c?organizationId=u201d + rncloud_entity_id’), (u’language’, u”), (u’caption’, <wagtail.wagtailcore.rich_text.RichText object at 0x3ec5b5ff1d10>)])]

These links can then be embedded in your reports and dashboards, or used by other BigQuery clients. 

As a reminder, if you’re interested in setting up reports or dashboards using Recommendations BigQuery Export, take a look at this previous blog post for some great ideas, or you can reference our getting started guide. If you have any feedback, please feel free to reach out to active-assist-feedback@google.com.

Related Article

Optimizing your Google Cloud spend with BigQuery and Looker

Learn how you can export billing data into BigQuery and leverage pre-built dashboards, plus self-service data exploration environments to…

Read Article

Source : Data Analytics Read More

Statsig unlocks new features by migrating Spark to BigQuery

Statsig unlocks new features by migrating Spark to BigQuery

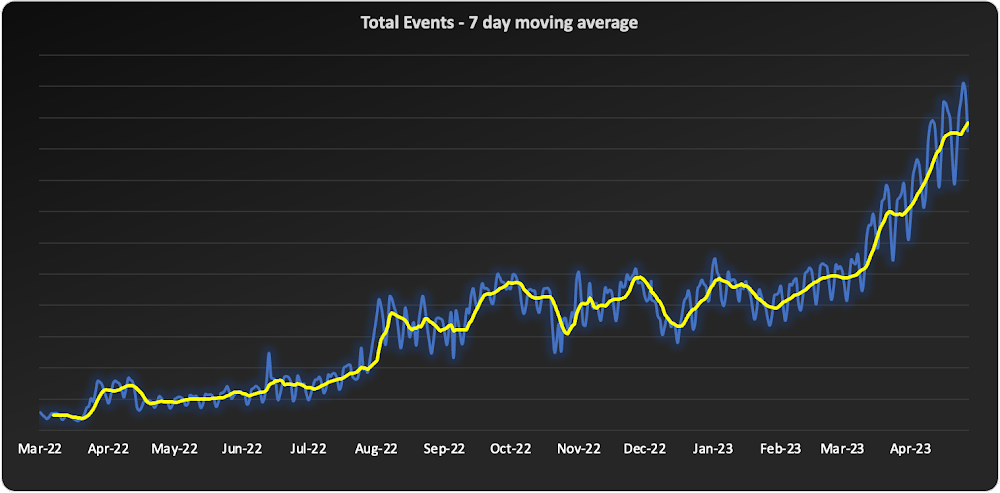
Statsig is a modern feature management and experimentation platform used by hundreds of organizations. Statsig’s end-to-end product analytics platform simplifies and accelerates experimentation with integrated feature gates (flags), custom metrics, real-time analytics tools, and more, enabling data-driven decision-making and confident feature releases. Companies send their real-time event-stream data to Statsig’s data platform, which, on average, adds up to over 30B events a day and has been growing at 30-40% month over month. 

With these fast-growing event volumes, our Spark-based data processing regularly ran into performance issues, pipeline bottlenecks, and storage limits. In turn, this rapid data growth negatively impacted the team’s ability to deliver product insights on time. The sustained Spark tuning efforts that we were dealing with made it challenging to keep up with our feature backlog. Instead of spending time building new features for our customers, our engineering team was controlling significant increases in Spark’s runtime and cloud costs. 

Adopting BigQuery pulled us out of Spark’s recurring spiral of re-architecture and into a Data Cloud, enabling us to focus on our customers and develop new features to help them run scalable experimentation programs.

The growing data dilemma

At Statsig, our processing volumes were growing rapidly. The assumptions and optimizations we madea month ago would become irrelevant the next month. While our team was knowledgeable in Spark performance tuning, the benefits of each change were short lived and became obsolete almost as quickly as it was implemented. As the months passed, our data teams were dedicating moretime to optimizing and tuning Spark clusters instead of building new data products and features. We knew we needed to change our data cloud strategy.

Statsig’s growing processing volumes over the past year

We started to source advice from companies and startups who had faced similar data scaling challenges – the resounding recommendation was “Go with BigQuery.” Initially, our team was reluctant. For us, a BigQuery migration would require an entirely new data warehouse and a cross-cloud migration to GCP.

However, during a company-wide hackathon, a pair of engineers decided to test BigQuery with our most resource-intensive job. Shockingly, this unoptimized job finished much faster and at a lower cost than our current finely-tuned setup. This outcome made it impossible for us to ignore a BigQuery migration any longer. We set out to learn more. 

Investigating BigQuery

When we started our BigQuery journey, the first and obvious thing we had to understand was how to actually run jobs. With Spark, we were accustomed to daunting configurations, mapping concepts like executors back to virtual machines, and creating orchestration pipelines for all the tracking and variations required. 

When we approached running jobs on BigQuery, we were surprised to learn that we only needed to configure the number of slots allocated to the project. Suddenly, with BigQuery, there were no longer hundreds of settings affecting query performance. Even before running our first migration test, BigQuery had already eliminated an expensive and tedious task list of optimizations our team would typically need to complete.

Digging into BigQuery, we learned about additional serverless optimizations that BigQuery offered out of the box that addressed many of the issues we had with Spark. For example, we often had a single task get stuck with Spark because virtual machines would be lost or the right VM shape needed to be attainable. With BigQuery’s autoscaling, SQL jobs are much more granularly defined and can move resources as needed between multiple jobs. As another example, we sometimes encountered a storage issue with Spark due to the shuffled data overwhelming a machine’s disk. On BigQuery, there is aseparate in-memory shuffle service that eliminates the need for our team to worry about predicting and sizing shuffle disk sizes. 

At this point, it was clear that the migration away from the DevOps of Spark and into the serverless BigQuery architecture would be worth the effort. 

Spark to BigQuery migration 

When migrating our pipelines over, we ran into situations where we had to rewrite large blocks of code, making it easy to introduce new bugs. We needed a way to simultaneously stage this migration without committing to huge rewrites . Dataproc is a very useful tool for this purpose. Dataproc provides us with a simple yet flexible API to spin up Spark clusters and gives us access to the full swath of configurations and optimizations that we’re accustomed to from our previous Spark deployments.

Additionally, BigQuery offers a direct Spark integration through stored procedures with Apache Spark, which provides a fully managed and serverless Spark experience native to BigQuery and allows you to call Spark code directly from BigQuery SQL. It can be configured as part of the BigQuery autoscaler and called from any orchestration tool that can execute SQL, such as dbt. 

This ability to mix and match BigQuery SQL and multiple options for Spark gave us the flexibility to move to BigQuery immediately but roll out the entire migration on our timeline.

With BigQuery, we’re back to building features 

With BigQuery, we could to tap into performance improvements, direct cost savings, and experienced a reduction in our data pipeline error rates. However, BigQuery really changed our business by unlocking new real-time features that we didn’t have before. A couple of examples are:

1. Fresh, fast data results

On our Spark cluster, we needed to pre-compute tens of thousands of possible results each day if a customer wanted to look at a specific detail. While only a small percentage of results would get viewed each day, we couldn’t predict which results would be needed, so we had to pre-compute it all. With BigQuery, the queries run much faster, so we now compute specific results when customers need them. We benefit from avoiding expensive jobs. To our customers, this translates into fresher data.

2. Real-time decision features

Since our migration to BigQuery began, we have rolled out several new features powered by BigQuery’s ability to compute things in near real-time, enhancing our customers’ ability to make real-time decisions.

1) A metrics explorer that lets our customers query their metric data in real-time.

2) A deep dive experience that lets our customers instantly dig into a specific user’s details instead of waiting on a 15-minute Spark job to process. 

3) A warehouse-native solution that lets our customers use their own BigQuery project to run analysis. 

Migrating from Spark to BigQuery has simplified many of our workflows and saved us significant money. But equally importantly, it has made it easier to work with massive data, reduced the strain on our perpetually stretched-thin data team, and allowed us to build awesome products faster for our customers.

Getting started with BigQuery

There are a few ways to get started with BigQuery. New customers get $300 in free credits to spend on BigQuery. All customers get 10GB storage and up to 1TB queries free per month, not charged against their credits. You can get these credits by signing up for the BigQuery free trial. Not ready yet? You can use the BigQuery sandbox without a credit card to see how it works. 

The Built with BigQuery advantage for ISVs 

Google is helping tech companies like Statsig build innovative applications on Google’s data cloud with simplified access to technology, helpful and dedicated engineering support, and joint go-to-market programs through the Built with BigQuery initiative. 

More on Statsig

Companies want to understand the impact of their new features on the business, test different options, and identify optimal configurations that balance customer success with business impact. But running these experiments is hard. Simple mistakes can cause you to make wrong decisions, and lack of standardization can make results hard to compare, and reduce user trust. When implemented poorly, an experimentation program can become a bottleneck, causing feature releases to slow down or, in some cases, causing teams to skip experimentation altogether. Statsig provides an end-to-end product experimentation and analytics platform that makes it simple for companies to leverage best-in-class experimentation tooling.

If you’re looking to improve your company’s experimentation process, visitstatsig.com and explore what our platform can offer. We have a generous free tier and a community of experts on Slack to help ensure your efforts are successful. Boost your business’s growth with Statsig and unlock the full potential of your data.

Source : Data Analytics Read More

Discover the benefits of cross-cloud geospatial analytics with BigQuery Omni

Discover the benefits of cross-cloud geospatial analytics with BigQuery Omni

As we become increasingly reliant on technology to make decisions, geospatial data is becoming more critical than ever. It is a powerful resource that can be used to solve a variety of problems, from tracking the movement of goods, identifying interest areas and potential areas of disaster.

Geospatial data incorporates data with a geographic component, such as latitude and longitude coordinates, addresses, postal codes, or place names, and can be obtained from a variety of sources, including satellites, sensors, and surveys, making it an incredibly powerful tool with a broad range of applications.

One of the key features of BigQuery, Google Cloud’s serverless enterprise data warehouse, is its ability to analyze geospatial data. However, oftentimes geospatial data sits in a variety of public clouds, not just Google Cloud. To access it effectively, you need a multi-cloud analytics solution that lets you capitalize on the distinct capabilities of each cloud platform, while extracting insights and value from data sitting across multiple cloud platforms.

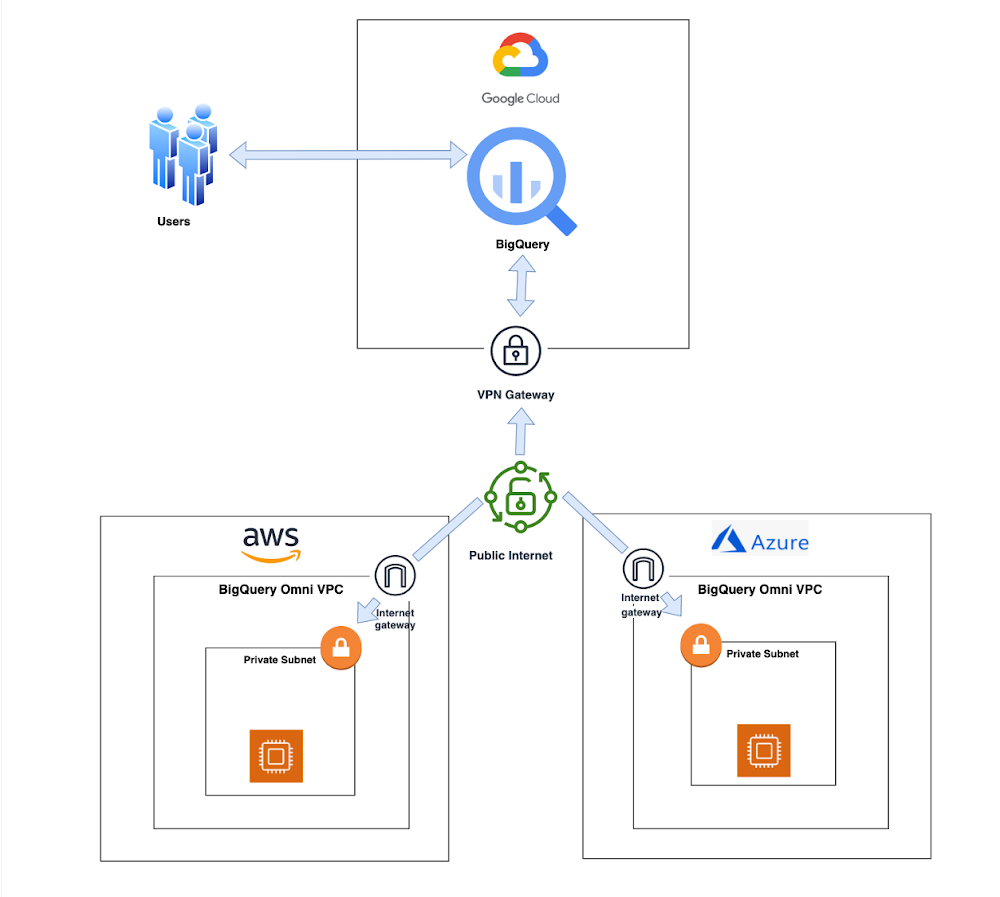
BigQuery Omni is a multi-cloud analytics solution that enables the analysis of data stored across public cloud environments, including Google Cloud, Amazon Web Services (AWS) and Microsoft Azure, without the need to transfer the data. With BigQuery Omni, users can employ the same SQL queries and tools used to analyze data in Google Cloud to analyze data in other clouds, making it easier to gain insights from all data, regardless of the storage location. For businesses using multiple clouds, BigQuery Omni is an excellent tool to unify analytics and optimize the value of data.

BigQuery Omni Architecture

With BigQuery Omni, organizations can analyze location-based information or geographic components, such as latitude and longitude coordinates, addresses, postal codes, or place names without even copying their data to Google Cloud. For example, you could use BigQuery Omni to analyze data from a fleet of delivery vehicles to track their location and identify potential problems.

BigQuery Omni and geospatial data analysis

If you are working with geospatial data, BigQuery Omni is a powerful tool that can help you to get insights from your data. It is scalable, reliable, and secure, making it a great option for unifying your analytics and getting the most out of your data. 

Here are a few examples of ways organizations might use BigQuery Omni for geospatial data:

A transportation company could use BigQuery Omni to analyze data from GPS sensors in its vehicles to track the movement of its fleet and identify potential problems.

A retail company could use BigQuery Omni to analyze data from its point-of-sale systems to track customer behavior and identify trends.

A government agency could use BigQuery Omni to analyze data from its weather sensors to track the movement of storms and identify areas at risk of flooding.

BigQuery Omni and geospatial data can be used together to gain insights into a variety of business problems. Specifically, some of the advantages of using BigQuery Omni and geospatial data include:

Access to quality geospatial data: BigQuery supports loading of newline-delimited GeoJSON files and provides built-in support for loading and querying geospatial data. Data from public data sources like BigQuery public datasets, the Earth Engine catalog, and the United States Geological Survey (USGS) can be easily integrated into your BigQuery environment. Earth Engine has an integrated data catalog with a comprehensive collection of analysis-ready datasets, including satellite imagery and climate data. This data can be combined with proprietary data sources such as SAP, Oracle, Esri ArcGIS Server, Carto, and QGIS.

Loading and preprocessing of geospatial data: BigQuery has built-in support for loading and querying geospatial data types, and you can use partner solutions such as FME Spatial ETL to load data.

Working with different geospatial data types and formats: BigQuery supports a variety of file types and formats including WKT, WKB, CSV and GeoJSON.

Coordinate reference systems: BigQuery’s geography data type is globally consistent. That means that your data is registered to the WGS84 reference system and your analyses can span a city block or multiple continents.

Overall, geospatial analytics with BigQuery Omni provides a wide range of technical capabilities for processing and analyzing geospatial data, making it a powerful tool for businesses that need to work with location-based data.

Analyzing geospatial data with BigQuery Omni

Imagine a retailer who has a large chain of department stores with locations all over the country. They are looking to expand their business and want to identify areas with high sales potential. They want a way to get a better understanding of their sales volume within specific geographic boundaries. To achieve this goal, the retailer turns to the GIS (Geographic Information System) functions built into BigQuery. Here are the steps what the retailer takes to analyze this dataset:

Step 1 : An initial orders dataset on AWS S3 contains 5.54 million rows, and with separate locations (300 rows) and zipcode (33144 rows) metadata files on AWS S3.

Orders Parquet files:

Location and Zipcode files:

Step  2 : The retailer uses BigQuery Omni to establish a connection between the data stored in AWS and BigQuery, enabling them to access the S3 datasets externally.

External Connection for AWS

External Table for orders

External Table for locations

External Table for zipcode

Step 3 : They combine the orders and locations datasets using BigQuery Omni, and remotely aggregate the data on AWS. Joining this dataset with geospatial datasets helps them derive geospatial coordinates.

The final aggregated dataset is reduced to 23 rows. Subsequently, they bring back the result dataset, which contains just 23 rows. This helps them reduce the extraction of millions of rows to just 23 rows for their geospatial analytics.

code_block[StructValue([(u’code’, u’Select sales.store_city store_city,rnsales.number_of_sales_last_10_mins number_of_sales_last_10_mins,rnsales.store_zip store_zip,rn ST_GeogPoint(zip_lat_lng.longitude ,rn zip_lat_lng.latitude ) geornFROM (rn SELECTrn FORMAT_DATETIME(“%X”,rn CURRENT_DATETIME(“America/Los_Angeles”)) current_time,rn MAX(DATETIME(time_of_sale,rn “America/Los_Angeles”)) time_of_last_sale,rn COUNT(1) number_of_sales_last_10_mins,rn locations.city store_city,rn locations.zip store_ziprn FROMrn `bqomni-blog.aws_locations.orders_small` salesrn JOINrn `bqomni-blog.aws_locations.locations` locationsrn ONrn sales.store_id = locations.idrn GROUP BYrn locations.city,rn locations.zip ) salesrnJOINrn `bqomni-blog.aws_locations.zipcode` zip_lat_lngrnONrn cast(sales.store_zip as INT) = cast(zip_lat_lng.zipcode as INT)rn WHERE ST_WITHIN( ST_GeogPoint(zip_lat_lng.longitude , zip_lat_lng.latitude ) ,ST_GeogFromText(zip_lat_lng.zipcode_geom ) )rn AND zip_lat_lng.state_name = “New York”rn ORDER BY number_of_sales_last_10_mins’), (u’language’, u”), (u’caption’, <wagtail.wagtailcore.rich_text.RichText object at 0x3e4353b86290>)])]

Aggregated Sales data by region

To build richer views of their sales volume data, the retailer uses BigQuery GeoViz integration, a powerful tool that allows for visualizing geographic data on maps.BigQuery Geo Viz is a web tool for visualization of geospatial data in BigQuery using Google Maps APIs. You can run a SQL query and display the results on an interactive map

BigQuery Geo view for sales data analysis

With the geo-tagged data in place, the retailer can now see regional sales volume, sales density, distribution by department by time, and distribution within department, all powered through BigQuery.

Satellite view

Benefits of using BigQuery Omni 

Beyond geospatial analysis, BigQuery Omni offers a number of benefits, including:

Reduced costs: BigQuery Omni’s ability to eliminate data transfers between clouds can help organizations reduce costs and simplify data management, making it a valuable tool for multi-cloud analytics. Also, the ability to access and analyze data across multiple clouds can reduce the need for data replication and synchronization, which can further simplify the ETL process and improve data consistency.

Unified governance: BigQuery Omni uses the same security controls as BigQuery, which include features such as encryption, access controls, and audit logs, to help protect data from unauthorized access.

Single pane for analytics: BigQuery Omni provides a single interface for querying data across all three clouds, which can simplify the process of analyzing data and reduce the need for organizations to use multiple analytics tools.

Flexibility: Analyze data stored in any of the supported cloud storage services, giving organizations the flexibility to work with the data they have regardless of where it’s located.

BigQuery Omni is a valuable tool for geospatial analysis because it allows you to analyze data from multiple sources without having to move the data. This can save you time and money, and it can also help you to get more accurate insights from your data.If you are looking for a way to improve the accuracy, efficiency, and decision-making of your business, using BigQuery Omni to analyze geospatial data can be a powerful tool.

References

Omni-introduction Omni-benefits Omni-aws-create-connectionOmni-azure-create-connection BigQuery Omni Retail Demo on LookerOmni-pricing Working with Geospatial DataGeospatial Analytics – Intro

Learn more about how BigQuery Omni can help your organization.

Source : Data Analytics Read More
Improve query performance and optimize costs in BigQuery using the anti-pattern recognition tool

Improve query performance and optimize costs in BigQuery using the anti-pattern recognition tool

BigQuery is a serverless and cost-effective enterprise data warehouse that works across cloud environments and scales with your data. As with any large scale data-intensive platform, following best practices and avoiding inefficient anti-patterns goes a long way in terms of performance and cost savings. 

Usually SQL optimization requires a significant time investment from engineers, who must read high-complexity queries, devise a variety of approaches to improve performance and efficiency, and test several optimization techniques. The best place to start is to fix anti-patterns, since this only requires easily applicable changes and provides significant performance improvements.

To facilitate the task of identifying and fixing said anti-pattern, Google Professional Services Organization (PSO) and Global Services Delivery (GSD) have developed a BigQuery anti-pattern recognition tool. This tool automates the process of scanning SQL queries, identifying antipatterns, and providing optimization recommendations.

What is the BigQuery anti-pattern recognition tool?

The BigQuery anti-pattern recognition tool let you easily identify performance impacting anti-patterns across a large number of SQL queries in a single go. 

It utilizes ZetaSQL to parse BigQuery SQL queries into abstract syntax trees (AST) and then traverses the tree nodes to detect the presence of anti-patterns. 

The tool takes a BigQuery SQL query as an input, such as:

code_block[StructValue([(u’code’, u’SELECTrn t.dim1,rn t.metric1rnFROMrn `dataset.table` trnWHERErn t.id NOT IN (rn SELECTrn idrn FROMrn `dataset.table2`)’), (u’language’, u”), (u’caption’, <wagtail.wagtailcore.rich_text.RichText object at 0x3e0b4f389190>)])]

And produces the output as:

code_block[StructValue([(u’code’, u’Subquery in filter without aggregation at line 8.’), (u’language’, u”), (u’caption’, <wagtail.wagtailcore.rich_text.RichText object at 0x3e0b58df6f50>)])]

It examines potential optimizations, including:

Selecting only the necessary columns

Handling multiple WITH-clause references 

Addressing subqueries in filters with aggregations

Optimizing ORDER BY queries with LIMIT

Enhancing string comparisons

Improving JOIN patterns

Avoiding subquery aggregation in the WHERE clause

The solution supports reading from various sources, such as:

Command line 

Local files

Cloud Storage files

Local folders

Cloud Storage folders

CSV (with one query per line)

INFORMATION_SCHEMA

Additionally, the solution provides flexibility in writing output to different destinations, including:

Printing to the terminal

Exporting as CSV

Writing to a BigQuery table

Using the BigQuery anti-pattern recognition tool

The BigQuery anti-pattern recognition tool is hosted on GitHub. Below are the Quick Start steps on using the tool via command line for inline queries. You can also leverage Cloud Run to deploy it as a container on cloud. 

Prerequisites

Linux OS

JDK 11 or above is installed

Maven

Docker

gcloud CLI

Quick start: – steps

1. Clone the repo into your local machine.

code_block[StructValue([(u’code’, u’git clone git@github.com:GoogleCloudPlatform/bigquery-antipattern-recognition.git’), (u’language’, u”), (u’caption’, <wagtail.wagtailcore.rich_text.RichText object at 0x3e0b58df6cd0>)])]

2. Build the tool image inside the `bigquery-antipattern-recognition` folder.

code_block[StructValue([(u’code’, u’mvn clean package jib:dockerBuild -DskipTests’), (u’language’, u”), (u’caption’, <wagtail.wagtailcore.rich_text.RichText object at 0x3e0b58df63d0>)])]

3. Run the tool for a simple inline query.

code_block[StructValue([(u’code’, u’docker run \rn -i bigquery-antipattern-recognition \rn –query “SELECT * FROM \`project.dataset.table1\`”‘), (u’language’, u”), (u’caption’, <wagtail.wagtailcore.rich_text.RichText object at 0x3e0b4f33ad50>)])]

4. Below is the output result in the command-line interface:

Additionally, the above tool can read queries from Information Schema and load the output recommendations to a BigQuery table.

Below is an example of the BigQuery anti-pattern recognition tool results exported to a BigQuery table.

Getting started

Ready to start optimizing your BigQuery queries and cutting costs? Check out the tool here and contribute to the tool via GitHub.

Have questions or feedback?

We’re actively working on new features to make the tool as useful to our customers. Use it and tell us what you think! For product feedback/technical questions, reach out to us at bq-antipattern-eng@google.com. If you’re already a BigQuery customer and would like a briefing on the tool, please reach out, we’d be happy to talk.

Source : Data Analytics Read More