Consumers today want retailers they do dealings with, to provide them with simplified and personalized services. If you fail to meet their standards for an effective and focused product offering, most of them will quickly take their money elsewhere.
According to many surveys, more than 90% of retail organizations across a wide range of sectors feel location data is crucial to their success.
In fact, the popularity of location data has grown so much that it is expected to touch about $35 billion in value by 2027.
In this article, we will talk about nine ways location data can help you excel in retail.
9 Ways Location Data Can Help You Excel in Retail
Retailers can utilize data analysis to uncover trends in consumer behavior in order to make wiser decisions about product development, price, customer engagement, and so on.
From the most basic to the most complicated concerns, data may assist guide your decision-making strategy.
You may go beyond mere purchase behavior by incorporating social media activity into marketing techniques specific to your key demographics.
As the current business world has changed rapidly owing to technology and other advancements, the most agile merchants have thrived and even prospered, typically by employing data-driven tactics.
Enhance the client experienceBetter Understand Customer DemographicsForecast customer behaviorImprove pricing decisionsHighlights Expansion PotentialImprove product display in-storeReduce customer acquisition expensesImprove the online customer experienceCustomer persona identification
Here it goes.
1. Enhance the client experience
Data analysis is critical for designing experiences that meet today’s consumers’ desire for personalization. Retailers of all sizes may benefit from current analytics systems’ capacity to take enormous volumes of data and provide relevant insights.
This information may be used to match a customer’s interests to the interaction your brand provides.
This application can take the shape of developing items, adapting marketing strategies, or generating recommendations based on the products that a consumer is most interested in.
Accurate client data collection and analysis are critical to maximizing all of these activities.
2. Better Understand Customer Demographics
A marketplace, or the geographic region from which a retailer acquires its clients, is crucial to the longevity of a retail shop establishment. So, your retail personnel must make sure that you open stores in locations where your target consumers reside or visit regularly.
Using retail site selection mapping software to gain better insights into your client base will allow you to give more appropriate services and goods. Such software provides you with real-time data and behavioral insights about the people who live and travel near specific retail locations.
You will learn much more about the demographic trends of your intended market’s clients. Additionally, you can also examine where customers like to purchase or visit in their leisure time.
This will immediately improve your leads. It will also help you to better plan your marketing and spend more in specific age brackets because everybody in that region would pick your store first.
3. Forecast customer behavior
Consumer data gives you a glimpse into future customer behavior by allowing you to examine it for trends. This may include purchase history, customer habits, and other crucial data points.
This method entails examining patterns and connections uncovered when recording client interactions with your company at various touchpoints.
You may anticipate future behavior by analyzing this data to establish the major elements driving client purchase decisions, and then utilize these predictions to steer your branding and marketing development efforts..
4. Improve pricing decisions
Given how easy it is for people to price shop on the internet these days, merchants want as much info as feasible when formulating pricing determinations.
Making these judgments entails doing more than just evaluating your internal cost/profit assessment. It also involves engaging in competitor intelligence gathering to design a pricing strategy that is most likely to succeed given market circumstances.
Pricing information may also assist you in determining when giving discounts or other promotions is most likely to help you sell things.
5. Highlights expansion potential
Retail location data also aids in the finding of ideal sites by evaluating what interests them and their profit potential. As a consequence, it is an essential instrument for doing market research and conducting extensive competition analysis.
It is also vital to discover external elements that influence the success of your present and anticipated enterprises. Intelligent mapping allows corporate executives to see how certain regions are evolving, helping them to have a competitive edge in a variety of sectors.
6. Improve product display in-store
Product placement in-store is critical for increasing retail sales.
Products that are likely to be purchased on impulse, for example, are often positioned closest to the checkout register to optimize their sales potential.
By observing how different techniques function in real-time, data analysis may assist support diverse product placement methods.
7. Reduce customer acquisition expenses
Data analytics allow you to see which of your web marketing initiatives are working and which aren’t. Rather than waiting days or weeks, as with conventional marketing initiatives, digital marketing gives real-time or near-real-time information that may be used to enhance your marketing efforts.
Reduce client acquisition expenses by eliminating low-performing portions of your ads and accentuating top-performing features.
Campaign data analytics also aids in the scalability of paid advertising campaigns, allowing you to increase traffic to the sites and advertisements with the highest conversion rates.
This tailored method outperforms allocating advertising expenditures over a variety of channels without analyzing each channel’s performance in terms of ROI and client acquisition cost.
Analyzing your marketing and website data allows you to avoid wasting money on strategies that don’t provide a favorable ROI. By reducing the speculation associated with marketing, expenditures that might otherwise be squandered may be allocated to channels that have been demonstrated to be fruitful.
Any channel activity that does not eventually lead to sales and revenue should be eliminated in web marketing.
8. Improve the online customer experience
When customers visit your website, they generate data points that may be mined for important insights about what works and what doesn’t on your site.
Statistics such as average time on page, bounce rate, conversion rate, and others may be used to perfect your website and make changes to make it more appealing to visitors.
The longer people stay on your site, the more likely they are to convert, and the higher your conversion rate.
9. Better identify customer persona
Client data may be used to segment your customer base based on demographics and other factors, allowing you to better understand who and where your consumers are.
You may create an ideal customer persona by assembling the attributes of your top customers and using them in product development and marketing efforts.
Given digital marketing’s capacity to accurately target certain groups of individuals, having a good grasp of your model client persona is critical for improving your marketing initiatives.
Location Data is Helping Retailers Improve their Competitive Edge
That’s all for this article. Hopefully, after reading it, you are compelled to use location data for your retail business too. Remember, customers these days are looking for personalization and wouldn’t mind taking their business elsewhere if you fail to meet their needs.
Retailers who want to prosper in the future months and even years can’t risk making choices without using data. Agreed, establishing the correct processes and understanding how to gather intelligence may take some effort, but the information and insights you obtain will make it all rewarding.
How are you utilizing retail insights in your company? Tell us in the comments.
Author – Tuba Sarosh
Tuba Sarosh is a versatile copy and content writer and editor, who helps businesses turn their readers into clients. She writes about trends, tips, how-tos, and other cool stuff that helps businesses serve their customers better. When not writing, she’s either reading a good book or experimenting with recipes.
Artificial intelligence is gaining traction in different sectors, including customer service. Call centers alone spent over $3.4 billion on AI in 2019, but the market for AI in customer service sector as a whole is much greater.
AI technology offers an opportunity for businesses to enhance their services while learning more about their customers. Interestingly, AI can enhance customer service in almost all elements, including improving response time and providing predictable insights.
Some people might be aware of the potential benefits of AI in customer service on a rational level, but don’t appreciate it from a visceral perspective. They are more amenable to the idea after hearing that 91% of top companies use AI to boost their customer service strategies.
Below is how AI supercharging your customer service.
Multichannel Support
Customers prefer different channels when engaging with a business. However, some businesses find it challenging to maintain multiple channels at once. AI offers an intelligent support system that encompasses parallel support channels. Overall, AI in customer support ensures a total balance in the support system. This is actually one of the biggest customer service challenges that can be solved with AI. Besides meeting customer needs, AI also enables agents to fulfill their service commitments and relieve loaded support channels.
Most businesses can be overwhelmed with a high volume of customer queries, which can be impossible for agents to handle. However, with AI, bots provide an effective way to manage a high volume of customer inquiries. AI can also collect actionable insights on each interaction and estimate the time the next customer will wait before interacting with a live agent.
CRM Compatibility
AI can easily complement the role of CRM in your business. CRM assists in using customer data to understand their needs, but AI can step in and unveil means to offer a more personalized experience. AI uses customer data like age, gender, region, and sales history to understand their needs quickly. Additionally, AI integrated with CRM systems can assist in automating tasks in return saving time. You can engage entities like Goodway to understand how your CRM can be integrated with AI.
Improved Response Time
Most customers appreciate businesses that respond to their queries promptly. Relying on human input can result in unnecessary delays. However, leveraging AI to build a customer engagement platform can automatically deploy behavioral data from the customer to determine the right message. Additionally, using AI can monitor how different customer messages perform and then suggest the correct response in real-time.
Data Gathering
With AI, data collection is simplified significantly and unified to create a single customer view. The data is collected based on factors like the customers’ behavioral patterns. With advances, AI can quickly request the correct data without human interference. The data is analyzed and instantly responds to the needs and sentiments of the customer. Most importantly, eliminating human intervention guarantees the accuracy of the data collected.
Prediction and Insights
Insightful predictions on customer behavior can be used for future policies impacting customers based on their choices. Additionally, AI can suggest the best action for agents through understanding the proper responses to the customer-generated ticket.
Chatbot Customer Support
Customer support staff are tasked to handle multiple calls every day. They also face the challenge of reducing the time it takes to resolve customer inquiries per hour. Chatbots play a critical role in answering customer queries promptly and accurately in real-time.
AI is Invaluable to Customer Service Strategies for Most Brands
Artificial intelligence is changing many aspects of modern business. One of the overlooked departments that is evolving in response to advances in AI is customer service.
Customer service is the backbone of any industry. Based on the highlighted benefits, businesses need to leverage emerging technologies like AI to improve the customer experience to sustain growth. It is important to utilize the best AI tools to get the most of your customer service strategy.
Data breaches are becoming increasingly common each year. The costs of data breaches are becoming worse, which can easily cripple many companies. An estimated 60% of companies that fall victim to data breaches have to shut down within six months. As a result, 10% of all companies file for bankruptcy due to data breaches.
Companies are not wasting any resources trying to mitigate the growing risk of data breaches. They are hiring security experts that can fortify their security to stop cybercriminals in their tracks. If you want to do your part to fight data breaches, you should consider getting a network security certification and join the front lines against these cybercriminals.
Getting a Network Security Certification Can Help You Thwart Data Breaches
The security of the network is critical to the overall security of any organization, especially since data breaches have become so common. There were 4,145 publicly recorded data breaches last year, which exposed more than 22 million records. This figure is going to increase as cybercriminals become bolder.
Unfortunately, fighting data breaches is easier said than done. Most organizations have large numbers of devices such as computers, laptops, servers, and other equipment that are all interconnected with one another and this network is always vulnerable to attacks. Communication between devices occurs on a regular basis, and the sensitive data that passes through them is usually shared among them.
It is, therefore, necessary to ensure the security of the network and the devices that are connected to it. This is one of the most important lines of defense against data breaches. To build a better infrastructure where enterprises face fewer threats and can better protect themselves from cybercriminals trying to steal their data, organizations must be constantly on the lookout for qualified individuals to join their teams.
To properly configure and secure a network, firms look for applicants that are experienced in debugging, configuring, troubleshooting, and securing these devices. Candidates that have received training are always in demand, and organizations is always looking to hire them to fight data breaches.
Certification is the first step in this direction because it demonstrates the worth of a candidate. To obtain the certification, a candidate must pass an exam that typically contains a large number of different questions and may also require completion of a practical exam. Several certifications are available that can be beneficial to those who want to advance their careers in the field of network security.
Let us talk about a couple of them.
CATO SASE Expert Level 1
Gartner has developed a new enterprise networking technology category called Secure Access Service Edge (SASE) that brings together network operations and security point solutions to form a unified, global cloud service.
Because of SASE, which advances networking technology, many organizations are shifting their attention to SASE and recruiting individuals who are capable of handling and implementing it in their organization. Given that Cato Cloud was the first SASE platform, Cato Networks’ SASE Expert Level 1 certification course has successfully provided a comprehensive understanding of SASE and its architecture, and it has done so in an exceptionally well-organized manner.
The CATO SASE expert Level 1 certification covers a wide range of topics, including how networks evolved from MPLS to SD-WAN to SASE, as well as the improvements that have been made, their essential distinctions and the advantages they provide, virtual private networks (VPNs), and other related subjects of security such as CASB, FWaaS and DNS. All of these guidelines can help security professionals learn to fight data breaches. In order to obtain the Cato certification, you must first apply to the Cato SASE course and then pass the certification exam with an 85 percent passing score.
GIAC Security Essentials
As the name implies, the GIAC Security Essentials certification is governed by the GIAC. The candidate who holds this certification demonstrates that they are competent in executing security-related actions and that they not only possess theoretical knowledge but also have hands-on experience in the field of data security. Candidates’ understanding of information security and terminology beyond the basic level is verified and validated through this certification.
Practical job experience is quite beneficial for passing this exam, and there is a great deal of live training available for these qualifications. Those with a security experience or network understanding, such as security experts, pentester testers, forensic analysts, and information technology engineers, can pursue this certification.
The topics addressed by this certification include active defense, access control on devices, IT risk management, security policy development, endpoint security, Linux security, incident response, and incident handling, among others. This certification requires candidates to pass a web-based, proctored examination that comprises 106-180 questions and must be completed in 4-5 hours with a minimum score of 73 percent.
CCIE Security Certification
The CCIE Security Certification is governed by CISCO, and it is most commonly chosen by experienced networking professionals who wish to advance their careers to the level of network security professional. Network security professionals are capable of implementing, maintaining, configuring, securing, and troubleshooting the complex enterprise networking infrastructures that exist in organizations today. In addition, candidates who earn this certification are capable of creating a network for a business while keeping security in mind, which is a significant amount of responsibility.
As it demands both experience and knowledge, the candidate will need to dedicate a significant amount of time to passing this certification. They must also pass a practical examination, which is conducted in a lab, to verify their technical ability. This is an expert-level certification that covers a wide range of security topics, including wireless, service provider, routing and switching, data center, and collaborative work environments, among others.
The exam for this certification consists of 100 questions that must be completed in 120 minutes, and the candidate must score 80 percent or above in each part in order to achieve this certification. They must also pass a practical lab to receive this certification.
CompTIA Network+
The CompTIA Network+ certification is apt for those capable of performing basic network troubleshooting and wishing to learn more about the security perspective, for people who wish to learn about networks from a security standpoint,. To design a network infrastructure, applicants must have a fundamental understanding of networks and related technologies, including correct installation or configuration of devices, creating topologies, and comprehension of network protocols.
According to the new guidelines, this certification covers five main areas of network security, including network concept, network infrastructure, network security, network troubleshooting, and network tools, among others.
Although this certification covers the exterior security of infrastructure, it does not cover the internal or operational security of infrastructure. This certification consists of a series of 90 questions, which can be either multiple choice or performance based, and the applicant must finish it in 90 minutes to be eligible for the certification. The passing score for this certification is 80 percent, which is the minimum requirement.
The Right Certifications Can Help Fight Data Breaches
Today, we learned some network security certifications for different levels of experienced candidates. Experts with these credentials will be able to help fight data breaches. Certification helps candidates grow their career, learn something new, make themselves unique and sustainable in the highly demanding market of security. There can be more certifications, but picking the right one depends on individuals choice, interest, and experience.
Before pursuing any certification make sure to carefully consider your interest first. Because, if you have interest, you will put your effort into gaining that certification and organizations always prefer skilled professionals. Lastly, certifications are very helpful in negotiating for competitive compensation.
The Home Depot, Inc., is the world’s largest home improvement retailer with annual revenue of over $151B. Delighting our customers—whether do-it-yourselfers or professionals—by providing the home improvement products, services, and equipment rentals they need, when they need them, is key to our success.
We operate more than 2,300 stores throughout the United States, Canada, and Mexico. We also have a substantial online presence through HomeDepot.com, which is one of the largest e-commerce platforms in the world in terms of revenue. The site has experienced significant growth both in traffic and revenue since the onset of Covid-19.
Because many of our customers shop at both our brick-and-mortar stores and online, we’ve embarked on a multi-year strategy to offer a shopping experience that seamlessly bridges the physical and digital worlds. To maximize value for the increasing number of online shoppers, we’ve shifted our focus from event marketing to personalized marketing, as we found it to be far more effective in improving the customer experience throughout the sales journey. This led to changing our approach to marketing content, email communications, product recommendations, and the overall website experience.
Challenge: launching a modern marketing strategy using legacy IT
For personalized marketing to be successful, we had to improve our ability to recognize a customer at the point of transaction so we could—among other things—suspend irrelevant and unnecessary advertising. Most of us have experienced the annoyance of receiving ads for something we’ve already purchased, which can degrade our perception of the brand itself. While many online retailers can identify 100% of their customer transactions due to the rich information captured during checkout, most of our transactions flow through physical stores, making this a more difficult problem to solve.
Our old legacy IT system, which ran in an on-premises data center and leveraged Hadoop, also challenged us since maintaining both the hardware and software stack required significant resources. When that system was built, personalized marketing was not a priority, so it took several days to process customer transaction data and several weeks to roll out any system changes. Further, managing and maintaining the large Hadoop cluster base presented its own set of issues in terms of quality control and reliability, as did keeping up with open-source community updates for each data processing layer.
Adopting a hybrid approach
As we worked through the challenges of our legacy system, we started thinking about what we wanted our future system to look like. Like many companies, we began with a “build vs. buy” analysis. We looked at several products on the market and determined that while each of them had their strengths, none was able to offer the complete set of features we needed.
Our project team didn’t think it made sense to build a solution from scratch, nor did we have access to the third-party data we needed. After much consideration, we decided to adopt a solution that combined a complete rewrite of the legacy system with the support of a partner to help with the customer transaction matching process.
Building the foundation on Google Cloud
We chose Google Cloud’s data platform, specifically BigQuery, Dataflow, DataProc, Cloud Storage, and Cloud Composer. Google Cloud platform empowered us to break down data silos and unify each stage of the data lifecycle from ingestion, storage, and processing to analysis and insights. Google Cloud offered best-in-class integration with open-source standards and provided the portability and extensibility we needed to make our hybrid solution work well. The open standards of BigQuery’s BQ Storage API allowed us to leverage fast BQ storage layers to be utilized with other compute platforms, e.g., DataProc.
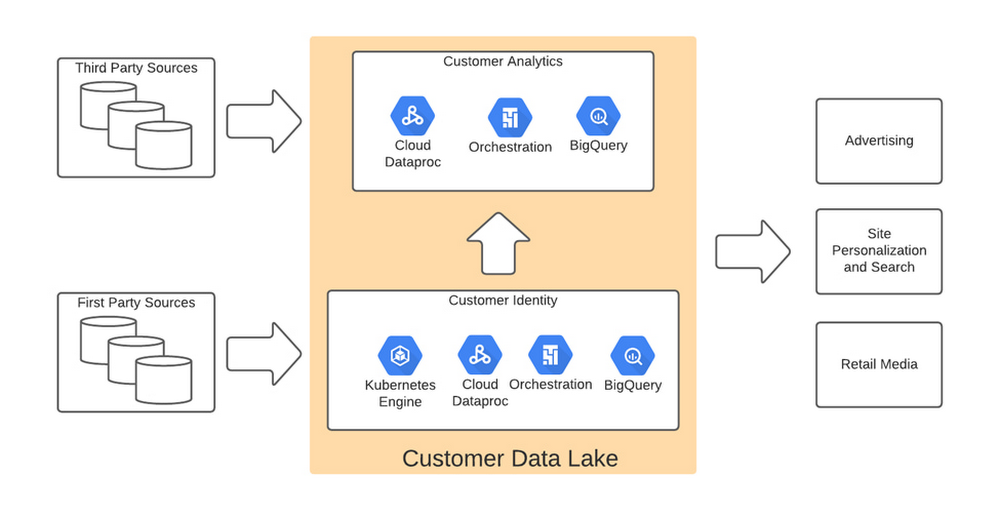
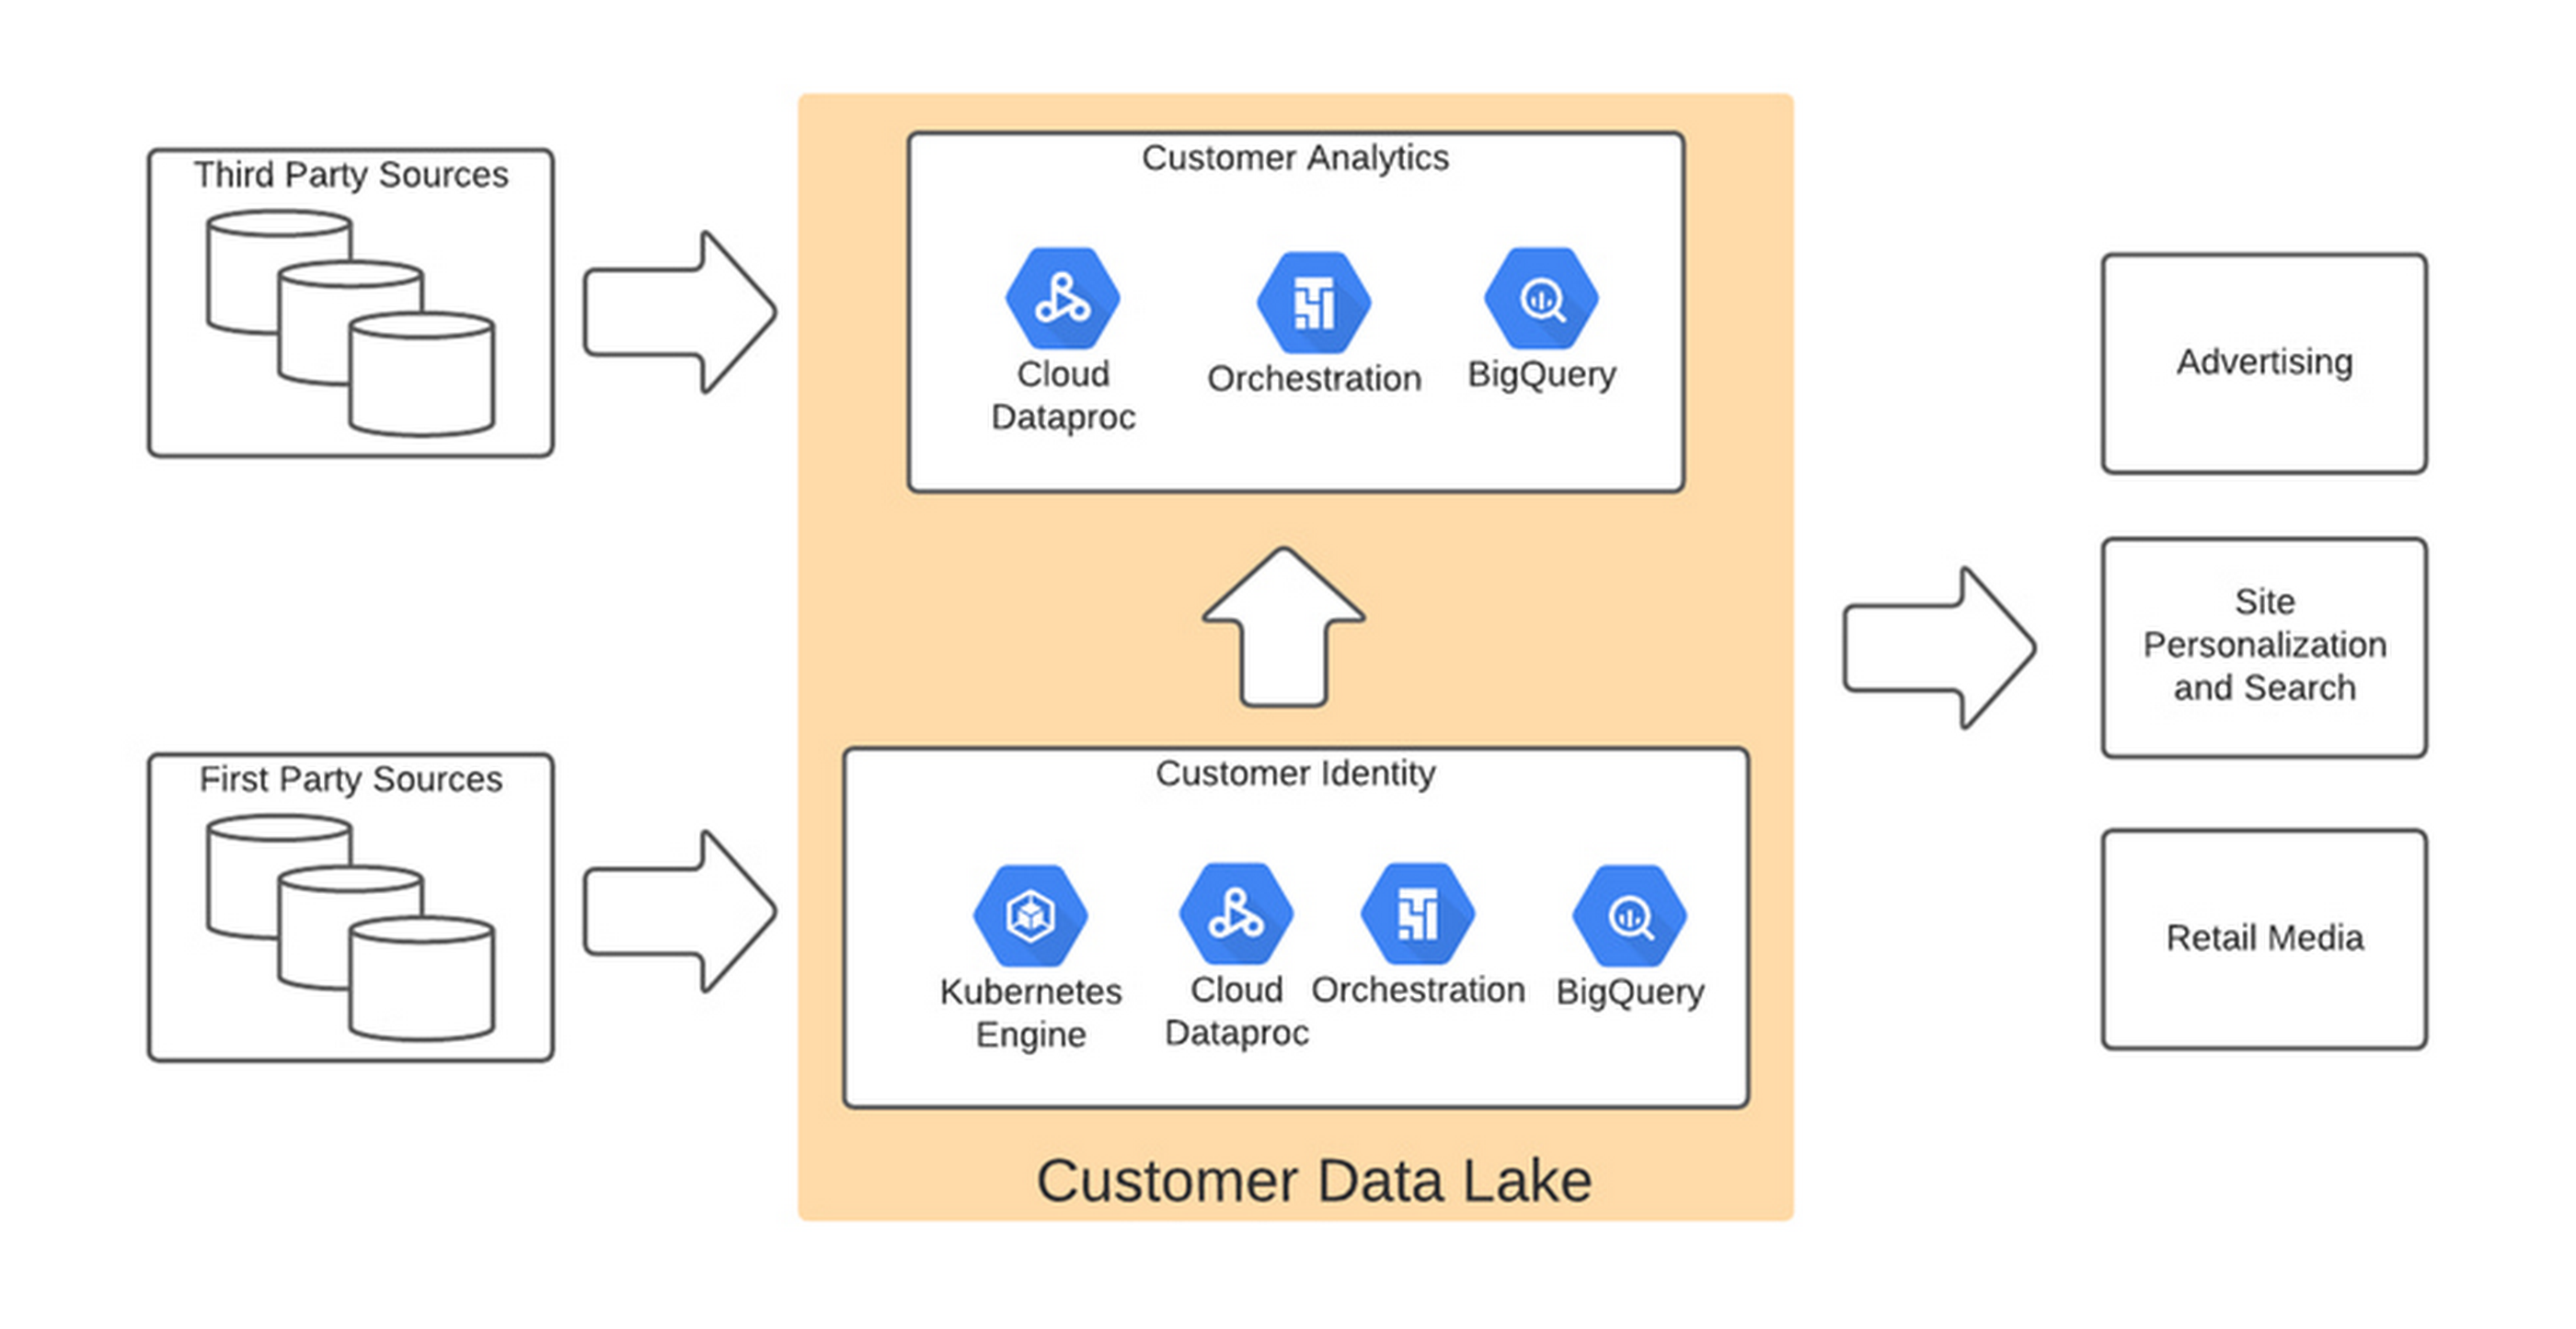
We used BigQuery combined with Dataflow to integrate our first- and third-party data into an enterprise data and analytics data lake architecture. The system then combined previously siloed data and used BigQuery ML to create complete customer profiles spanning the entire shopping experience, both in-store and online.
Understanding the customer journey with the help of Dataflow and BigQuery
The process of developing customer profiles involves aggregating a number of first- and third-party data sources to create a 360-degree view of the customer based on both their history and intent. It starts with creating a single historical customer profile through data aggregation, deduplication, and enrichment. We used several vendors to help with customer resolution and NCOA (Change of Address) updates, which allows the profile to be house-holded and transactions to be properly reconciled to both the individual and the household. This output is then matched to different customer signals to help create an understanding of where the customer is in their journey—and how we can help.
The initial implementation used Google Dataflow, Google’s streaming analytics solution, to load data from Google Cloud Storage into BigQuery and perform all necessary transformations. The Dataflow process was converted into BQML (BigQuery Machine Learning) since this significantly reduced costs and increased visibility into data jobs. We used Google Cloud Composer, a fully managed workflow orchestration service, to help orchestrate all data operations and DataProc and Google Kubernetes Engine to enable special case data integration so we could quickly pivot and test new campaigns. The architecture diagram below shows the overall structure of our solution.
Taking full advantage of cloud-native technology
In our initial migration to Google Cloud, we moved most of our legacy processes in their original form. However, we quickly learned that this approach didn’t take full advantage of the cloud-native and more improved features Google Cloud offered such as auto scaling of resources, flexibility to decouple storage from the compute layer, and a wide variety of options to choose the best tool for the job. We refactored our Hadoop-based data pipelines written in Java-based Map Reduce and our Pig Latin jobs to Dataflow and BigQuery jobs. This dramatically reduced processing time and made our data pipeline code concise and efficient.
Previously, our legacy system processes ran longer than intended, and data was not used efficiently. Optimizing our code to be cloud-native and leveraging all the capabilities of Google Cloud services resulted in reduced run times. We decreased our data processing window from 3 days to 24 hours, improved resource usage by dramatically reducing the amount of compute we used to possess this data, and built a more streamlined system. This in turn reduced cloud costs and provided better insight. For example, DataFlow offers powerful native features to monitor data pipelines, enabling us to be more agile.
Leveraging the flexibility and speed of the cloud to improve outcomes
Today, using a continuous integration/continuous delivery (CI/CD) approach, we can deploy multiple system changes each week to further improve our ability to recognize in-store transactions. Leveraging the combined capabilities of various Google Cloud systems—BigQuery, DataFlow, Cloud Composer, Dataproc, and Cloud Storage–we drastically increased our ability to recognize transactions and can now connect over 75% of all transactions to an existing household. Further, the flexible Google Cloud environment coupled with our cloud-native application makes our team more nimble and better able to respond to emerging problems or new opportunities.
Increased speed has led to better outcomes in our ability to match transactions across all sales channels to a customer and thereby improve their experience. Before moving to Google Cloud, it took 48 to 72 hours to match customers to their transactions, but now we can do it in less than 24 hours.
Making marketing more personal—and more efficient
The ability to quickly match customers to transactions has huge implications for our downstream marketing efforts in terms of both cost and effectiveness. By knowing what a customer has purchased, we can turn off ads for products they’ve already bought or offer ads for things that support what they’ve bought recently. This helps us use our marketing dollars much more efficiently and offer an improved customer experience.
Additionally, we can now apply the analytical models developed using BQML and Vertex AI to sort customers into audiences. This allows us to more quickly identify a customer’s current project, such as remodeling a kitchen or finishing a basement, and then personalize their journey by offering them information on products and services that matter most at a given point through our various marketing channels. This provides customers with a more relevant and customized shopping journey that mirrors their individual needs.
Protecting a customer’s privacy
With this ability to better understand our customers, we also have the responsibility to ensure we have good oversight and maintain their data privacy. Google’s cloud solutions provide us the security needed to help protect our customers’ data, while also being flexible enough to allow us to support state and federal regulations, like the California Customer Privacy Act. This way we can provide a customer the personalized experience they desire without having to fear how their data is being used.
With flexible Google Cloud technology in place, The Home Depot is well positioned to compete in an industry where customers have many choices. By putting our customers’ needs first, we can stay top of mind whenever the next project comes up.
Geospatial data has many uses outside of traditional mapping, such as site selection and land intelligence. Accordingly, many businesses are finding ways to incorporate geospatial data into their data warehouses and analytics. Google Earth Engine and BigQuery are both tools on Google Cloud Platform that allow you to interpret, analyze, and visualize geospatial data. For example, you can combine crop classifications based on satellite data from Google Earth Engine with weather data in BigQuery to predict crop yield.
Although there is crossover in the functionality of these two products, they are different and are designed for different use cases, as summarized in the following table. In this blog, we demonstrate how geospatial data can be moved from Google Earth Engine to BigQuery, and the changes in data format that are required.
Earth Engine and BigQuery
Earth Engine’s robust visualization capabilities and data catalog make it an important part of the discovery/development stage of a geospatial solution, and more. BigQuery’s status as a complete data warehouse makes it great for solutions involving non-geospatial datasets. For many use cases, you’ll want to use both tools. This raises a question: how can you move data from Earth Engine to BigQuery?
Using Geobeam to move data from Earth Engine to BigQuery
Geospatial data comes in many forms, file formats, and projections, so moving data between tools is not simple. However, a relatively new open source library named Geobeam can help bridge the gap between Earth Engine and BigQuery.
Geobeam is a Python library that extends Apache Beam and enables you to ingest and analyze massive amounts of geospatial data in parallel using Dataflow. Geobeam provides a set of FileBasedSource classes and Apache Beam transforms that make it easy to read, process, and write geospatial data.
In this blog, we will walk through a tutorial that uses Geobeam to ingest a raster dataset in GeoTIFF format from Earth Engine into BigQuery as a vector data table.
Handling geospatial data
Before launching into the code, it’s important to understand how each product we use handles geospatial data. Earth Engine has a huge data catalog of maps and assets that are available to its users. You can also import and export CSV files and Shapefiles (for vector data), or GeoTIFFs and TFrecords (for raster data) in Earth Engine. BigQuery has a smaller catalog of publicly available geospatial datasets. It accepts data in CSV format, in WKT format, or in properly formatted GeoJSON format.
Raster files (that is, images) are a unique kind of file that are not supported natively in BigQuery. Therefore, they must be transformed before they are ingested into BigQuery. You can use Geobeam for this transformation, as summarized in the following diagram:
Transformation by Geobeam
Currently, Geobeam has only been tested using BigQuery as a destination, but it could be extended to other sinks, such as MySQL. Geobeam primarily uses rasterio, shapely, and GDAL for Python to make the necessary transformations. You can build your own transformations in Apache Beam by forking the Geobeam GitHub repository.
Tutorial
If you’d like to follow along, you need to have an Earth Engine account (sign up for free), and a Google Cloud account (sign up for free trial). All the code for this tutorial can be found in the associated GitHub repository. We assume the audience for this blog has some familiarity with Google Cloud Platform.
The tutorial takes the following steps:
Visualize the USDA Cropland data in Earth Engine.
Export the dataset as a GeoTIFF.
Run a Dataflow job, which uses Geobeam to do the following:
Convert the raster GeoTIFF into vector format.
Ingest the data into BigQuery.
Confirm that the data was correctly loaded into BigQuery.
Visualizing the dataset
The dataset we used is the USDA Cropland Data Layer. This is an image collection in the Earth Engine catalog that contains crop type data for the continental United States. The following image shows what the full dataset looks like in the Earth Engine console.
Exporting data from Earth Engine
To export data from Earth Engine, you can use the Earth Engine console, which utilizes JavaScript. For this example, we submitted commands to Earth Engine using the Earth Engine Python API (when we built this tutorial, we used a Jupyter notebook in the Vertex AI Workbench environment).
We exported the dataset to a Cloud Storage bucket by using the following script:
code_block[StructValue([(u’code’, u”# define a regionrncolorado = ee.Geometry.Rectangle([-104, 37, -102, 38]);rnrn# Select the first (and only) image from the Cropland image collection for the year 2019, and the cropland band, which gives us the crop type. Currently, Geobeam will only ingest a single band from a GeoTIFF at time.rnimage = ee.ImageCollection(‘USDA/NASS/CDL’).filter(ee.Filter.date(‘2019-01-01’, ‘2019-01-02’)).first();rncropland = image.select(‘cultivated’);rntask_config = { ‘description’: ‘cropland’,rn ‘crs’: ‘EPSG:4326’, # specify this projection to ensure BigQuery can ingest it properlyrnrn ‘scale’: 30, # also necessary to specify scale when reprojecting (30m is the original dataset scale)rn ‘bucket’: BUCKET_NAME,rn ‘fileNamePrefix’: ‘croplandExport_co1’,rn ‘region’: colorado,rn ‘maxPixels’: 1e12 #increase max pixels limit for exports rn}rnrntask = ee.batch.Export.image.toCloudStorage(cropland, **task_config)rntask.start()”), (u’language’, u”)])]
This dataset is updated annually, so filtering to a single day provides the crop types for that whole year. The code uses the first() method to select the first image from the collection, though in this case, there is only one image for that date range. By using the first() method, Earth Engine treats the output as type Image and not as type ImageCollection, which is what we wanted for export.
In the export statement, we reprojected the image as EPSG:4326, which is the projection that BigQuery uses for its geospatial data. Geobeam is designed to reproject input data into EPSG:4326, and you can provide the original projection of the input data by using the in_epsg parameter. The cropland dataset uses an atypical projection (Albers Conical Equal Area Map) by default, so we specified a more typical projection on export, rather than leaving it to Geobeam to reproject the data. It’s important to specify a scale value and a crs (Coordinate Reference System) value when you reproject in Earth Engine.
Note that for the sake of example, we exported a small region (a portion of Colorado) in order to reduce the export and ingest time. If we had exported the entire United States, it would have taken around 30 minutes to export and around 30 minutes to run the Geobeam ingestion job.
Exporting large regions of high-resolution raster data from Google Earth Engine into BigQuery is not a recommended or efficient practice in general, but is possible to do if necessary. In this tutorial, we exported a single band as a 2.4 MB GeoTIFF file that translated to 2 million rows in BigQuery. Larger, more complex datasets will take prohibitively long (or exceed memory limits) to export, plus BigQuery isn’t the right tool for visualizing satellite imagery. Instead, we recommend that you do your analysis of image collections in Earth Engine. When you have a relevant subset of data, then consider moving that data into BigQuery.
Using Geobeam to ingest the data into BigQuery
After exporting the raster GeoTIFF to a Cloud Storage bucket, we were ready to run a Dataflow job to ingest the GeoTIFF into BigQuery as vector (tabular) data. The pipeline code, which can be found in the Geobeam Github examples, uses the Geobeam GeotiffSource class and the format_record method to transform the input file into a format that can be ingested by BigQuery.
Using Apache Beam in Dataflow, you can write practically any kind of data transformation you can think of. In this case, all we did was directly read in the band values (crop type) as integers and read the pixels as points.
We ran the job in Dataflow by using the following command:
By setting the centroid_only parameter to true, we had Geobeam compute the center of each pixel to produce a point, as opposed to producing a polygon that encompassed the entire pixel (or pixels if they have the same band value).
The merge_blocks parameter affects how Geobeam merges pixels during read. You can use this parameter to tune the ingestion time—generally, increasing the merge_blocks value increases the ingestion time.
You can monitor the Dataflow job in the Cloud Console. For this example, the job took about 11 minutes and looked like the following:
View the table in BigQuery
When the job is complete, the resulting table is found in BigQuery via the Explorer panel, by navigating to the project > dataset > table that was ingested. The preview of the table showed the following:
As you can see, the data that were once pixels in Earth Engine are now points in BigQuery. The data has been transformed from raster to vector. You can visualize the points on a map using BigQuery Geo Viz tool.
Analyzing the Data
In this blog, you have seen raster data from Earth Engine transformed and ingested into BigQuery as vector data using Geobeam. This does not mean you can, or should, use Geobeam to reproduce entire satellite imagery datasets in BigQuery. BigQuery is not built to process images, so you will quickly find yourself frustrated if you try to ingest and analyze the entire Sentinel-2 dataset in BigQuery. A better practice is to identify particular bands, properties, and regions that are of interest to you in a geospatial dataset, and use Geobeam to bring those to BigQuery, where they can be easily combined with other tabular data, and where you can use them to build models or do other analyses.
Now that we have ingested the crop classification data in BigQuery, we could spatially join it to another dataset that has weather information, and use those as features in a BQML predictive model. For example, we could look at the average distance between soy fields, and a company’s stores that sell soy-based products.
Although it can be difficult to understand initially, geospatial data opens up an entirely new dimension in the data world. Earth Engine, BigQuery, and Geobeam can help you put your analyses on the map.
Acknowledgments: Thanks to Travis Webb, Rajesh Thallam, Donna Schut and Mike Pope for their help with this post
Did you know that the market for financial analytics services is worth over $25 billion? This figure is growing every year, as more financial organizations are discovering the benefits data analytics technology offers.
However, financial executives aren’t the only ones leveraging data to improve their financial decision-making. Many individual traders are also finding ways to take advantage of financial analytics to get a higher ROI from their investing decisions.
We recently interviewed a trader that uses financial analytics to make better trading decisions. They have been a successful algorithmic trader for the past 17 months. This trader never imagined that their life would be completely transformed by becoming an algorithmic trader. They had to learn about the nuances of data analytics to get the highest ROI from their trades.
This trader wanted to share how they became a successful investor and how anyone can do the same if they dedicate themselves to being a successful algorithmic trader by making the most of data analytics.
What is algorithmic trading and what role does data analytics play?
Multiple commodities and financial instruments are traded on financial platforms every moment of the day. This is one of the reasons that the market is considered to be highly efficient.
Traders make money by betting on how prices move in these markets. But traders often fall prey to their psychology and fail to stick with their strategy. To overcome this, traders can use trading bots to execute algorithmic (rule-based) strategies. This ensures that they stick with their strategies and generate consistent profits. This automated trading with rule-based trading bots is algorithmic trading.
This wouldn’t have been possible without data analytics. These bots use historic data to get a better understanding of the behavior of the markets. They rely on complex AI algorithms that can employ technical analysis principles, as well as other factors that influence the direction of financial markets.
Can analytics-driven bots help make up for the lack of a strategy?
When the trader we interviewed started out, they were new to the whole trading world. Josh was their only guide and they did not have sufficient knowledge to navigate the markets. Josh knew this and suggested their protégé try algorithmic trading with existing robot traders. He also uses such robots frequently, even though he is an experienced trader.
The truth is that these robots help both experienced and novice traders make more profitable decisions. They can automate their trades and use historical data to identify the best times to place them and the best securities to buy and sell.
How do data-savvy investors take advantage of these trading bots?
First, you need to enable algorithmic trading on MetaTrader 5. For that, click on Tools in the menu bar and click Options. In the pop-up window, choose the Expert Advisors tab. Click the checkbox against Allow algorithmic trading and choose the sub-options as per your needs. This enables algorithmic trading for your account. The trader we spoke did the same when they were setting up my account. In MetaTrader 5, algorithmic trading robots are called Expert Advisors.
Once that was set up, the trader went to the MQL5 Marketplace to look for a suitable algorithmic trading bot. Clicking on Experts in the sidebar, under MetaTrader 5, lists out all expert advisors sorted according to popularity. Since the trader was just starting out, they opted only for free expert advisors by clicking the Free tab. You can choose any of the free or paid expert advisors after reading the description and other information provided. You can also sort expert advisors according to type by selecting the appropriate ones in the left sidebar.
You can use the web portal to browse the various expert advisors in detail and at leisure. But you can do the same from the MetaTrader 5 terminal itself. Click on Tools in the menu bar and click on MQL5 Market. You can choose any of the expert advisors and read the overview, screenshots, and reviews. You can also download it from the terminal. You just need to have a registered account to download any application. There is also an option to get developers to develop custom trading bots to suit your needs. This can be done by creating an order in the freelance section of the MQL5.community. Let us see how to use Dark Venus MT5, a free algorithmic trading bot, for a demonstration.
Testing the bot
You can test any trading bot downloaded from the platform with a demo account. You need not put any money down to test the strategies. There’s also the option to test even the paid bots before you make a purchase decision. You can select the trading bot you downloaded from the left sidebar of the terminal, in the Navigator section.
Right click on the bot and click on the Test option to start testing. You can vary the different variables and parameters on the strategy tester. Click Start to test the bot. You can choose to backtest the chosen strategy with historical data. If your desktop is not capable of testing or you want to free up processing power, you can test the strategy using MQL5 Сloud Network.
Once you are The expert advisor will start algorithmic trading on your behalf with the instrument of your choice. The profit/loss of the trades will be displayed on the chart you selected. You can stop the bot and take profits when you feel like it. You are in complete control of the instruments the bot trades on, when to trade, how long to trade, and when to take profit or loss.
Data Analytics Creates Great Opportunities for Traders to Maximize their Profits
The trader we interviewed started algorithmic trading when they were a novice with markets. Now they have learnt and understood a great deal about the various markets across the world. With that insight they choose appropriate algorithmic trading bots (expert advisors) for various markets. The trader choose from the various expert advisors in the MQL5 marketplace. Sometimes, they create custom bots using the freelance feature of the platform. With these in place, they are consistently earning mid 5-figures every month. My aim is to increase that to a 6-figure monthly income within another year.
For you, it is easy to start algorithmic trading today. But what generates consistent profits is sticking to trading with the conviction to stay the course. If you get disheartened by short-term losses, you will lose out on future profits. Algorithmic trading eventually works with persistence and perseverance.
Big data technology is disrupting almost every industry in the modern economy. Global businesses are projected to spend over $103 billion on big data by 2027. While many industries benefit from the growing use of big data, online businesses are among those most affected.
There are many practical benefits of using big data to grow your online business. You want to educate yourself on the possibilities, so you can make the most of this remarkable new technology.
How Big Data Can Help Your Online Business Maximize Growth Opportunities
Running your own business can be one of the most rewarding career paths anyone can take. However, it doesn’t come without its difficulties. High risk means high reward but there are certain steps you can take that almost guarantee commercial success, particularly when it comes to an online business. Without the outlay costs of rent, utilities, and limited customer base that a physical business has, an online business is a great way to get your company off the ground to reach new heights in a fast, more efficient way.
The good news is that new advances in big data technology can help online entrepreneurs mitigate the challenges their companies will face, while also gaining the most of new opportunities that come their way. We’ve put together some ideas to help you along the way so that you can grow your business with big data. You can check them out below!
1. Build the Perfect Website
Your website will be the foundation for your triumph so making it great from the outset is essential. Hiring a professional is a good option, however, they don’t come cheap so unless you have a solid amount of seed money it’s not always possible. The good news is, you can create your own website online, using tools that can mean you can bring your vision to life. Look for free builders with drag and drop editors that will make the process easier without needing to understand how to code.
Big data has made it easier than ever to create excellent websites. Companies can use big data to better anticipate user needs and improve the user experience, automate updates, setup analytics systems to monitor traffic and test new landing pages more efficiently.
You should focus on the user experience, as well as the aesthetic. Since big data makes the process more efficient, it should be easy to do both. It’s all well and good having a beautiful website but if it’s not easy to use then customers and clients will be turned off and won’t use your services.
2. Establish your Audience
Part of identifying your brand is understanding who your audience is. You need to figure out who your product or service most appeals to and who you had in mind when creating it. Your key demographic will likely have a particular need for what you are offering and so you need to market your business in a way that caters to that particular group. Think TikTok marketing for the Y2K generation, or LinkedIn messaging if your services are business to business. Knowing who your audience is will make it much easier to develop and deepen your brand’s strength in your marketplace. The best way to do this is by generating a buyer persona or a model of your typical customer or client which helps you establish a clear way of promoting your services to the right people.
Data analytics has made it easier to identify the best audience for your online business. Tools like Quantcast use complex data analytics capabilities that to help companies get a better understanding of their target demographics. Advertising platforms like Facebook Ads also have sophisticated audience analytics features that help companies learn more about their target customer.
3. Use Analytics to Identify Points of Differentiation for Your Brand
With Google at our fingertips, it is easy to find yourself lost in such a saturated market. Even if your products or offerings aren’t particularly unique your brand should be. You need to make yourself stand out from the crowd with your content, logo, aesthetic, and message. Do your research and find out how you can make yourself appeal to the wider masses.
You want to take advantage of analytics to learn more about the pain points of your customers. You can use data mining tools to evaluate feedback from customer surveys and other resources that will help you get a better understanding of their expectations. You can also use your own data analytics dashboards to see what customers are telling you. This will help your company build a brand that aligns with their needs.
4. Use Data Analytics to Optimize Your Social Media Strategy
Social media is a powerful tool that will help you get your name out there for free. Set up business accounts on the appropriate channels and make sure you upload regular content. Build your follower count by creating content that is in line with current trends such as popular Instagram Reel audio clips or challenges. Of course, if your business is corporate you don’t want to come across as gimmicky, but never underestimate the power of viral trends that could send your profiles into the stratosphere. If you have products. Send them free of charge to influencers to review in exchange for promotion or ads. LinkedIn is a fantastic way to network with your target audience as you can have a huge reach right from your living room or home office. If you create a physical handmade product, film a short video about your creation process, or shoot a short piece of content about a day in your life as you’re working.
While social media marketing can be very beneficial, it won’t have a good ROI if you aren’t making informed decisions when creating content and optimizing your profiles. You want to use data analytics to monitor engagement on your social media profiles to make the most of your marketing strategy.
5. Use Data Mining to Hone Your Content Creation Skills
While you can pay for Google Ads on a Pay Per Click (PPC) basis, the best way to push your website up the ranks is by creating organic content that includes plenty of keywords that are Search Engine Optimised (SEO) appropriate. add a blog to your website and fill it with multiple blogs between 500 and 1000 words. Choose your topics carefully so that they relate to your business offering and think about the questions people may have about you and what you do. For example, if you run a corporate training company, write a piece of content about the importance of leadership. If you’re not a skilled writer, you can employ freelance writers from places like Upwork and Freelancer for a relatively low price.
If you want to create content yourself, then data mining can help immensely. You will be able to use data mining tools to do more efficient research, which will help create higher quality content. There are other data-driven content marketing ideas worth exploring as well.
6. Create Webinars
If you sell a service rather than a physical product, a free webinar is a fantastic way of reaching out to potential clients and showcasing a snippet of your work. Use video conferencing tools such as Zoom or Teams to speak directly with viewers and run workshops to give them a little taste of what you have to offer. They’ll be so impressed you’ll be leaving them wanting more.
7. Find A Mentor
Every good business leader has got to where they are with some help. Attend networking events that relate to your field and get to know people who are already running successful online businesses. Establish a relationship with them and ask them if they’d consider becoming your mentor. They will be able to guide you through your journey of business growth and help you avoid mistakes that they have already made while building their success.
8. Check Your Metrics
There is no point in creating a fantastic website if you fail to measure its success. Checking your metrics will enable you to see at which point during your potential client or customer’s journey you may have lost the sale. If you use email marketing, you can discover how many clicks you received and compare them to how many sales you made. If you’re not making as much money as you would like, you can use your data to see at which stage in the sales process you may be going wrong and then you will be able to fix it.
Data analytics tools can help you monitor these metrics much more easily. Google Analytics and Crazy Egg are among the best analytics tools. They can help online businesses make the most informed decisions.
Which of these tips will you be trying to help grow your online business into a success? Share in the comments!
Editor’s note: As part of an on-premises data warehousing migration to BigQuery, Twitter and Google Cloud teams created a Google Cloud resource hierarchy architecture that provides one-to-one mapping of the Hadoop Distributed File System (HDFS) to BigQuery. Designed for scalability and security, this architecture is set up to enable smoother adoption of BigQuery by mirroring the HDFS/Google Cloud Storage (GCS) data layout structure and access controls and enables scalable compute adoption. The authors would like to thank Vrushali Channapattan (former Twitter teammate) and Vrishali Shah from Google, for contributions to this blog.
Making data warehousing more widely available across Twitter
Before detailing how Twitter’s resource hierarchy helped enable the seamless adoption of BigQuery across Twitter, it is helpful to know why Twitter chose Google Cloudand BigQuery, and how the data warehouse was set up before the migration. In 2018, the infrastructure Twitter used for data warehousing included tools that required a programming background and had performance issues at scale. Data was siloed and access methods were inconsistent.
In 2019, Twitter embarked on a mission to democratize data processing and analysis for their employees to empower them to analyze and visualize data while increasing the development velocity for the machine learning experimentation. Twitter decided to migrate to a cloud-first, scalable data warehouse to improve data insights and enhance productivity. It needed to be both simple and powerful so that Twitter employees across the enterprise, no matter their technical skills, could access and analyze data for business intelligence and insights. The Twitter Data Platform team selected BigQuery based on the areas of ease-of-use, performance, data governance, and system operability. In 2019, the migration of the on-premises data warehousing infrastructure to BigQuery began and BigQuery became generally available at Twitter in April 2021.
Twitter employees run millions of queries a month on almost an exabyte of data stored across tens of thousands of BigQuery tables. Moreover, Twitter’s internal data processing jobs process over an exabyte of uncompressed data.
To enable that kind of scale after the migration, while ensuring a smooth transition, the Twitter Data Platform and Google Cloud teams had several requirements. The most critical was one-to-one mapping of the on-premises resource hierarchy to BigQuery. Another requirement was that the BigQuery setup mirror Twitter’s identity and access management (IAM) structure to protect the customer data that Twitter employees analyze. With these requirements in mind, the teams went to work.
Structuring the storage project hierarchy for one-to-one mapping
In Twitter’s BigQuery structure, there are two separate types of projects: storage and compute. Storage projects are designed to store only data. On the other hand, any data processing job operating on the data stored in the storage projects, must run inside compute projects. This section describes the resource hierarchy for storage projects.
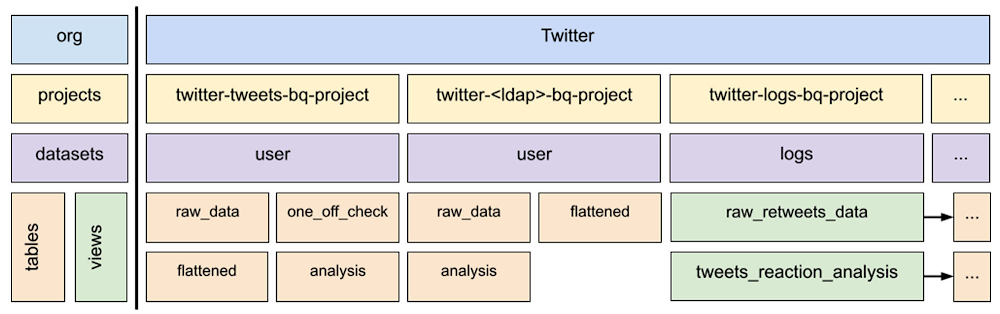
The following diagram shows the BigQuery resource hierarchy for the one-to-one mapping of on-premises HDFS datasets to BigQuery tables or views. Because this hierarchy is in place, HDFS and GCS data can be moved smoothly to BigQuery and accessed in a familiar way by Twitter employees.
With this architecture, users can easily identify where their datasets are, access those datasets, and have the right permissions as if they were still on-premises. Let’s take a closer look at these components in the hierarchy and then see how they work together.
Drilling down on the storage project hierarchy to understand the mapping
The Twitter nomenclature for projects in BigQuery enables one-to-one dataset mapping by clearly identifying each type of dataset. The two types are user and log:
User type includes datasets that users create, and it is further divided into human and non-human users or service accounts. Log datasets are all the different types of event logs that client applications, traffic front ends, and other Twitter applications generate.
In the diagram, the first user project, twitter-tweets-bq-project, is for non-human user datasets, and “tweets” is the identifier. The second project, twitter-<ldap>-bq-project, identifies a Twitter employee who generates data. The project, twitter-logs-bq-project, contains views that point to log datasets stored in the log storage projects (not pictured). This consolidated list of views provides easy discovery for event logs.
How does this mapping work for an actual dataset? Here’s an example. An on-premises dataset hypothetically called tweets.raw_data maps to the storage project twitter-tweets-bq-project where “tweets” is the non-human user or an LDAP service account. The dataset is always user, and it is automatically created. Then, the HDFS dataset on-premises at Twitter is loaded into a table with the same name in that BigQuery dataset, resulting in twitter-tweets-bq-project.user.raw_data being available in BigQuery. This is the case for both human and non-human owned datasets. For logs, related log datasets are collocated into the same storage project based on their name. Then a view is automatically created in twitter-logs-bq-project to ease discovery and access to the logs datasets.
This mapping flow is not a one-and-done proposition; the life cycles of the projects and corresponding datasets, including creation, modifications and updates, and deletions require ongoing management. To that end, Twitter uses a set of services including Terraform, an open-source system for automatic provisioning.
For compute projects, the automatic provisioning is different, as is the process for creating those projects.
Into the shadows: Creating compute projects and managing identity
Twitter takes a self-service approach to BigQuery compute projects. An internal system enables users to create projects directly from a UI. They can run their jobs, access and analyze data, create ML models, with minimal effort, which delivers insights faster and increases productivity. From the internal UI, users may choose a project name and some other project features, and click submit. That triggers actions in the backend.
First, the system automatically creates a corresponding on-premises LDAP group for that project and a Google group, linking both with mutual updates. That group automatically becomes the owning group for that project, and anyone who wants to access the project can request it from the group. A Google Cloud admin service system binds everything and provisions the project. It also makes API calls to Google Cloud to configure cloud resources according to Twitter’s security controls and standards.
The identity and access management (IAM) for BigQuery compute projects follows the AAA principles of authentication, authorization, and auditing. If Twitter employees want to access data in BigQuery, they can use their user accounts to log in. A system automatically publishes the keys for all the service accounts regularly and can be used to authenticate the corresponding users.
Using Google Cloud Databases in unison with BigQuery
Many BigQuery customers also use Google Cloud Databases like Cloud Bigtable to manage their datasets, and Twitter is no different. Twitter opted to use Cloud Bigtable due to its ability to process billions of events in real time. The Bigtable implementation has resulted in cost savings, higher aggregation accuracy and stable, low latency for real-time pipelines. Plus, Twitter no longer needs to maintain different real-time event aggregations in multiple data centers following their Bigtable implementation. In the future, Twitter plans to make Bigtable datasets resilient to region failures. You can learn more about Twitter’s use of Bigtable here.
Reading the map: Lessons learned along the migration path
Twitter’s migration to BigQuery was an ambitious and rewarding undertaking that enriched the knowledge and capabilities of both teams. Working successfully with Google Cloud has enabled Twitter to enhance the productivity of its engineering teams. Building on this relationship and Google Cloud’s technologies will allow Twitter to learn more from their data, move faster and serve more relevant content to the people who use their service every day. As Twitter continues to scale, Google Cloud and Twitter will partner on more industry-leading technology innovation in the data and machine learning space.
For its part, the Google Cloud team learned to apply a different lens to its ideas of project parameters, database size, and support. For example, the Google Cloud team significantly increased the GCP projects limit in a VPC-Service Control perimeter. It also improved the UI usability and performance to enable the accessing of more than 1000 datasets in one project. These changes to BigQuery and collaboration with other Google Cloud project and engineering teams to enable cross-project service account support will continue to benefit Twitter in undertaking new projects.
This successful partnership with Google Cloud allowed Twitter to democratize big data analytics by enabling BigQuery to thousands of internal monthly active users (MAUs). Twitter has also improved development velocity by unlocking faster big data processing as well as machine learning experimentation on Google Cloud.
Are you interested in a career in data science? This is the best time ever to pursue this career track. The Bureau of Labor Statistics reports that there are over 105,000 data scientists in the United States. The average data scientist earns over $108,000 a year.
The interdisciplinary field of data science involves using processes, algorithms, and systems to extract knowledge and insights from both structured and unstructured data and then applying the knowledge gained from that data across a wide range of applications.
While much data science work is starting to become automated, there is still a high demand for data science professionals. There are a lot of great reasons to consider a career track in data science, but you have to know what paths are available. Experts in data science are needed in all kinds of industries, from companies developing dating apps to government security.
Businesses and organizations of all kinds rely on big data to find solutions to problems and provide better services, so there are lots of different types of careers you could pursue with a degree in data science.
If you are planning on getting a data science degree, here are nine careers that you could consider after graduation.
1. Data Scientist
Armed with a Master of Data Science, which you can study either online or at a traditional educational establishment, you could pursue a career as a data scientist.
In the role, you would find, clean, and organize data on behalf of an organization.
You would need to have the skills to analyze large amounts of complex data and find patterns that would benefit the business or organization you work for. The organization can then come up with effective and strategic decisions.
2. Data Engineer
In this role, you would perform batch processing or real-time processing on data that has been collected and stored. As a data engineer, you could also build and maintain data pipelines that create an interconnected data ecosystem that makes information available to data scientists.
3. Machine Learning Engineer
As a machine learning engineer, you would create data funnels and deliver software solutions. To work in this field, you will need strong programming and statistics skills and excellent knowledge of software engineering.
As well as designing and building machine learning systems, you could be responsible for running tests and monitoring the functionality and performance of systems.
The typical duties and responsibilities of a data architect include ensuring data solutions are built for design analytics and performance across numerous platforms.
The role could also involve finding ways to improve the functionality and performance of existing systems and providing access to database analysts and administrators.
5. Machine Learning Scientist
Working as a machine learning scientist, you would research new data approaches and algorithms that can be used in adaptive systems, utilizing supervised, unsupervised, and deep learning methods.
6. Business Intelligence Developer
A career in business intelligence development would involve designing and developing strategies that can assist users in quickly finding relevant information that can help them make better business decisions.
You will need to have a broad range of data expertise to work as a business intelligence developer.
7. Data Analyst
You would transform and manipulate large data sets to meet the desired analysis for businesses, working as a data analyst.
Your duties and responsibilities could include tracking web analytics, analyzing A/B testing, and preparing reports for organizational leaders that effectively communicate the insights and trends found from your analysis.
8. Enterprise Architect
The main duty of an enterprise architect is to align an organization’s strategy with the right technology to execute the required objectives.
That means enterprise architects must have a full understanding of the specific businesses they work for in order to design the systems architecture that meets those needs.
9. Applications Architect
As an applications architect, you would track the behavior of applications that are used within a business or organization and discover how those applications interact with each other and how users interact with them.
You would also focus on designing the architecture of applications, which would include building elements like the infrastructure and user interface.
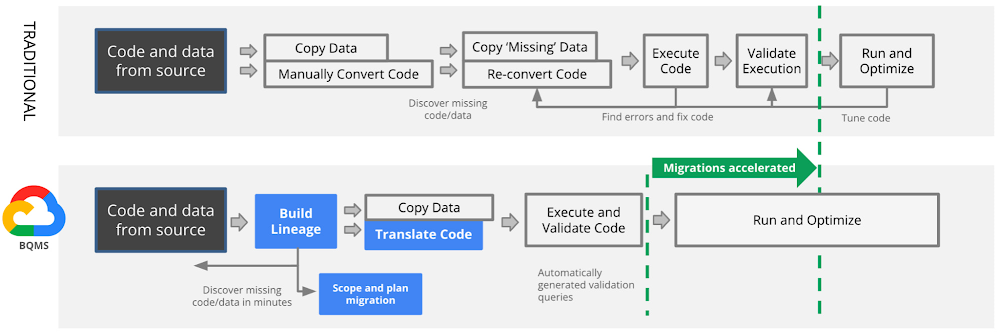
Google’s data cloud enables customers to drive limitless innovation and unlock the value of their data via its robust offerings under a single, unified interface. By migrating their data ecosystems to Google Cloud, organizations are able to break down their data silos and harness the full potential of their data. However, historically, migrating data warehouses has not been an easy task. One of the hardest pieces of a warehouse migration is modernizing legacy business logic, such as SQL queries and stored procedures. This process normally involves substantial manual query rewrites and verifications, which is time consuming and error prone.
Today, Google Cloud is making data warehouse migrations even easier with automated SQL translation as part of the BigQuery Migration Service (BQMS). Customers can now get semantically correct, human readable translations of their legacy SQL queries, across a wide breadth of data warehouses, with just a push of a button. BQMS is available for free and significantly reduces the time, cost and risk of data warehouse migrations to BigQuery.
Automated SQL translation: Reduce risk and accelerate migrations to BigQuery
Industry leading customers like PayPal, Bed Bath & Beyond and many others are already trusting BQMS with their migration journeys. We are thrilled to make the power of automated SQL translation available to all of our customers and partners. BQMS now supports the ability to batch-translate SQL from 10+ dialects to BigQuery:
Amazon Redshift SQL and Teradata SQL in GA
Apache HiveQL, Apache Spark SQL, Azure Synapse T-SQL, Basic Teradata Query (BTEQ), Teradata SPL, IBM Netezza SQL/NZPLSQL, Oracle SQL / Exadata, PL/SQL, Snowflake SQL and Vertica SQL in Preview
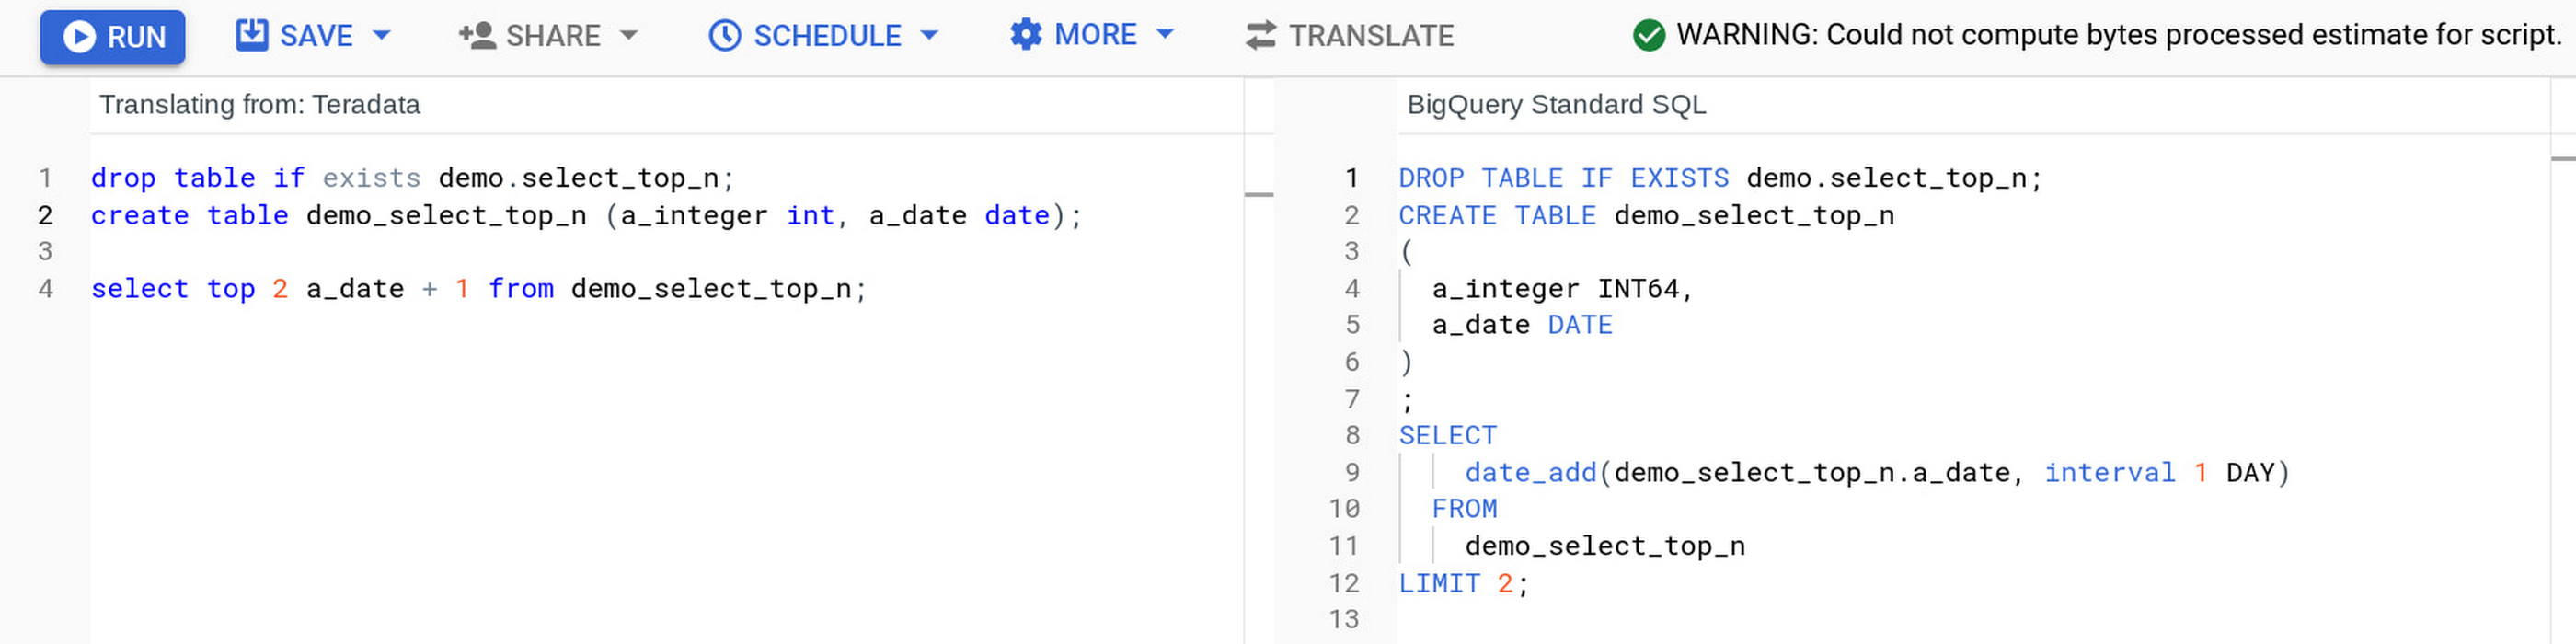
Furthermore, we are making these translation capabilities available via a Google Translate-like experience called interactive SQL translation, providing users with a live, real time SQL translation tool which allows self-serve translation of queries. This not only reduces the time and effort for analysts to migrate their queries, but also increases how quickly they learn to leverage the modern capabilities of BigQuery.
Interactive SQL translation: Live, real time SQL translation across multiple SQL dialects
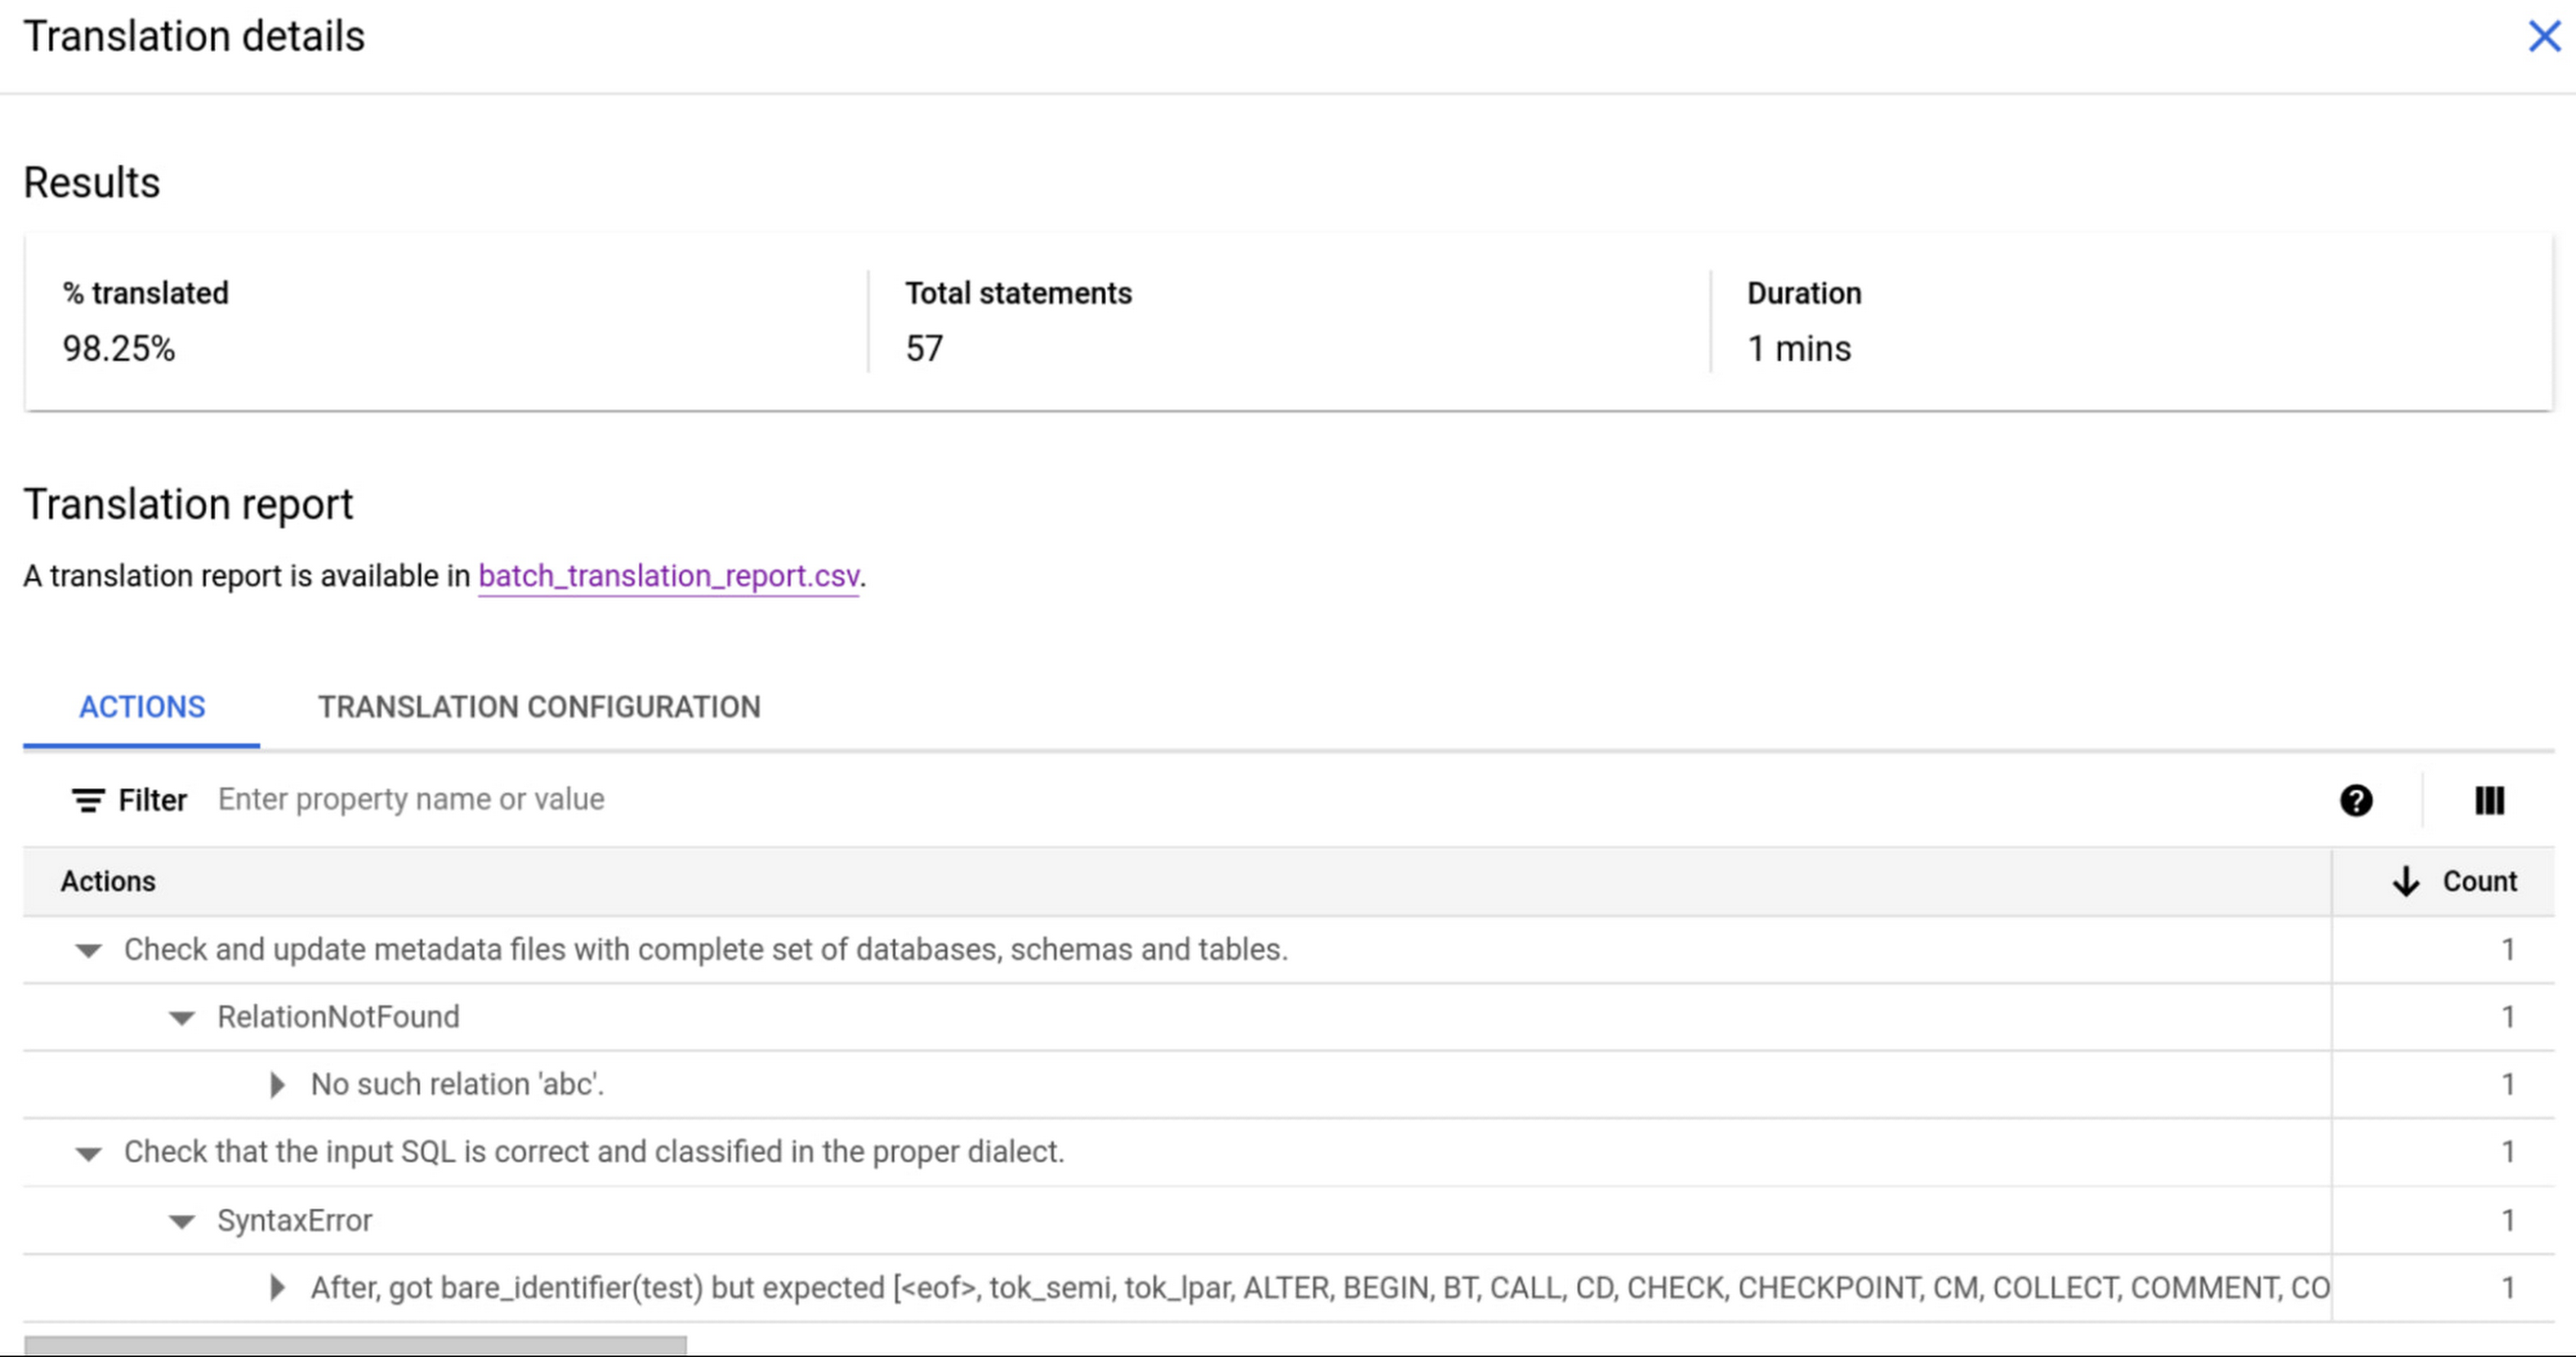
To make using SQL translation easier and more accurate, we are including a suite of open and flexible client-side tools to help with common tasks like extracting SQL and schema from source warehouses and remapping source schema naming to BigQuery’s destination schema. These tools help further automate the end-to-end translation experience, reducing manual intervention and post-translation refactoring. When manual intervention is required, BQMS clearly delineates which parts need to be reviewed for accuracy and which couldn’t be automatically translated and need to be handled outside BQMS.
Translation results: Simple, clear reporting to help focus post-translation effort
The BigQuery Migration Service accelerates a significant portion of your end-to-end migration with open and powerful tools. We are pleased to make SQL translation for a wide breadth of data warehouses available to you and your partners free of charge. We hope it speeds up and lowers the cost of your migrations to BigQuery.
If you would like to leverage BQMS for an upcoming proof-of-concept or migration, reach out to your GCP partner, your GCP sales rep or check out our documentation to try it out yourself. We look forward to partnering with you on your data warehouse migration journey.


