In the exponentially growing data warehousing space, it is very important to capture, process and analyze the metadata and metrics of the jobs/queries for the purposes of auditing, tracking, performance tuning, capacity planning, etc.
Historically, on-premise (on-prem) legacy data warehouse solutions have mature methods of collecting and reporting performance insights via query log reports, workload repositories etc. However all of this comes with an overhead of cost-storage & cpu.
To give customers easy access and visibility to BigQuery metadata and metrics, Google Cloud launched Information Schema in 2020. The Information Schema gives customers a lens to consume the metadata and performance indicators for every BigQuery job/query/API. The storage associated with the Information Schema Views is free. Users only pay for the cost of the Compute associated with analyzing this information.
There are multiple factors that contribute to BigQuery spend. The two most common are storage and processing (querying), which also tend to be the largest items on your bill at the end of the month.
In this blog, we will equip you with an easy way to analyze and decipher the key BigQuery metrics using the Information Schema.
Before getting started, it is important to understand the concept of a “slot” in BigQuery. For the purpose of this blog, we will be looking at the “Jobs Metadata by TimeSlice” view in the Information Schema. More on the Information Schema views here.
In this blog we’ll look at a couple of use cases.
Analyze BigQuery Slot Consumption and Concurrency for a Point in Time
Analyze Query Throughput and % Busy for a Time Period
One important highlight is to note the difference between “Concurrent Query Count” and “Query Throughput Count”.
“Concurrent Query Count” represents the actual number of queries running at a specific point in time.
“Query Count” which is often used to describe the number of queries running over some interval of time.
The ultimate goal of this exercise is to produce a result set that we can export to Google Sheets and drop into a Pivot Table. We can then create visualizations for slot consumption and concurrency. This is critically important as it pertains to:
“Right-sizing” reservation allocations
Understanding the impact of newly introduced workloads into your environment
Determining if workloads are relying on idle slot capacity in order to meet SLAs
Proactively identifying trends which might ultimately result in concurrency limit errors
Alternatively, you can run this from Google Sheets using the BigQuery connector. The queries and charting will be similar in either case.
In short, we will use this information to optimize spend while ensuring consistently for the workloads that need it most.
Also, a couple of key points to remember and act on for both the below scripts:
Change the ‘Region’ qualifier of the Information Schema if you aren’t part of the ‘region-US’. For example, if your datasets are in us-east4, change the qualifier to ‘us-east4’. i.e region-us-east4.INFORMATION_SCHEMA.JOBS_TIMELINE_BY_PROJECT
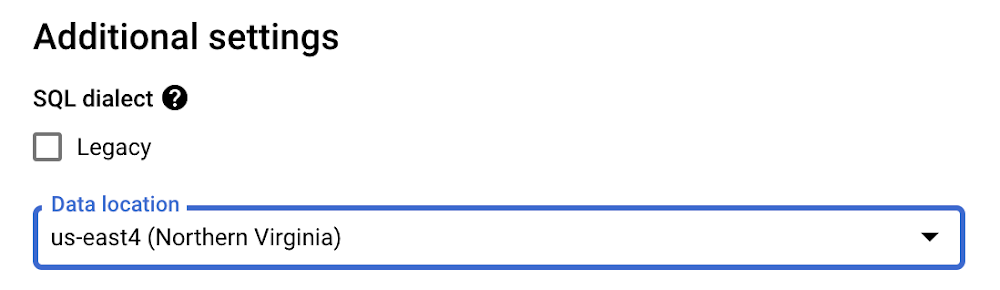
In the BigQuery Console/ UI, under More→Query Settings→ Additional Settings, change the Data Location to the location where your dataset is residing. For example, if your datasets are in us-east4, select that region.
Analyze / visualize point in time slot consumption and concurrency
The purpose of this query is to collect information for all the jobs that are running during a range of time, broken into smaller intervals in which we will capture a single second (Point In Time).
The final charts used to visualize this data will have Time on the X-Axis. For the Y-Axis, we will either have Slot Seconds or Concurrent Query Count…or, we can have both with a Primary and Secondary Y-Axis defined.
Main SQL
Here is the SQL script from the github repo, copy-paste into the BigQuery UI and run it!
Let’s break down the SQL into smaller chunks for easy understanding.
Let’s set the values for the 7 declared variables. The first 4 variables will need to be set manually by the individual running the query.
The first variable (_TIMEZONE) should represent your local TimeZone.
The second (_RANGE_START_TS_LOCAL) and third (_RANGE_END_TS_LOCAL) variables will represent the range of time using your local TimeZone which you want to analyze.
The fourth variable (_RANGE_INTERVAL_SECONDS) represents the size of the time intervals you want in which a single Point in Time (a second per Interval) will be collected.
Note – It is very important to limit the X-Axis (Time) data points to a reasonable number (something between 60 and 360); otherwise, you will have troubles with the size of the query result export and/or you will have issues with having too many X-Axis data points in the final graph.
For analyzing what happened for a 5 minute range of time, it would be appropriate to set the _RANGE_INTERVAL_SECONDS = ‘1’, as this would produce 300 data points on my X-Axis…one per second for every second in my defined 5 minute (300 second) range of time.
For analyzing what happened for a 1 hour range of time, it would be appropriate to set the _RANGE_INTERVAL_SECONDS = ‘10’, as this would produce 360 data points on my X-Axis…one per every 10 seconds in my defined 1 hr (3600 second) range of time.
On the same note, for analyzing what happened for a 24 hour range of time, it would be appropriate to set the _RANGE_INTERVAL_SECONDS = ‘300’, as this would produce 288 data points on my X-Axis…one per every 300 seconds in my defined 24 hr (86,400 second) range of time.
In summary, we are encouraging the user to sacrifice ‘accuracy’ for larger time ranges in order to produce a more ‘readable’ chart. While this chart is 100% accurate as of a second in time, if we only choose 1 second to visualize for every 300 seconds, then we are producing a chart that is a sample representation of actual slot consumption and concurrent query counts for the range of time being analyzed.
The fifth variable (UTC_OFFSET) represents the offset between your locally defined TimeZone and UTC. Let’s make it an expression as opposed to a manually defined literal value because of issues with Daylight Savings Time (DST); otherwise, the user would have to remember to change the literal offset throughout the year as DST changes.
The sixth (_RANGE_START_TS_UTC) and seventh (_RANGE_END_TS_UTC) variables represent the range of time you want to analyze converted into UTC time using the derived _UTC_OFFSET value.
You might be asking yourself, “Why spend so much time declaring and setting variables?” In short, this has been done for readability/supportability and to minimize the amount of manual changes needed every time you run this code for a new range of time.
Now that all of our variables have been declared and set, we can finally start to analyze the query. The query is built from two derived sets of data aliased as ‘key’ and ‘query_info’.
The ‘key’ derived table
The ‘key’ derived table is creating a one column result set with a single row for every interval (_RANGE_INTERVAL_SECONDS) that exists within the range of time you are wanting to analyze. We are able to do this with a couple of really neat array functions. First, we leverage the GENERATE_TIMESTAMP_ARRAY function which will produce an array (aliased as POINT_IN_TIME) of timestamps between the _RANGE_START_TS_UTC and _RANGE_END_TS_UTC variables for each interval of time defined in _RANGE_INTERVAL_SECONDS.
For example:
_RANGE_START_TS_UTC = ‘2021-08-05 14:00:00.00000’
_RANGE_END_TS_UTC = ‘2021-08-05 15:00:00.00000’
_RANGE_INTERVAL_SECONDS = 60
Using the above inputs, the GENERATE_TIMESTAMP_ARRAY will produce the following array with 61 elements:
In order to convert this array of 61 elements into rows, we simply use the UNNEST Function.
Note: The ‘key’ derived table could be considered optional if you are 100% certain that queries were actively running every second of the time range being analyzed; however, if any point in time exists in which nothing was actively running, then your final chart wouldn’t have a datapoint on the X-Axis to represent that point(s) in time…which makes for a misleading chart. So, to be safe, it is strongly encouraged to use the ‘key’ derived table.
The query_info derived table
The ‘query_info’ derived table is relatively straightforward.
In our example, I want to pull Slot Seconds (period_slot_ms / 1000) and Query count information from the INFORAMTION_SCHEMA.JOBS_TIMELINE_BY_PROJECT object for every job for each second that matches the TimeStamps generated in the ‘key’ derived table.
In this particular query, the ‘GROUP BY’ statement isn’t needed…because every job should have a single row per second; therefore, nothing needs to be aggregated, and I simply could have hard-coded a ‘1’ for Query_Count. I left the ‘Group By’ in this example in case you aren’t interested in analysis at the Job_ID level. If you aren’t, you can simply comment out the ‘Job_ID’ field in ‘query_info’, tweak the ‘Group By’ statement accordingly, and comment out ‘Job_ID’ in the outermost query. In doing so, you would still be able to perform user_email level analysis with the final result set with accurate Slot Sec and Concurrency Query Count data.
Filters used in the query
We have six filters for this query.
First, in order to minimize the IO scanned to satisfy the query, we are filtering on ‘job_creation_time’ (the underlying value used to partition this data) where the min value is 6 hours earlier than the defined start time (to account for long running jobs) and the max ‘job_creation_time’ is less than the defined end time.
Second, we want to only look at rows with a ‘period_start’ timestamp within our defined range of time to be analyzed.
Third, we only want to look at job_type = ‘query’.
Fourth, in order to avoid double counting, we are excluding ‘scripts’ (as a script parent job_id contains summary information about its children jobs).
Fifth, and this is a personal preference, I don’t want to analyze any rows for a job if it isn’t actively using Slots for the respective Point in Time.
The sixth filter doesn’t actually change the # of rows returned by the final query; however, it provides an increasingly large performance improvement for queries as the value of _RANGE_INTERVAL_SECONDS grows. We first calculate the difference (in seconds) between the _RANGE_START_TS_UTC and the TimeLine object’s Period_Start timestamp. Next, we MOD that value by the _RANGE_INTERVAL_SECONDS value. If the result of the MOD operation does not equal 0, we discard the row, as we know that this respective Timestamp will not exist in the ‘key’ timeline built.
Note – Yes, these rows would have been discarded when we JOIN the ‘key’ and ‘query_info’ table; however, this requires shuffling a lot of potentially unnecessary rows. For instance, if the _RANGE_INTERVAL_SECONDS is set to 300 and a query ran for 300 seconds, then we’d be joining 300 rows of ‘query_info’ data for that job only to filter out 299 rows in the subsequent JOIN to the ‘key’ table. With this filter, we are pre-filtering the 299 unnecessary rows before joining to the ‘key’ table.
Outermost query
In the outermost query, we will LEFT OUTER JOIN the ‘key’ timeline table to our pre-filtered ‘query_info’ table based on the cleaned up TimeStamp values from each table. This needs to be a LEFT OUTER JOIN versus an INNER JOIN to ensure our timeline is continuous, even if we have no matching data in the ‘query_info’ table.
In terms of the select statement, we are using our previously defined _UTC_OFFSET value to convert the UTC Timestamps back to our defined TimeZone. We also select the job_id, user_email, proejct_ID, reservation_ID, Total_Slot_Second, and Query_Count from ‘query_info’. Note, for our two metric columns, we are filling in Null values with a 0 so our final graph doesn’t have null data points.
Plotting the chart
Now that we have a query result set, we need to copy & paste the data to Google Sheets or any equivalent Spreadsheet application. You could follow the below steps
Add a Pivot Table ( For Google Sheets on the menu bar, Data→ Pivot Table).
In the table editor – Period_Ts goes in as Rows, Total_Slot_Sec and Concuurent_Queries goes as Value.
Once the Pivot Table is created, it is time to add a chart/visual. ( For Google Sheets on the menu bar, Insert→ Chart)
Once the chart is inserted, you will see that the concurrent queries and Total_Slot_Sec are on the same axis. Let’s put them on a different axis i.e add another Y axis.
Double click on the chart and select customize. Click Series.
Select “Sum of Total_Slot_Sec” and Select Left Axis on the Axis selection.
Select “Sum of Concurrent_Queries” and Select Right Axis on the Axis selection.
Lastly, change the chart type to a line chart. That’s it, your chart is ready!
With a little slicing and dicing, you could also produced a Stacked Area Chart By User with Slot Seconds
Analyze / visualize slot consumption and query throughput for an interval of time
The second part of this blog is to monitor the average slot utilization and query throughput for an interval of time. This query will look very similar to the previous query. The key difference is that we’ll be measuring query count throughput for an interval of time (as opposed to a Point In Time.) In addition, we’ll measure Total Slot Seconds consumed for that Interval, and we’ll calculate a Pct_Slot_Usage metric (applicable if you are using fixed slots) and an Avg_Interval_Slot_Seconds metric.
Main SQL
Here is the SQL script, copy-paste into the BQ UI and run it!
Remember: Change the ‘Region’ qualifier if you aren’t part of the ‘region-US’:
Just like the previous one, let’s break down the SQL into smaller chunks for easy understanding.
Declaring and setting variables
This variable declaration segment is exactly the same as the previous query but with three additions. We will be using a variable named _RANGE_INTERVAL_MINUTES instead of _RANGE_INTERVAL_SECONDS. We have added two new variables named ‘_SLOTS_ALLOCATED’ and ‘_SLOTS_SECONDS_ALLOCATED_PER_INTERVAL’.
After declaring, it is time to set these variables.
We’ll discuss the 3 new variables in this section.
_RANGE_INTERVAL_MINUTES
As with the last query, the interval size will determine the number of data points on the X-Axis (time); therefore, we want to set the _RANGE_INTERVAL_MINUTES value to something appropriate relative to the Range of time you are interested in analyzing. If you are only interested in an hour (60 minutes), then a _RANGE_INTERVAL_MINUTES value of 1 is fine, as it will provide you with 60 X-Axis Data Points (one per minute). However, if you are interested in looking at a 24 hour day (1440 Minutes), then you’ll probably want to set the _RANGE_INTERVAL_MINUTES to something like 10, as it will provide you with 144 X-Axis Data Points.
_SLOTS_ALLOCATED
Regarding _SLOTS_ALLOCATED, you will need to determine how many slots are allocated to a specific project or reservation. For an on-demand project, this value should be set to ‘2000’. For projects leveraging Flat Rate Slots, you will need to determine how many slots are allocated to the respective project’s reservation. If your reservation_id only has one project mapped to it, then you will enter a _SLOTS_ALLOCATED value equal to the # of slots allocated to the respective reservation_id. If multiple projects are linked to a single reservation_id, I’d recommend that you run this query at the ‘ORG’ level (filter on the appropriate reservation_id) and set the variable with the # of slots allocated to the respective reservation_id.
_SLOTS_SECONDS_ALLOCATED_PER_INTERVAL
This is simply your interval length converted to seconds multiplied by the number of slots allocated. This value represents the total number of slot seconds that can be consumed in an interval of time assuming 100% utilization.
Now that all of our variables have been declared and set, we can finally start to analyze the query.
There are 5 key differences between this query and the “Point In Time” query we reviewed earlier.
First, we will not be pulling information at a job_id level. Given the intended usage of this query, including the job_id granularity would produce query results which would be difficult to dump to a spreadsheet.
Second, we will be pulling all timeline values (seconds) within our defined _RANGE_INTERVAL_MINUTES instead of a single second. This will result in a much more computationally intensive query as we are aggregating much more data.
Third, we are counting all queries that ran during our defined_RANGE_INTERVAL_MINUTES instead of just counting the queries actively consuming CPU for a given second in an interval. This means that the same query may be counted across more than one interval and the ultimate ‘Query_Count’ metric represents the number of queries active during the interval being analyzed.
Fourth, we will be calculating a custom metric called ‘Pct_Slot_Usage’ which will sum all slots consumed for an interval and divide that by the number of slots allocated (_SLOTS_ALLOCATED_PER_INTERVAL) for an interval. For example, for a 10 minute interval given an allocation of 2000 slots, _SLOTS_SECONDS_ALLOCATED_PER_INTERVAL would equate to 1200K Slot Seconds (10 minutes * 60 seconds * 2000 slots.) During this interval, if we used 600K Slots Seconds, then 600K/1200K equals a ‘Pct_Slot_Usage’ of 50%.
Fifth, we will be calculating another custom metric called ‘Avg_Interval_Slot_Seconds’ which will sum all slots consumed for an interval and divide it by _RANGE_INTERVAL_MINUTES * 60 in order to calculate the average slot consumption in Slot Secs for the interval of time. For example, if a user were to consume 30,000 Slot Seconds in an interval of 5 minutes, the Avg_Interval_Slot_Seconds would equal 100 (30,000 slots consumed / (5 min interval * 60 seconds per minute)).
Note: It is possible (even likely) that the ‘Pct_Slot_Usage’ metric could have a value greater than 100%. In the case of an on-demand project, this can occur due to the inherent short query bias built into the scheduler.
For the first 15-30 seconds of a query’s execution, the scheduler will allow a query to get more than its ‘fair share’ of Slot Seconds (relative to project concurrency and the ‘2000’ slot limit imposed on on-demand projects.) This behavior goes away for an individual query after 15-30 seconds. If a workload consists of lots of ‘small’ and computationally intensive queries, you may see prolonged periods of Slot Consumption above the ‘2000’ slot limit.
In the case of a project tied to a reservation with Fixed Slots, you may see the ‘Pct_Slot_Usage’ metric exceed 100% if Idle Slot Sharing is enabled for the respective reservation and if idle slots are available in the respective Org.
As with the previous script, the outermost query is built from two derived sets of data aliased as ‘key’ and ‘query_info’.
The ‘key’ derived table
Same as the first query, this derived query is identical to the one used in the previous example.
The query_info derived table
This derived query is very similar to the one in the previous example. There are 4 key differences.
First, we are not selecting JOB_ID.
Second, we are looking at all the TimeLine seconds for an interval of time, not a single Point In Time (Second) per Interval as we did in the previous query.
Third, in order to get an accurate count of all jobs that ran within an interval of time, we will run a Count Distinct operation on Job_ID. The ‘Distinct’ piece ensures that we do not count a JOB_ID more than once within an interval of Time.
Fourth, in order to match our ‘Period_TS’ value to the key table, we need to aggregate all minutes for an interval and associate that data to the first minute of the interval so that we don’t lose any data when we join to the key table. This is being done by some creative conversion of timestamps to UNIX seconds, division, and offsets based on which minute an interval starts.
Outermost query
In the outermost query, we will again LEFT OUTER JOIN the ‘key’ timeline table to our pre-filtered ‘query_info’ table based on the cleaned up TimeStamp values from each table. This needs to be a LEFT OUTER JOIN versus an INNER JOIN to ensure our timeline is continuous, even if we have no matching data in the ‘query_info’ table.
In terms of the select statement, I’m using our previously defined _UTC_OFFSET value to convert the UTC Timestamps back to our defined TimeZone. I also select the user_email, proejct_ID, reservation_ID, Total_Slot_Second, Query_Count, and calculate Pct_Slot_Usage and Avg_Interval_Slot_Seconds.
Similarly like the first query, here are some sample Charts you can create from the final query result:
I hope you found these queries and their explanations useful..albeit, maybe a bit wordy. There was a lot to unpack. The origin of these queries go back to something similar we use to run on a totally different DBMS. With BigQuery’s scripting support and Nested Array capabilities, the newly ported queries are much ‘cleaner’. They are easier to read and require many less manual changes to the parameters. Look out for our future blogs in this series.
With more than 2.5 million customers, Italian utility company A2A is committed to delivering electricity, gas, clean water, and waste collection every day. More recently, the company made another significant commitment: To incorporate the principles of the “circular economy” into its way of doing business — part of the UN 2030 Agenda’s Sustainable-Development Goals — all while also aiming to double its client base by 2030. Growing rapidly but sustainably requires operating as efficiently as possible at every level of the organization, from operating smart meters to generating accurate demand projections. That’s why A2A chose to deploy its SAP S/4HANA ERP and the SAP BW/4HANA data warehouse on Google Cloud.
Roadblocks to innovation
Instead of a linear consumption model that starts with raw materials and ends with use and disposal, the circular economy is a continuous cycle that emphasizes repair, recycling, and the creation of materials rather than their disposal. To take an example from A2A’s own success story: The company keeps 99.7 percent of collected waste out of landfills.1 Of the UN’s sustainability goals, A2A is committing to the three most relevant to its industries:
Ensuring availability and sustainable management of water and sanitation for all
Ensuring sustainable consumption and production patterns
Protecting, restoring, and promoting sustainable use of terrestrial ecosystems
Achieving A2A’s sustainability and customer-first strategies requires high scalability, rapid data ingestion, and rich, accurate analytics. None of this could be reliably supported with the company’s legacy on-premises SAP and Data Warehouse, especially given A2A’s projected growth and the increasing complexity of the data landscape, including IoT deployments and energy market liberalization.
Provisioning data infrastructure was also slow and complex. Simply adding a new metric could require increasing capacity by an order of magnitude. And analytical and transactional data lived in siloes, which created a fragmented and out-of-date view of each customer across sales and customer support teams. A2A’s fragmented data also made it difficult to take proactive action when changing priorities or processes required shifting focus from one data source to another.
With a data warehouse that refreshed only once every 24 hours, simple processes such as responding to a customer calling because their power has been cut off due to an unpaid bill became cumbersome.
Scalability was also a concern. With the on-premises solution, A2A needed to define the budget for its data warehouse over a two-year timeframe, but the rollout of new electricity meters — each sending data every 10 minutes — across Italy made those data requirements hard to predict.
The move to the cloud: From monolith to microservices
The move has been a giant step forward in A2A’s goal of meeting its data-driven, customer-centric strategy. In deploying its SAP systems to Google Cloud, A2A can take advantage of a highly flexible hybrid environment and powerful data management and analytics. It can replicate data from Salesforce, SAP, and other systems in BigQuery, which operates as a data lake with Google Cloud SQL, connected directly to Google Analytics and Google Ads for data-driven customer service, decision-making, and marketing.
“From BigQuery we can feed relevant information directly to the people who need it. Our customer operators work on Salesforce, so we use an OData protocol to embed real-time data in that platform. Elsewhere, we present the information through a dashboard, or with a BI component delivering one-page reports.” —Vito Martino, Head of CRM, Marketing and Sales B2C & B2B, A2A
By running SAP on Google Cloud, A2A can also count on an infrastructure platform that provides:
Scalability. The robust data architecture on Google Cloud adapts to shifting and increasing demands without compromising on speed or availability, so A2A doesn’t have to worry about over- or under-provisioning as the rollout of smart meters proceeds.
Speed. The new A2A data solution refreshes every five minutes instead of 24 hours, so the company can respond to its customers’ needs without delays. Customer operators working in Salesforce now receive real-time data from Google BigQuery so that, when a customer calls, operators can see accurate information in seconds. They can now offer value-added services and sustainable options tailored to the customer’s needs, from energy consumption to their preferred method of communication.
Availability. With microservices orchestrated by Google Kubernetes Engine, the team can update the solution through continuous integration and delivery (CI/CD), eliminating the need for downtime when changes are required.
Security and control. The A2A IT team uses Google Kubernetes Engine to orchestrate clusters of instances on Google Compute Engine, with Google Cloud Load Balancing and backups on Google Cloud Persistent Disk. Google Cloud Anthos ensures operational consistency across on-premises and cloud platforms.
Ready to grow the sustainable way
By moving to Google Cloud — the industry’s cleanest cloud, with zero net emissions — A2A is ready to grow quickly while locking down the efficiency it will need to meet its ambitious sustainability goals. “To bring sustainable utilities to market, we need to be both responsive to our customers and responsive to the internal needs of A2A,” explains Davide Rizzo, Head of IT Governance and Strategy at A2A. “Understanding what customers need in detail means we can improve their services and reduce their environmental impact at the same time.”
Learn moreabout the ways Google Cloud can transform your organization’s SAP solutions with scalability, speed, and advanced analytics capabilities.
In recent years, organized sports have been steadily changed by big data. The news programs and sports updates shown on television have been made to be more entertaining, partly because of research conducted and the information analyzed. This information is usually gained from viewers and the wider public.
More sports companies are likely to invest in big data in the future. The sports analytics market will be worth $10 billion by 2028.
Many people are unaware of the importance of big data or even what it is. In simple terms, big data is a term used to describe large volumes of data that are difficult to manage. This data may overwhelm businesses every day in structured or unstructured forms. Smart organizations use this data to improve their business models and make life better through analysis.
When it comes to sports, big data plays an essential role in the execution of competitive events and audience engagement. For instance, the branding and marketing experts of the Superbowl would benefit from big data when planning the promotion and organization before it takes place. Kenneth Taylor wrote an insightful article on the ways that big data is transforming the Superbowl.
It is also how a skate manufactures may begin to offer wide roller skates. Requests and searches for a particular product would adjust the way organizations do business after they have analyzed consumer information. Sport is no different.
Big Data and Skating
Data analytics technology has been applied to the skating industry, especially when it comes to scouting. Stats and pure numbers have become invaluable to talent prospecting in recent years, as companies are moving away from traditional scouting which depends on the evaluation of strength, speed, agility and other traits. Sport management professionals are now starting to see the benefit of analyzing large amounts of readily available data.
Big Data and Sports Broadcasting
Sports broadcasting and commentary has been evolving for some time. Sports Programming can now engage the viewer by creating a more compelling viewing experience instead of simply reporting the statistics and facts. Many broadcasters rely on statisticians to relay information about athletic performance. This information is more often an explanation in relation to other players. Easy to understand charts and graphs may also be used to explain and analyze the data.
Big Data and Sporting Strategies
Team or individual sports need good strategies to be successful. On a professional level, athletes must rely heavily on strategy especially as it relates to competition and opposing teams. Big data allows coaches to analyze winning strategies and weaknesses of the competition. It also allows coaches to analyze the performance of the team as a whole based on their history of wins and losses. Coaches are also able to create unpredictable strategies based on what they have done before thereby giving them the elements of surprise in upcoming games.
Audience Engagement
Revenue can be increased by engaging fans which is why broadcasters along with sports officials usually look to engage their audiences thereby increasing views and earnings. Big data has aided this endeavor greatly because of fantasy sports. The truth is that data analytics helps companies understand their customers.
Because of fantasy sports fan engagement has been increased and become more profitable across any sports you can think of. Fantasy sports allows the participant to create virtual franchises that are professional. These virtual franchises are based on actual athletes. For example, fantasy football can account for at least 25 million participants that are active and mostly reside in the US.
With sport analytics and the analysis of audience engagement, organizers are able to make life game experience has more enjoyable while also maintaining and increasing the sponsorship and participation of fans.
Athlete Performance
Big data can help athletes track and improve their performance, especially for ultra-competitive sport at the Olympic level. Many of these athletes train full time and will try just about anything to increase their performance. This is where big data comes in.
Coaches can now use training data on younger athletes with the aim of figuring out why elite athletes succeed. Coaches and athletes can learn about the most important element to focus on and train accordingly. They can also learn about the obstacles faced by elite athletes when training and know beforehand how to treat with them.
Coach Decisions
Teams now use big data to make crucial decisions about team players and who should be recruited. Data analysis on past players can determine if future ones are the right fit. For instance, the movie Moneyball portrays a coach who uses data to find undervalued players who are quite talented. This practice is commonplace in sports like basketball cricket, soccer, and football.
To Sum It All Up
Big data is being used all around the world and not just in sports. However, we have barely scratched the surface when it comes to its application. Experts predict that big data will be used much more extensively. The data collection methods are also improving with the popularity of apps and other technological advancement. Big data analytics seems as if it is here to stay, so we can expect to see it more prominently in the skating field as well.
AI is changing the future of the manufacturing sector. According to one survey, 76% of manufacturing companies have either deployed AI or are in the process of developing an AI system to use in the near future.
More and more the interaction between humans and machines becomes a hot topic in the manufacturing world. Leading manufacturers use AI to integrate automation in their production processes wherever possible, in order to handle repetitive tasks in a more efficient manner. Furthermore, automation allows them to track data and to adjust their systems for even higher productivity and work efficiency. There is no disputing the fact that AI technology has been a force of chance for the manufacturing sector. Among many other benefits, AI is helping with robotic polishing.
Nevertheless, manufacturing companies still rely on manual workers, but they use them to handle complex problems and operations. The real benefit of AI is not that is reduces the need for workers altogether. Rather, AI can help manufacturers get more value out of their existing employees.
Augmented reality is the solution to empower factories with unequaled tracking and guidance abilities, as well as with opportunities to gain a deeper understanding of their various operations. It is one of the biggest breakthroughs in applied AI technology.
Due to research on human and machine collaboration, experts are able to design new and better ways of interacting with robots through AI algorithms. Such processes and systems are now more natural than ever before, as they can seamlessly be integrated into the working environment.
How Augmented Reality Add A Deeper Layer To Work Environments through the Use of AI
Research like this shows that manufacturing companies can use advanced AI automation technologies and AR tools to their advantage. Aircada AR helps them identify challenges and find the best solutions to increase their efficiency. They use 3D sensors and motion cameras to identify minute data points with AI. This level of accuracy allows them to identify the exact moments when inefficiencies occur during the production process, thus allowing experts to find the best solutions to optimize their operations.
Here are a few of the main benefits of using AI-driven augmented reality in manufacturing enterprises.
1. Ideal Solution to Training And Upskilling Challenges
AR solutions that use complex AI algorithms can help manufacturing companies to train and upskill their employees with a maximum of efficiency and with the minimum costs possible. Whatever the size of your business, you can scale digital AR work instructions to match your needs. You can develop custom training for each and every individual in your factory, as well as programs that target enterprise levels. You can simply switch between programs as needed with AI management tools, in order to stay relevant and to make the most out of your investment in AR training tools. You’ll be able to provide effective training to both beginners and extremely experienced technicians.
Digital work instructions offer the benefit of standardized training. While human trainers may deliver their programs in more or less effective ways, digital instructions are always going to be the same, as machines don’t get ill and they aren’t subject to emotional fluctuations. Therefore, your AI has the advantage of being far more objective. By connecting all systems, you can ensure that information gets to its recipients right on time, and without any lapses.
2. Digital Work Instructions
In the same way, AR work instructions guide your employees through standardized processes, thus minimizing the risk of error. Rather than having your workers read about multiple actions at once, you can have an AR tool to project work instructions directly onto the work surface. Workers will get their guidance as they need it, step after step, until they complete the task at hand. This reduces time spent working and leaves no room for error, since workers have to put up with lower cognitive loads.
3. Product Variation
You only need to write your work instructions once. Then, you can add them to every AR system in your factory. Workers will be able to adapt to the different variations of a product much faster and with fewer glitches. A barcode scan is everything you need to allow your AR software to connect to a PLC system or to your enterprise MEC to find and use the proper work instructions for that specific situation. Automation is the future and companies that don’t adapt to it will be the first to disappear. The future belongs to those who are flexible enough to integrate all of these modern technologies into their production processes.
4. Quality Assurance
AR solutions that are guided with AI can incorporate inspections that don’t hinder effective production time. You can save a lot of money and time this way.
5. Ergonomics
AR displays digital overlays onto the work surface, allowing you to gain in efficiency. This is one of the biggest benefits of using AI in the manufacturing sector.
Data science is a broad field that can help organizations glean significant insights into various aspects of their operations. Whether it’s uncovering truths about customer buying habits or discovering new ways to make teams collaborate more efficiently, data science can be an extremely useful tool to all who take advantage of it. This is why the demand for data scientists is growing so rapidly.
Unfortunately, many have a skewed idea of what data science is and its usefulness as a tool and field of study. For those who are new to data science, it can be helpful to dispel these myths in order to get a deeper understanding of the field and its benefits. Here are 7 misconceptions about data science that you should be aware of.
Data Science Isn’t Useful to Small Businesses
When the average layman thinks of data science, it’s likely that they picture large organizations that have millions of dollars at their disposal. This couldn’t be farther from the actual reality of how accessible data science can be to small businesses.
In fact, data science can help small business owners increase their sales and the efficiency of their employees. By utilizing insights gleaned from data science, small business owners can track what their best-selling products are and can convert more customers than they would without these insights.
You Have to Be a Math Genius to Utilize Data Science
Many of the general public believe that one has to be some sort of math genius in order to utilize data science when, in fact, this couldn’t be farther from the truth. Data scientists are well versed in various programming languages, such as Java or Python. These programming languages function much more like languages than they do mathematical algorithms.
Though there is a learning curve when learning a new programming language, it doesn’t take an abundance of innate math skills to do so. As long as one is willing to put in the time and effort to learn a programming language, one can experience the joy of data science and all of the wonderful insights that it has to offer.
Data Science Costs an Arm and a Leg
For many people, the phrase “data science,” has the connotation of being an expensive and inaccessible tool. In reality, this is far from the case. Data science can be utilized in accessible and inexpensive ways with various services and resources. Individuals and business owners don’t have to hire a full-time data scientist to experience the benefits that data science has to offer.
Rather than buying into the myth that normal people can’t afford to benefit from data science, those looking to improve various aspects of their organization’s operations should look into data scientist tools and take their research and efficiency to the next level.
Data Science Is Too Complicated for “Normal People”
Many, unfortunately, are under the impression that data science is too complicated for them to utilize. This couldn’t be farther from the truth, and in fact, data science can be utilized by just about anyone. Tools and resources that utilize data science principles have become easier and easier to use in the last decade, and anyone with an internet connection has access to these tools.
Rather than letting data science myths cloud one’s judgment, those looking for options to increase the productivity and profitability of their organization or business should look into what data science can do to make their operations better.
There Aren’t Many Jobs in Data Science
Those unfamiliar with the field of data science may be tempted to think that the field is small and the number of jobs out there in the field are limited. This, in fact, is untrue and the field of data science is growing at a tremendous rate.
Examples of jobs available in the field of data science include computer system analysts and database administrators, among plenty of others. Data science is a growing field and those with an interest in it can find lucrative careers in the industry.
Data Science Is Just a Fad
Many who are unfamiliar with data science may believe that the field is nothing more than a fleeting fad. This is false, and more and more organizations are incorporating data science into their operations to boost sales and increase productivity.
Though data science is a newer field compared to some others, it is not one that is going anywhere any time soon. Data science has proved itself to be a useful field that has significant benefits for those who utilize its tools and resources.
Data Science Has No Effect on Our Lives
Those who believe that data science has no effect on their lives would likely be surprised to find out that many of the technologies that they use everyday require data science to work. These technologies include fitness trackers and GPS, which almost everyone utilizes on a regular basis. It can be useful for the public to understand that the applications of data science impact their life on a regular basis and that it has become an important part of most people’s day-to-day activities.
Data Science Is a Useful Field That’s Here to Stay
Data science and its plethora of applications have benefited our lives and organizational practices in many ways. Given the profound impact that it has had, data science seems like it is a field that will be around for decades to come. Those who are dismissive of the field will soon have to reckon with the tremendously powerful and beneficial effects that data science can have on our lives.
Whether one is a small business owner or an industry titan, data science can be a beneficial tool that can help improve operations and uncover interesting insights.
A lot of factors go into building a business, but online reputation is a huge part of it. A lot of organizations don’t recognize the role that AI technology can play when it comes to business management, improving customer relationships and managing your business’s online profile.
Customers tend to Google an organization prior to engaging with their services. As such, a company needs to focus on what they offer customers but also on what their online status is. It’s hard to have success with prospective customers when your online profiles don’t promote success. This is one of the reasons they use AI to manage their profiles on Instagram and other platforms.
How Can Your Online Profile Be Affected?
There are a number of different aspects that can affect a company’s online profile. Many organizations can realize great benefits from managing their online profiles in order to support their brand. This is key when it comes to attracting new customers. Fortunately, AI can make it a lot easier for them.
Throughout this article it will be discussed in more detail how different departments in your company can benefit from using artificial intelligence to manage their online profile.
What Impact Can Artificial Intelligence have on Your Businesses Online Profile?
Artificial intelligence technology can have a large impact on how a business manages its online profiles. If you are relying on simple manual tracking processes, then this can be difficult to stay on topic due to the large amounts of online information and data about your business which is out there. Instead, machine learning algorithms can be much more effective when tracking online reviews.
AI systems can help with the overall management of your businesses online profiles in that they can:
Reduce the risk of human errorHelp with managing time so your employees’ skills can be used elsewhereImprove the efficiency of your business through the use of business intelligence
How Artificial Intelligence Can Help with Managing Online Profiles
So, what are the specific ways that artificial intelligence can help improve business management and more specifically the management of online profiles?
Help Stay on Top of Customer Relations
A lot of businesses are trying to improve the service they offer when it comes to offering customer care. An effective way that this is being achieved is by automating customer support and focus on getting answers to customers all over the world as quickly as possible. This is great for marketing purposes as a satisfied customer can work just as well as ads, given they essentially go on to act as a brand ambassador.
The benefits of providing a positive experience to customers is huge. In doing so you will be ensuring your reputation online remains positive, which is great for acquiring new clients.
Humans can only do so much in the way of helping customers and a lot of companies now find using an AI system to be more effective. Examples as to why include the following:
Chatbots
Chatbots have technology that has been advancing a lot in previous years and they can now effectively provide customer support to people all around the world with efficiency.
These robot advisors can also use machine learning to collect data and identify patterns through the support they offer. Using these repetitive tasks, AI can help in business today by providing solutions to customer queries quickly.
Automated Replies
Robotic process automation means that an automated response to certain queries can be provided. Natural language processing will ensure the response is good, so a customer is able to message a business and get a response immediately.
Content for Personalized Emails
Email marketing can be a very effective way to generate new clients. You can update them on different trends within your industry and use this form of marketing to promote new products and services you offer.
These are much more effective if the content within said emails are catered towards the individual customer but doing this, as you may expect, can be time consuming and complex. Artificial intelligence can use data analytics to understand what a customer is interested in and then cater the email sent to them in light of this. This feature will give your business the competitive edge over others.
Provide Customers with a Personalized Experience
Artificial intelligence and machine learning are able to store a customer’s data, specifically, how they used your site when they visited. This is great when it comes to the development of your relationship with that customer as when they visit again, you can make their experience on your website more personalized.
Providing a personal experience is key because it helps your clients feel less like a client and more like a valued member of your business. It means that in the future, they are going to be a lot more likely to come back to your site, bearing in mind the personal experience that they received.
Create a Positive Word of Mouth
Marketers use their skills and spend a great deal of time pondering over the most effective way to get a product in front of customers. There are several means available but simple word of mouth is one of the most effective solutions out there.
When people take to the web and talk positively of your business, they are making it a lot more likely people will engage further with your organization as they can see a trusted review of what you do.
AI can help with business management as it will keep an eye out for what people are saying about your business. As such, you can promote positive reviews and then also see to the grievances quickly of negative reviews. Having quick access to this data is crucial for the future development of your business as it means you will be able to build a positive reputation online which will help draw in more clients.
Assist With Social Media Marketing
A large demand for different products and services now comes because of what people see on social media. As such, when it comes to business development, having a presence online is very important. Building such presence is time consuming.
AI can help process large amounts of data and complete tedious tasks that pertain to social media, which marketers would normally have to do previously. Employees will no longer need to worry about carrying out the tasks that they will have had to do previously in an effort to build on their business’ social presence.
The Creation of Content on Social Media
Artificial intelligence can use deep learning as a means to create automatically generate content for their social media page. This process is done by ai systems that can automate the sharing of content across channels, including all the necessary hashtags in the process. It can also schedule when to post such content with a degree of accuracy better than that which humans can deliver.
Social Media Listening
Machine learning can also listen out what people are saying about a brand on social media and collect that data. When this is relayed back to you, you are going to be in a much better position to work out how you effectively alter your online image to help with sales.
When all of the data collected here is used effectively, you will be able to:
Keep track of all of the different mentions of your brand around the worldHelp to identify patterns and understand emerging trendsDiscover new audiencesKeep a hold on what your brands reputation is like
Finding Influencers
Having a good influencer can help build your brand on social media and artificial intelligence ca assist with discovering which you should use. It will collect data on influencer platforms so that you have a better understanding of who gets the most engagement and as such, who can help your brand more.
How Can You Get Started Using Artificial Intelligence?
Artificial intelligence has come a very long way in the past decade to the point that it can now be used as an effective means for a business to manage their online profiles. This means on social media and also with general business management as it becomes easy to see how they are perceived by potential customers online.
If you would like to begin using artificial intelligence for these reasons, then you should consider enlisting the help of a business such as Yoono. Yoono are able to use artificial intelligence as a means to understand how your business is being perceived and as such, help you understand what your future marketing strategies need to focus on to improve your reputation.
Digital transformation has been a goal for many organizations in recent years, and the shift to remote and hybrid working arrangements has only made this desire to future-proof their business more immediate. However, this transition isn’t easy and wouldn’t be possible without major advances in big data technology.
Digital adoption has been defined as the reinvention of a company through the optimization of legacy systems and utilization of new technologies. Big data has been the epicenter of digital adoption in recent years. This is why companies around the world spent over $162 billion on big data last year.
The entire process entails more than that, but the adoption of new technologies and their integration into business workflows is key. To ease the transition, companies have been leveraging big data and incorporating it into their digital adoption platforms to help both employees and customers get the best possible experience.
Big Data is the Foundation of Digital Adoption
What is a digital adoption platform? A digital adoption platform (DAP) is a software solution that helps facilitate learning of new systems through the use of data analytics and ensure the simplification of processes and step-by-step guidance. It provides contextualized information as users navigate applications to help familiarize them with its features and make them proficient in its use as quickly as possible.
Integrating big data frameworks into a digital adoption platform is has become a game-changer, as businesses are projected to spend $1.8 trillion in 2022 and $2.8 trillion by 2025. It’s instrumental in making the most out of your technological investments and ensuring that your employees have a seamless experience using data analytics and other digital business tools.
It will also help in onboarding new staff so they can hit the ground running and provide a system where you can monitor, measure, and improve the overall user experience. Your digital adoption platform should also provide intelligent insights via data analytics, which will help with process management and setting up best practices across the organization. The increase in employee engagement and productivity also result in increased customer engagement and enhanced experiences.
Should You Use a Digital Adoption Platform?
The unpredictability of today’s business landscape has pushed organizations to be more open about new and more innovative technologies, including data analytics tools. This rethinking of their digital strategy is a good thing because it allows them to be more competitive and encourages them to provide additional value to the consumer.
More than 60% of businesses around the globe now believe that they need to build new digital businesses or reinvent themselves as digital-first enterprises through the use of AI and data analytics. Economic viability has become dependent on future-proofing your business—hence the need for digital adoption and a platform that will make it happen.
Before investing in a digital adoption platform, it’s vital that you have a plan on how to structure your company’s digital adoption process. Adoption should be made as seamless as possible so that there is less resistance and more enthusiasm for reaping its long-term rewards with valuable data analytics tools. Getting members of the organization into the right mindset is a prerequisite; otherwise, the transition process will only serve to magnify existing shortcomings and let it overshadow the potential benefits.
Below are a few reasons why a digital adoption platform with sophisticated data analytics capabilities should be your next investment.
Digital adoption makes your business more competitive. It used to be that big data technology was a differentiator on the business realm; now, the question isn’t what technology you have but how you use that technology to delight employees and customers. Ultimately, the goal of digital transformation is to help you outplay your competitors with valuable data analytics tools, and this can’t be achieved without an effective digital adoption process.Digital adoption makes employees more resourceful and productive. Successful digital adoption helps make processes faster and tasks easier. This, in turn, gives employees more time to be more creative and resourceful in how they do their jobs. This helps them be more proficient with what they do and get more satisfaction from their jobs. Most employees also expect their workplaces to have the digital tools they need to make their lives easier and the company’s operations as seamless as possible.Digital adoption upskills employees and makes them more valuable. Hiring today is different from hiring years before; today hiring any member of your organization not only means you’re looking for someone who can do the job, it also means you’re looking for someone who knows how to use the digital tools you have in place for best results. If you can’t find someone proficient enough, you’ll have to train someone on the ins and outs of your digital tools. The tools you have in place are there to make things easier and increase overall productivity. If employees are having a hard time with them, this defeats the purpose and your tools become a burden instead of productivity enhancers. Digital adoption platforms are a cost-effective onboarding solution for employees that will help them master these tools through personalized guidance walkthroughs and other interactive content.Digital adoption increases customer retention. The benefits of digital adoption to your employees trickle down to your customers. Because most customer interactions occur online, positive customer experiences are inevitably linked to the digital tools a company uses, be it a website, mobile application, or other online platform. A digital adoption platform can help customers adapt to these changes quickly, plus it also provides an opportunity to highlight product features and overall value. The sooner customers feel comfortable using your digital platforms, the sooner you can avoid churn and increase your customer base.
Invest in a Platform for Digital Adoption and Big Data
It’s no question that digital adoption and investments in big data should be one of a company’s main objectives if it wants to succeed and keep succeeding in the future. The benefits are many, and its effects profound. The challenge is getting everyone onboard the journey, and it’s not as easy as implementing the latest and greatest technologies. Digital adoption requires a change in mindset and a modification of an organization’s approach to its digital strategy.
Some technology may be easy to comprehend and use, some not, but ultimately, ita ll boils down to the users. Are they prepared to learn how to maximize these technologies for the betterment of the entire organization? Are they willing to learn how to use them to earn the long-term benefits—for them and for the business?
Answering these questions is vital, but different employees may have different answers. As technology continues to evolve, so too, does the digital adoption process. A digital adoption platform ensures that this doesn’t become a roadblock. It’s designed to assist the adoption process by making the experience as seamless as possible, for both your employees and customers.
It’s 4 PM on a Friday afternoon, and your mind has already checked out for the weekend. Just as you are about to close your laptop, you see an e-mail come in from your engineering manager. You dread what lies ahead.
“Our data science team needs to analyze streaming data from our Kafka cluster. They need the data in BigQuery. Can you deliver this ask by Monday morning?
Sounds simple enough.
You might be tempted to write an ETL script that pulls data from the Kafka cluster every 30 minutes. But that suddenly becomes complicated when you have to introduce logic for retries. What if data written to your BigQuery table is not in the right format? And what if users are looking to filter a subset of the inbound data or convert certain fields into a different format?
Then you have to get into other user requirements quickly. What about non-functional requirements that are table stakes for any production data pipeline, such as monitoring & logging? Not to mention the operational challenges it would take to scale a homegrown ETL stack to the wider organization.
Not so simple a request anymore. Looks like your weekend is totally shot.
What if there was a cloud native way for this data movement use case?
Dataflow Templates allow you to set your data in motion in just a handful of clicks. Dataflow Templates provides a user interface to select a source-sink combination from a dropdown menu, enter the values for required parameters, select optional settings, and deploy a pipeline. Once a pipeline is launched, it leverages the industry-leading, fully-managed Dataflow service, which includes horizontal & vertical autoscaling, dynamic work rebalancing, and limitless backends like Shuffle & Streaming Engine.
Retry patterns? We’ve got code samples, not to mention support for snapshots, which protects you from data loss.
Need file format conversion? We’ve got a template for that.
If you are new to Dataflow, Dataflow Templates is absolutely the right place to begin your Dataflow journey.
If you have been using Dataflow for some time, you might note that Dataflow Templates have been around for as long as you can remember. It’s true that we introduced Dataflow Templates in 2017, and since then, thousands of customers have come to rely on Dataflow Templates to automate many of their data movements between different data stores. What’s new is that we now have the structure and personnel in place to provide technical support for these open-source contributions. We have made the requisite investments with dedicated staffing, and now when you use these Dataflow Templates, you can feel confident that your production workloads will be supported no differently than any other workload you run on Google Cloud.
What’s Next
Dataflow Templates might serve your immediate data processing needs, but as any data engineer knows, requirements evolve and customizations are necessary. Thankfully, Dataflow is well-positioned to serve those use cases too.
Big data has led to a number of changes in the world of finance. Global companies are expected to spend over $11 billion on financial analytics services by 2026. One of the biggest reasons companies are spending so much on financial analytics is to improve investing opportunities. They aren’t just using data to make better stock trades. They also are optimizing nontraditional investment decisions.
Can Big Data Help Investors With Contracts For Differences?
The contract for difference market is one of the investing opportunities that is being influenced by big data. However, before you can learn how to use big data to make these trades, it is important to appreciate what contract for differences are.
It’s well known that the stock market offers the potential to make significant amounts of money. Unfortunately, the amount you need to invest is too high for most people. That’s why brokers invest other people’s money and the reason other investment opportunities have become possible. One of the newest investing opportunities is known as contract for differences.
Contract For Differences (CFD) is a way to start investing without the need for huge amounts of capital. Instead of purchasing shares, you decide whether the price of a share will rise or fall in a given time period.
You can then make a contract with a reputable CFD broker, one that thinks the price will move in the opposite direction. Contracts are for specific timescales, as soon as the contract finishes the difference is settled. If it moved in your favor then you’ll net the difference, if so, you need to settle with the CFD broker.
It’s easy to get started and, with practice, offers the opportunity to generate sizeable returns. However, as with all investing, it’s possible to lose money and funds should never be invested that can’t afford to be lost. This is why it is a good idea to use big data to optimize your trades.
The good news about CFDs is that you don’t need to buy the shares or any product, just speculate on the price movement.
CFD Is Different than Forex
Anyone with knowledge of Forex may be wondering what the difference is. After all, Forex trading effectively creates returns on the back of currency movements, regardless of whether they are up or down.
However, forex trading is limited to currencies, in many cases just the main eight trading currencies. In contrast, CFDs can be purchased on a huge range of assets. This means you can focus on the markets that appeal to you or that you know enough about, effectively increasing your likelihood of generating good returns.
Otherwise, many of the same dynamics apply, which explains the benefits of using big data. After all, big data helps a lot with making forex trades.
Why Big Data Matters
Data has always been created but, as the world has become more digitalized there have been much larger volumes of data to deal with. It’s difficult to process the data in real-time and ensure it is useful to anyone without the advent of big data processing.
But big data can help identify trends, potential issues, and it can be used to assess how the markets will react to certain types of news. That’s why it’s important to all types of traders, including those specializing in CFDs.
The Role Of Big Data
Big data is the term used when there are large amounts of data, too much too reasonably process by hand or via a standard software program. This data can be useful for many reasons, especially if you’re trading in CFDs.
Movements Over Long Periods
Trading in contract for differences means you’re focused on how the share price of a given asset will change in a very short period of time. Big data may seem irrelevant. But, you’ll never be able to process all the fluctuations in price and reasons for fluctuations by yourself. Big data can show you how a company reacts in different markets and the likelihood of its value increasing or declining.
Using it to help you understand a product can improve the accuracy of your CFD trade.
Global Events
Big data doesn’t just look at the stock market, it is used across the globe to analyze all sorts of things, from jet engines to social media activity. Oracle has a report on how predictive analytics helps make these forecasts.
Applying big data to global events will help you to understand how these events can affect your CFD trades, and allow you to adjust your trades accordingly. It can make the difference between a return and a loss.
It’s Easy To Use
Big data is assessed on specialist software, allowing you to simply ask it questions and get the answers you need. It’s never been easier to access big data. In fact, there are hundreds of sites that provide free access to big data. You simply need to decide which sites are most relevant to your intended CFDs.
Once you access big data and learn which information is useful to your trades, you’ll find it allows you to streamline decision making, optimize your returns, and provides you with additional opportunities as you start to develop a deeper understanding of how the CFD market, and individual companies, work.
Data protection is becoming more important than ever. The risk of cyberattacks has risen sharply, as more people are working from home even as the pandemic subsides. A recent report showed data breaches jumped 68% in 2021 to the highest level ever. That figure is likely to rise even more in the coming months.
One of the most unusual consequences of the war in Ukraine is the increased cybersecurity risk, with one report suggesting that Russia is preparing to launch destructive attacks on the US and similar western infrastructures.
This could put small businesses, sole traders and even remote workers at risk in some instances, so there’s no doubt that those of you with a home office should consider safeguarding this as a matter of urgency. If you want to work from home, then data protection is going to be vital.
One way that you can achieve this is through the use of a so-called VPN (virtual private network). But how exactly can a VPN protect your home office and its most sensitive data? Let’s find out!
#1. VPNs Help to Secure Your Data
One of the main security benefits of using a VPN is that it safeguards the transfer and storage of data. This is thanks to the main functionality of a VPN, which works by establishing a fully encrypted connection between two devices.
So, when you download a VPN onto your PC or laptop, your device will establish encryption keys that are used to encrypt (and potentially decrypt) any information that’s sent to another computer.
VPNs typically use secure SSL/TLS encryption protocols, which effectively routes all data through a virtual tunnel that masks both the nature of the content and your unique IP address.
Because of this, VPNs ensure that your Internet service provider will only ever see an encoded stream of data that’s being sent to a target server, making it largely impervious to the attention of hackers and cyberthieves.
So, even your most sensitive home office data can be stored and sent securely through a VPN connection, as it will appear as completely random and indistinguishable code to anyone who strives to intercept it.
#2. VPNs Allow You to Work Securely Out of the Home
A popular advantage of working from home is the flexibility that it brings, particularly if you ever want to visit a coffee shop and work from there while enjoying a much-needed change of scenery.
However, once you take your laptop out of the home, you’re placing your device and most sensitive data at the mercy of random public networks. Not only are these inherently insecure by themselves, but sophisticated hackers are known to target such networks by establishing familiar sounding access points through which unsuspecting users connect.
From this moment, the hacker can access your device and web traffic, potentially intercepting private data along the way.
However, the use of a VPN on your laptop can help in this respect, with the deployment of an encrypted tunnel blocking anyone on the same network (even the person responsible for managing it) from monitoring your activity or web traffic.
This effectively enables you to create a private and secure network on a public infrastructure, which is common at locations such as Costa Coffee or Starbucks.
#3. VPNs Allow You to Access a Work PC Securely
In some cases, you may use your home office setup to work remotely or establish a ‘hybrid’ working arrangement with your employer (which will require you to split your time evenly between the office and your home).
In this instance, you may need to connect to your work PC from a home office device, with this creating significant security and productivity risks in instances where it isn’t done particularly well.
Fortunately, a VPN enables you to connect seamlessly to your work PC using remote access software, without compromising on security or the integrity of the data stored on either device. This type of software is widely used on systems such as Windows 10, so executing a free VPN download for your home PC can genuinely empower accessible remote working.
All that’s required is for a private VPN to be installed and active on your home device, while a colleague will need to ensure that your work computer is switched on. They can also protect your device on a free Wi-Fi network.
As a note of caution, however, it may be worth reviewing your employer’s IT policy to ensure that it allows VPN access remotely. This shouldn’t be an issue in an age of hybrid and remote working, but if this practice is prohibited, you won’t be able to connect from your home PC.
When you add this number to the huge army of freelancers working remotely and in the thriving gig economy, you’ll see that the need for secure and functional home office spaces is becoming more pressing with every passing year.
At the heart of every secure home office should be a VPN connection, which can help you to secure your data, connect safely to public networks and even access your work PC remotely.
The key is to find and download the best and most competitively priced VPN, which also offers excellent network coverage and reduced latency where possible.