

In the BigQuery Spotlight series, we talked about Monitoring. This post focuses on using Audit Logs for deep dive monitoring. BigQuery Audit Logs are a collection of logs provided by Google Cloud that provide insight into operations related to your use of BigQuery. A wealth of information is available to you in the Audit Logs. Cloud Logging captures events which can show “who” performed “what” activity and “how” the system behaved.
BigQuery Audit Logs Overview
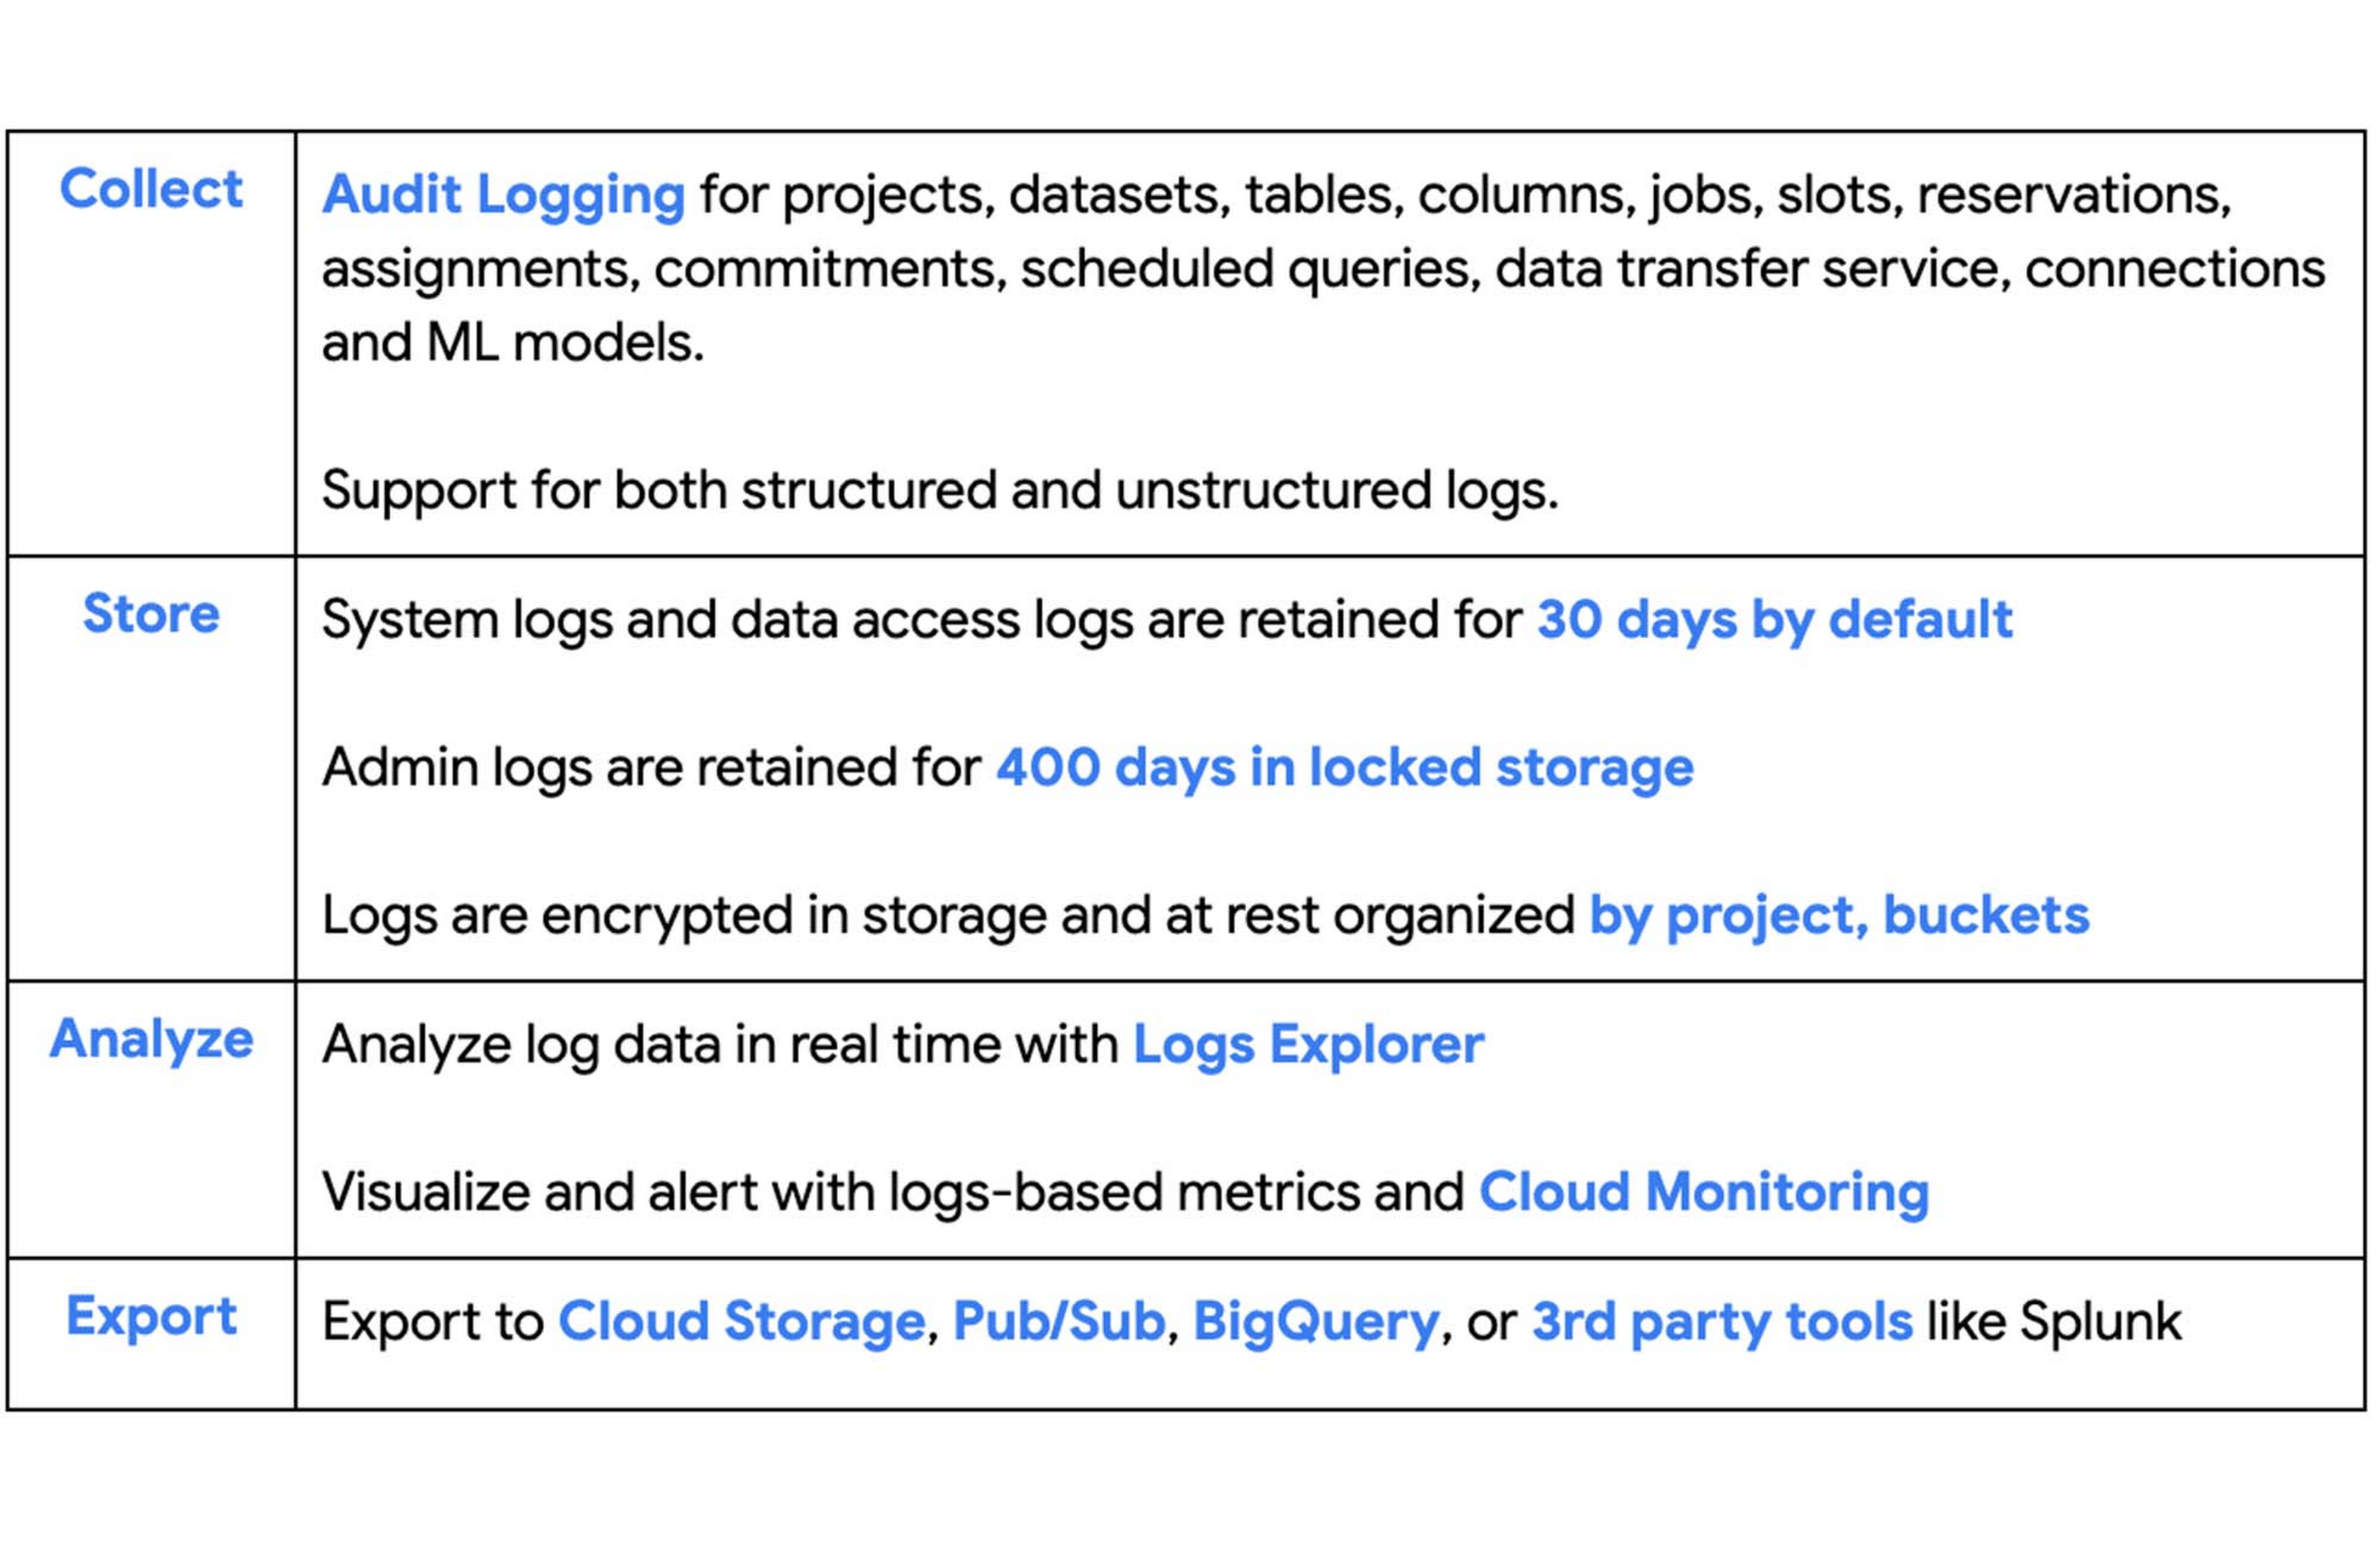
Google Cloud Audit logs provide the following capabilities:
Audit logs are useful in monitoring specific BigQuery use cases which may not be possible with other options like INFORMATION_SCHEMA or BigQuery Admin Panel. Read more about available monitoring optionsin this blog. Following are some important use cases where we can leverage audit logs for monitoring BigQuery:
Identify and address data breaches and other security incidents
Understand user data access patterns (including column access information)
Perform user behavior analytics
Identify bad actors across regions using IP address analysis
BigQuery provides three different types of audit log messages:
Audit Data – Older version of logs which reports API invocations
BigQueryAuditMetadata – Reports resource interactions such as table read, table expired etc
AuditLogs – The logs that BigQuery Reservations and BigQuery Connections use when reporting requests.
BigQuery Audit logs are categorized into the following streams :
Admin Activity Logs: events like PatchDataset, UpdateTable, DeleteTable, PatchTable, etc.
Data Access Logs: events like Query, TableDataChange, TableDataRead, etc.
System Events: events like internal table expiration
Policy Denied Logs: events related to BigQuery permissions
Types of BigQuery Log Events:
For new workloads, use only new versions of the log events. New log events start with the prefix google.cloud.bigquery.v2. Older versions of the log events can be ignored. For example, datasetservice, tabledataservice.
Personas and Use Cases
Personas and use cases are very important to understand the analysis requirements and access levels for monitoring using BigQuery Audit Logs. Here is the list of some common personas and their use cases:
Data Owners / Users – Develop and operate applications, and manage a system that generates source data. This persona is mostly concerned with their specific workloads. For example, DevelopersPlatform Operators – Often run the platform that serves internal customers. For example, Data Platform LeadsAdministrators – Primarily concerned with secure operations and health of the GCP fleet of resources. For example, SREs
BigQuery Audit Logs Export Options
To support the above personas and use cases, logs can be exported to various destinations beyond just Log Explorer. Following are the supported destinations:
Cloud Storage – JSON-formatted files stored in GCS buckets
BigQuery – Log Tables created in BigQuery datasets
Pub/Sub – JSON-formatted messages delivered to Pub/Sub topics
Log Buckets – JSON-formatted logs available for further analysis via cloud monitoring
Following features can be considered in choosing the right destination to export BigQuery logs for monitoring:
Export Requirement – Use cases for exporting to different destinationsLanguage – Language support to analyze the BigQuery audit logs Pipeline Setup – Options available for setting up the export pipeline Maintenance Overhead – Efforts required to maintain and manage the export pipeline Retention Period/Wipeout Support – Supported data retention and expiration policies
Pipeline Setup
Using Aggregated Sink
Most of the companies have many projects that lead to various islands of logs. We recommend Platform Operators and Administrators use Aggregated Sink to export organization-level audit logs in a centralized administration project. Data Owners can also export logs using aggregated sinks at project level if needed.
Logging Service Account
Cloud Logging uses a default service account to create and export log data in real-time. For VPC-SC constraints, you’d need to add this service account to an access level and then assign it to the destination service perimeter. For more details, see VPC Service Controls: Cloud Logging.
Export Option
Logs can be exported using various filters written in the Logging Query Language and exported to various destinations. The diagram below shows a sample architecture to set up log exports to specific destinations based on various use cases.
Let’s take a closer look at pipeline setup steps for each of these destinations.
BigQuery Export
For BigQuery export, log data is streamed into BigQuery one record at a time instead of using load jobs. This approach enables querying data in BigQuery in near-real time without the delay of running a load job or maintaining a data ingestion pipeline.
When creating a sink to export your logs to BigQuery, you can either use date-sharded or partitioned tables. Both table types partition data based on the log entries’ timestamp field. The default selection is date shared tables. The recommended approach is partitioned tables for easy access and management, and better performance.
The aggregated sink option creates the following audit log tables in BigQuery based on corresponding event types:
cloudaudit_googleapis_com_system_event
cloudaudit_googleapis_com_policy
cloudaudit_googleapis_com_data_access
cloudaudit_googleapis_com_activity
Setup Steps
Step 1: Create aggregated sink at the organization level to route the logs to BigQuery sink
Other Filters:
protoPayload.serviceName=bigquerydatatransfer.googleapis.com
protoPayload.serviceName=bigqueryreservation.googleapis.com
Step 2: Provide service account access
Grant the BigQuery Data Editor role to the default logging service account on the BigQuery destination dataset.
Step 3: Set retention policy
When you create the table, set a partition expiration to limit the size of the logging export storage.
Step 4: Create derived tables or views for further analysis
Here’s a sample SQL query that provides details on who accessed which dataset / tables / columns and what kind of permissions they had to perform that operation.
This sample query provides details on who/how performed the various Dataset activities like Dataset read, Dataset creation and Dataset delete
This sample query provides the details on the Expired tables
Google Cloud Storage Export
Google Cloud Storage provides inexpensive, long term storage of logs. Moving logs to Nearline or Coldline and then deleting them helps you manage the ongoing operational cost of maintaining the logs. If you are looking to export these logs for further analysis, you can load the JSON-formatted log files to BigQuery or create external tables on the logs data in GCS.
Setup Steps
Step 1: Create aggregated sink at the organization level to route the logs toGCS sink
Step 2: Provide service account access
Grant the Storage Object Creator role to the default logging service account to write to the bucket
Step 3: Set retention policy
Configure Retention Policyusing object lifecycle management on GCS
Step 4: External Tables
In Some cases you might need to query the audit logs data stored in GCS. In that case you can use External tables in BigQuery to explore the data further. However, the query performance for external tables is not the same as that of native BigQuery Tables.
Step 4.1 Create the external table
bq mk
–external_table_definition=source_format=Cloud Storage URI Dataset.table
Step 4.2 Create a view for querying
Pub/Sub Export
Logs can be exported from cloud logging to 3rd party tools like Splunk in real time using the Pub/Sub sink. Splunk enables you to search, analyze, and visualize logs, events, and metrics gathered from your on-premises and cloud deployments for IT and security monitoring. You can also create a Dataflow pipeline from Pub/sub to BigQuery to perform transformations and aggregations, and eventually load the results to BigQuery for data analytics.
Setup Steps
Step 1: Create aggregated sink at the organization level to route the logs to Pub/Sub Sink
Step 2: Provide service account access
Grant the Pub/Sub Publisher role on the topic to the default logging service account
Step 3: Set up a subscription to pull log messages from the topic created
Use command-line to pull messages via Pub/Sub subscription pull. Alternatively, you could implement a simple subscriber. Check out these code samples for more details.
Step 4: Set up the third party integration
You can ingest the log messages to third party tools like Splunk either using Dataflow or pull logs directly using Splunk Add-on for Google Cloud Platform.
Cloud Monitoring
Cloud Monitoring is a part of the Cloud logging and monitoring framework. The log information from Log buckets is automatically synced to the Cloud Monitoring workspace and available for high-level analytics. It also provides built-in high level log metrics and alerting features.
However, it cannot be customized for advanced analytics requirements. Also, it is difficult to configure granular permissions and access control levels in a monitoring workspace.
Pipeline Automation
The pipeline setup steps can be easily automated, version controlled and managed using Terraform. Here’s a sample Terraform script for setting up an aggregated sink to BigQuery.
What’s next?
You can leverage the audit logs data in the BigQuery sink to create more advanced analytics dashboards using Data Studio or Looker. Here are some sample use cases for monitoring BigQuery using audit logs:
Access Reports for Project Owners
Project owners would like to see who, when and what dataset is being accessed in their projects. For example, who is accessing a particular dataset from which location. This will help identify any anomalies and report proactively on any such access issues.
Usage Reports for Data Owners
Data owners are usually interested in getting more details on how others are using their datasets and tables in a project. For example, they’d like to see how often a column in a specific table is being accessed and by which users and how many tables are expiring
Here’s a sample dashboard example using Data Studio:
Checkout this Github Repository for more SQL scripts on querying the logs information in BigQuery and Terraform scripts for the overall logs export pipeline automation.
Source : Data Analytics Read More