Pub/Sub’s ingestion of data into BigQuery can be critical to making your latest business data immediately available for analysis. Until today, you had to create intermediate Dataflow jobs before your data could be ingested into BigQuery with the proper schema. While Dataflow pipelines (including ones built with Dataflow Templates) get the job done well, sometimes they can be more than what is needed for use cases that simply require raw data with no transformation to be exported to BigQuery.
Starting today, you no longer have to write or run your own pipelines for data ingestion from Pub/Sub into BigQuery. We are introducing a new type of Pub/Sub subscription called a “BigQuery subscription” that writes directly from Cloud Pub/Sub to BigQuery. This new extract, load, and transform (ELT) path will be able to simplify your event-driven architecture. For Pub/Sub messages where advanced preload transformations or data processing before landing data in BigQuery (such as masking PII) is necessary, we still recommend going through Dataflow.
Get started by creating a new BigQuery subscription that is associated with a Pub/Sub topic. You will need to designate an existing BigQuery table for this subscription. Note that the table schema must adhere to certain compatibility requirements. By taking advantage of Pub/Sub topic schemas, you have the option of writing Pub/Sub messages to BigQuery tables with compatible schemas. If schema is not enabled for your topic, messages will be written to BigQuery as bytes or strings. After the creation of the BigQuery subscription, messages will now be directly ingested into BigQuery.
Better yet, you no longer need to pay for data ingestion into BigQuery when using this new direct method. You only pay for the Pub/Sub you use. Ingestion from Pub/Sub’s BigQuery subscription into BigQuery costs $50/TiB based on read (subscribe throughput) from the subscription. This is a simpler and cheaper billing experience compared to the alternative path via Dataflow pipeline where you would be paying for the Pub/Sub read, Dataflow job, and BigQuery data ingestion. See the pricing page for details.
To get started, you can read more about Pub/Sub’s BigQuery subscription or simply create a new BigQuery subscription for a topic using Cloud Console or the gcloud CLI.
R is one of the most widely used programming languages for statistical computing and machine learning. Many data scientists love it, especially for the rich world of packages from tidyverse, an opinionated collection of R packages for data science. Besides the tidyverse, there are over 18,000 open-source packages on CRAN, the package repository for R. RStudio, available as desktop version or on theGoogle Cloud Marketplace, is a popular Integrated Development Environment (IDE) used by data professionals for visualization and machine learning model development.
Once a model has been built successfully, a recurring question among data scientists is: “How do I deploy models written in the R language to production in a scalable, reliable and low-maintenance way?”
In this blog post, you will walk through how to use Google Vertex AI to train and deploy enterprise-grade machine learning models built with R.
Overview
Managing machine learning models on Vertex AI can be done in a variety of ways, including using the User Interface of the Google Cloud Console, API calls, or the Vertex AI SDK for Python.
Since many R users prefer to interact with Vertex AI from RStudio programmatically, you will interact with Vertex AI through the Vertex AI SDK via the reticulate package.
Train a model locally and import it as a custom model into Vertex AI Model Registry, from where it can be deployed to an endpoint for serving predictions.
Create a TrainingPipeline that runs a CustomJob and imports the resulting artifacts as a Model.
In this blog post, you will use the second method and train a model directly in Vertex AI since this allows us to automate the model creation process at a later stage while also supporting distributed hyperparameter optimization.
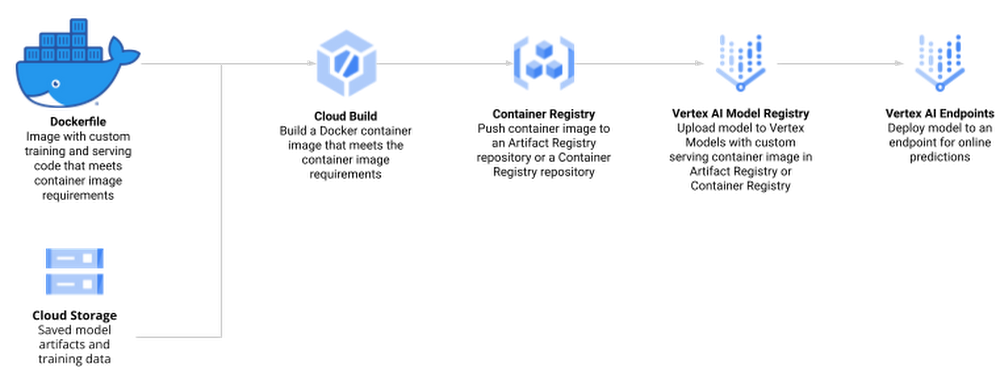
The process of creating and managing R models in Vertex AI comprises the following steps:
Enable Google Cloud Platform (GCP) APIs and set up the local environment
Create custom R scripts for training and serving
Create a Docker container that supports training and serving R models with Cloud Build and Container Registry
Train a model using Vertex AI Training and upload the artifact to Google Cloud Storage
Create a model endpoint on Vertex AI Prediction Endpoint and deploy the model to serve online prediction requests
To showcase this process, you train a simple Random Forest model to predict housing prices on the California housing data set. The data contains information from the 1990 California census. The data set is publicly available from Google Cloud Storage at gs://cloud-samples-data/ai-platform-unified/datasets/tabular/california-housing-tabular-regression.csv
The Random Forest regressor model will predict a median housing price, given a longitude and latitude along with data from the corresponding census block group. A block group is the smallest geographical unit for which the U.S. Census Bureau publishes sample data (a block group typically has a population of 600 to 3,000 people).
Environment Setup
This blog post assumes that you are either using Vertex AI Workbench with an R kernel or RStudio. Your environment should include the following requirements:
The Google Cloud SDK
Git
R
Python 3
Virtualenv
To execute shell commands, define a helper function:
Next, you define variables to support the training and deployment process, namely:
PROJECT_ID: Your Google Cloud Platform Project ID
REGION: Currently, the regions us-central1, europe-west4, and asia-east1 are supported for Vertex AI; it is recommended that you choose the region closest to you
BUCKET_URI: The staging bucket where all the data associated with your dataset and model resources are stored
DOCKER_REPO: The Docker repository name to store container artifacts
IMAGE_NAME: The name of the container image
IMAGE_TAG: The image tag that Vertex AI will use
IMAGE_URI: The complete URI of the container image
When you initialize the Vertex AI SDK for Python, you specify a Cloud Storage staging bucket. The staging bucket is where all the data associated with your dataset and model resources are retained across sessions.
Create Docker container image for training and serving R models
The docker file for your custom container is built on top of the Deep Learning container — the same container that is also used for Vertex AI Workbench. In addition, you add two R scripts for model training and serving, respectively.
Before creating such a container, you enable Artifact Registry and configure Docker to authenticate requests to it in your region.
code_block[StructValue([(u’code’, u’# filename: Dockerfile – container specifications for using R in Vertex AIrnFROM gcr.io/deeplearning-platform-release/r-cpu.4-1:latestrnrnWORKDIR /rootrnrnCOPY train.R /root/train.RrnCOPY serve.R /root/serve.Rrnrn# Install FortranrnRUN apt-get updaternRUN apt-get install gfortran -yyrnrn# Install R packagesrnRUN Rscript -e “install.packages(‘plumber’)”rnRUN Rscript -e “install.packages(‘randomForest’)”rnrnEXPOSE 8080′), (u’language’, u”), (u’caption’, <wagtail.wagtailcore.rich_text.RichText object at 0x3ead93a41450>)])]
Next, create the file train.R, which is used to train your R model. The script trains a randomForest model on the California Housing dataset. Vertex AI sets environment variables that you can utilize, and since this script uses a Vertex AI managed dataset, data splits are performed by Vertex AI and the script receives environment variables pointing to the training, test, and validation sets. The trained model artifacts are then stored in your Cloud Storage bucket.
code_block[StructValue([(u’code’, u’#!/usr/bin/env Rscriptrn# filename: train.R – train a Random Forest model on Vertex AI Managed Datasetrnlibrary(tidyverse)rnlibrary(data.table)rnlibrary(randomForest)rnSys.getenv()rnrn# The GCP Project IDrnproject_id <- Sys.getenv(“CLOUD_ML_PROJECT_ID”)rnrn# The GCP Regionrnlocation <- Sys.getenv(“CLOUD_ML_REGION”)rnrn# The Cloud Storage URI to upload the trained model artifact tornmodel_dir <- Sys.getenv(“AIP_MODEL_DIR”)rnrn# Next, you create directories to download our training, validation, and test set into.rndir.create(“training”)rndir.create(“validation”)rndir.create(“test”)rnrn# You download the Vertex AI managed data sets into the container environment locally.rnsystem2(“gsutil”, c(“cp”, Sys.getenv(“AIP_TRAINING_DATA_URI”), “training/”))rnsystem2(“gsutil”, c(“cp”, Sys.getenv(“AIP_VALIDATION_DATA_URI”), “validation/”))rnsystem2(“gsutil”, c(“cp”, Sys.getenv(“AIP_TEST_DATA_URI”), “test/”))rnrn# For each data set, you may receive one or more CSV files that you will read into data frames.rntraining_df <- list.files(“training”, full.names = TRUE) %>% map_df(~fread(.))rnvalidation_df <- list.files(“validation”, full.names = TRUE) %>% map_df(~fread(.))rntest_df <- list.files(“test”, full.names = TRUE) %>% map_df(~fread(.))rnrnprint(“Starting Model Training”)rnrf <- randomForest(median_house_value ~ ., data=training_df, ntree=100)rnrfrnrnsaveRDS(rf, “rf.rds”)rnsystem2(“gsutil”, c(“cp”, “rf.rds”, model_dir))’), (u’language’, u”), (u’caption’, <wagtail.wagtailcore.rich_text.RichText object at 0x3ead920dc110>)])]
Next, create the file serve.R, which is used for serving your R model. The script downloads the model artifact from Cloud Storage, loads the model artifacts, and listens for prediction requests on port 8080. You have several environment variables for the prediction service at your disposal, including:
AIP_HEALTH_ROUTE: HTTP path on the container that AI Platform Prediction sends health checks to.
Next, you build the Docker container image on Cloud Build — the serverless CI/CD platform. Building the Docker container image may take 10 to 15 minutes.
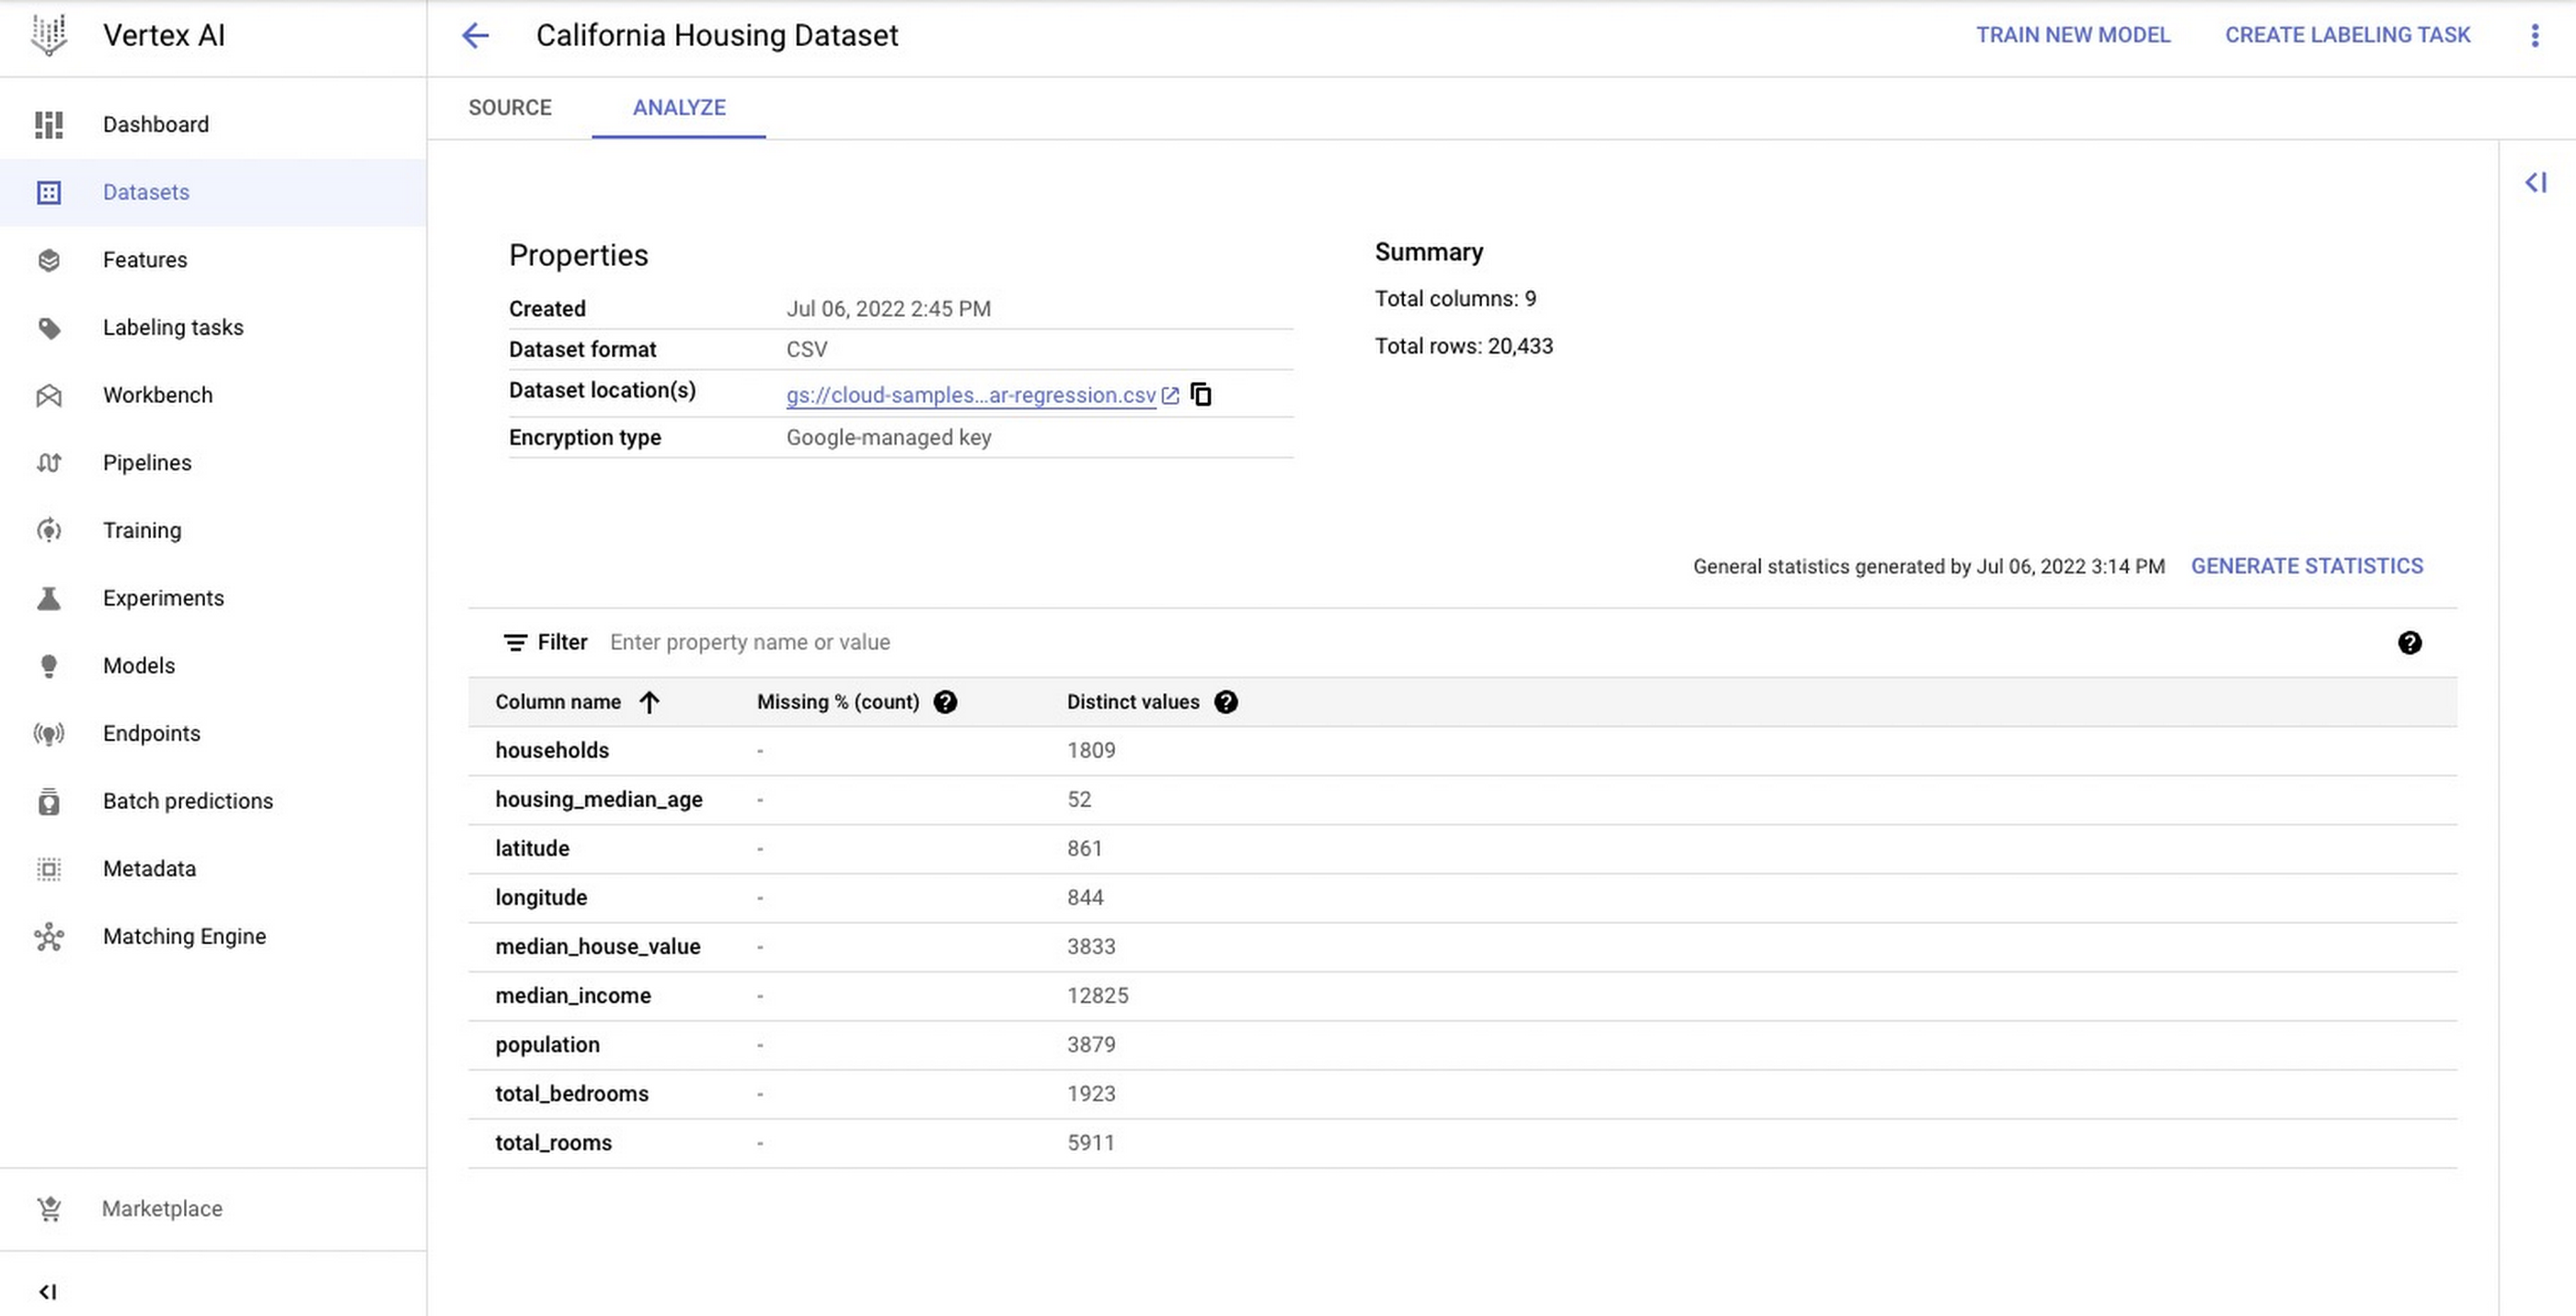
You create a Vertex AI Managed Dataset to have Vertex AI take care of the data set split. This is optional, and alternatively you may want to pass the URI to the data set via environment variables.
The next screenshot shows the newly created Vertex AI Managed dataset in Cloud Console.
Train R Model on Vertex AI
The custom training job wraps the training process by creating an instance of your container image and executing train.R for model training and serve.R for model serving.
Note: You use the same custom container for both training and serving.
To train the model, you call the method run(), with a machine type that is sufficient in resources to train a machine learning model on your dataset. For this tutorial, you use a n1-standard-4 VM instance.
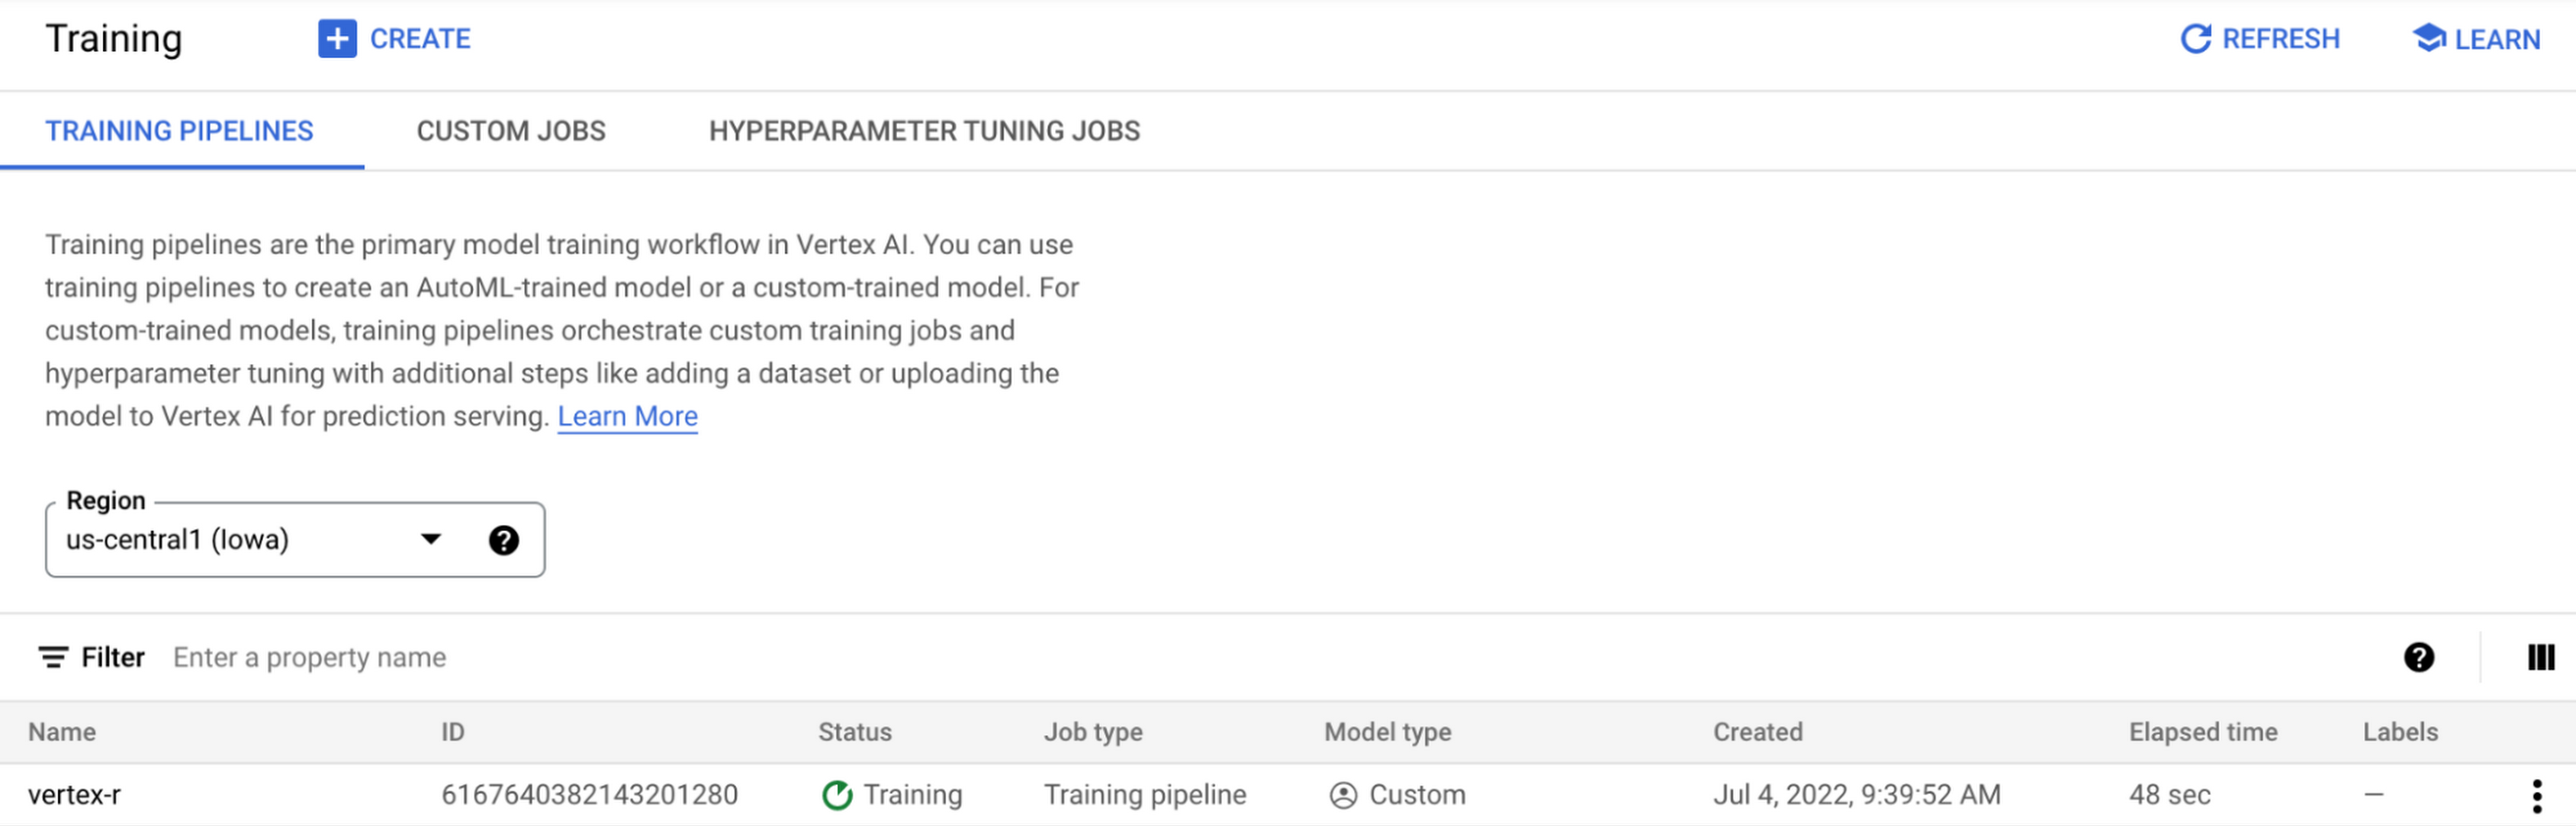
The model is now being trained, and you can watch the progress in the Vertex AI Console.
Provision an Endpoint resource and deploy a Model
You create an Endpoint resource using the Endpoint.create() method. At a minimum, you specify the display name for the endpoint. Optionally, you can specify the project and location (region); otherwise the settings are inherited by the values you set when you initialized the Vertex AI SDK with the init() method.
In this example, the following parameters are specified:
display_name: A human readable name for the Endpoint resource.
project: Your project ID.
location: Your region.
labels: (optional) User defined metadata for the Endpoint in the form of key/value pairs.
You can deploy one of more Vertex AI Model resource instances to the same endpoint. Each Vertex AI Model resource that is deployed will have its own deployment container for the serving binary.
Next, you deploy the Vertex AI Model resource to a Vertex AI Endpoint resource. The Vertex AI Model resource already has defined for it the deployment container image. To deploy, you specify the following additional configuration settings:
The machine type.
The (if any) type and number of GPUs.
Static, manual or auto-scaling of VM instances.
In this example, you deploy the model with the minimal amount of specified parameters, as follows:
model: The Model resource.
deployed_model_displayed_name: The human readable name for the deployed model instance.
machine_type: The machine type for each VM instance.
Due to the requirements to provision the resource, this may take up to a few minutes.
Note: For this example, you specified the R deployment container in the previous step of uploading the model artifacts to a Vertex AI Model resource.
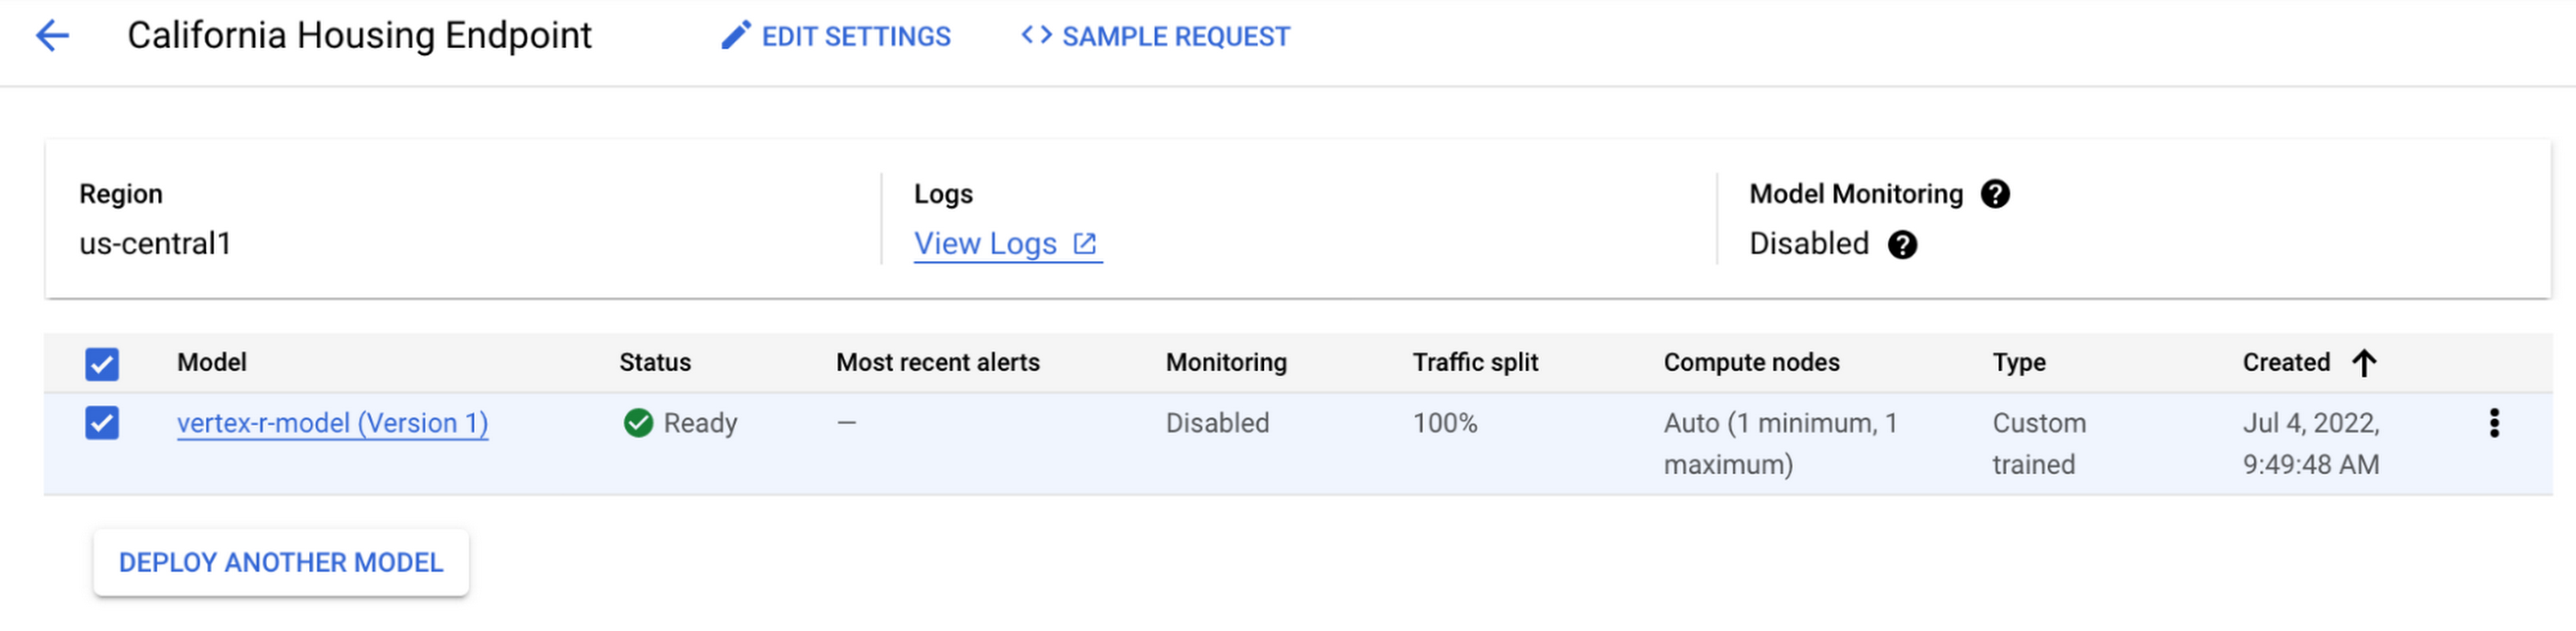
The model is now being deployed to the endpoint, and you can see the result in the Vertex AI Console.
Make predictions using newly created Endpoint
Finally, you create some example data to test making a prediction request to your deployed model. You use five JSON-encoded example data points (without the label median_house_value) from the original data file in data_uri. Finally, you make a prediction request with your example data. In this example, you use the REST API (e.g., Curl) to make the prediction request.
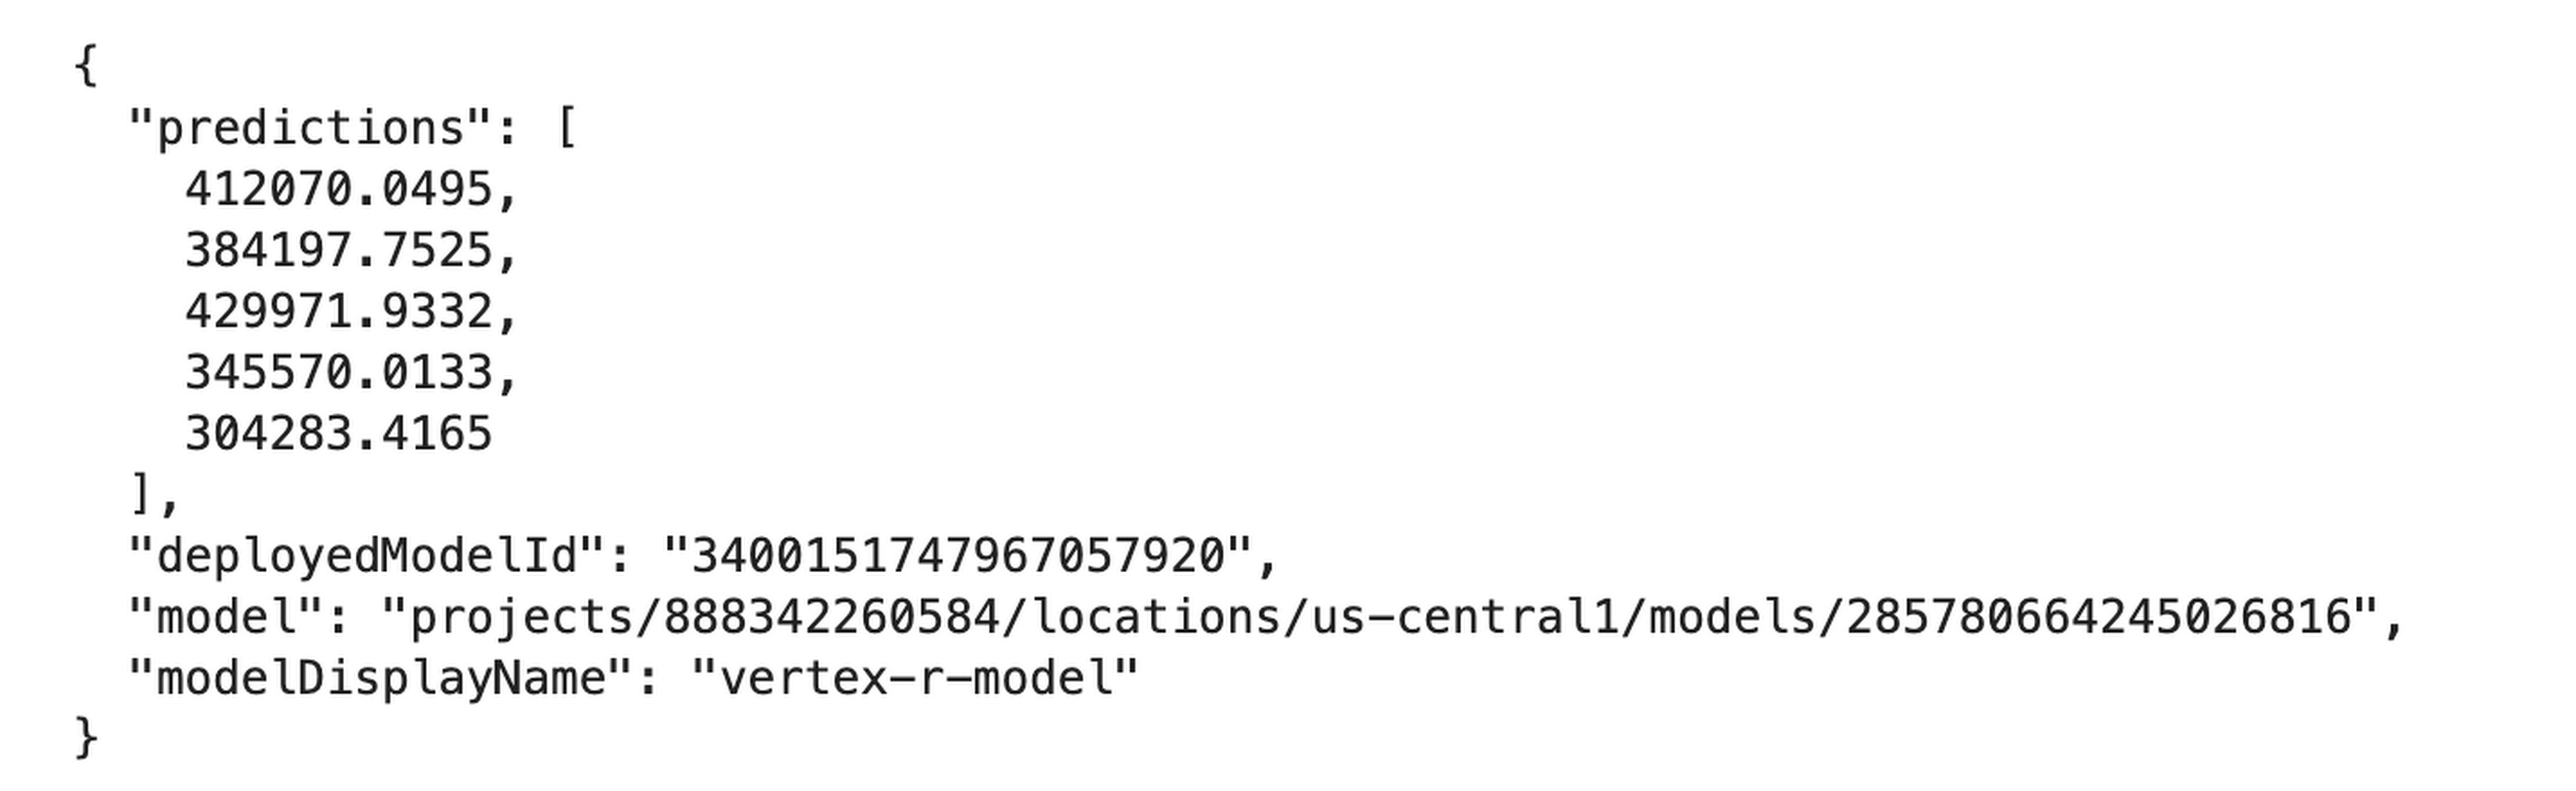
The endpoint now returns five predictions in the same order the examples were sent.
Cleanup
To clean up all Google Cloud resources used in this project, you can delete the Google Cloud project you used for the tutorial or delete the created resources.
code_block[StructValue([(u’code’, u’endpoint$undeploy_all()rnendpoint$delete()rndataset$delete()rnmodel$delete()rnjob$delete()’), (u’language’, u”), (u’caption’, <wagtail.wagtailcore.rich_text.RichText object at 0x3ead93078150>)])]
Summary
In this blog post, you have gone through the necessary steps to train and deploy an R model to Vertex AI. For easier reproducibility, you can refer to this Notebook on GitHub
Acknowledgements
This blog post received contributions from various people. In particular, we would like to thank Rajesh Thallam for strategic and technical oversight, Andrew Ferlitsch for technical guidance, explanations, and code reviews, and Yuriy Babenko for reviews.
Running time-based, scheduled workflows to implement business processes is regular practice at many financial services companies. This is true for Deutsche Bank, where the execution of workflows is fundamental for many applications across its various business divisions, including the Private Bank, Investment and Corporate Bank as well as internal functions like Risk, Finance and Treasury. These workflows often execute scripts on relational databases, run application code in various languages (for example Java), and move data between different storage systems. The bank also uses big data technologies to gain insights from large amounts of data, where Extract, Transform and Load (ETL) workflows running on Hive, Impala and Spark play a key role.
Historically, Deutsche Bank used both third-party workflow orchestration products and open-source tools to orchestrate these workflows. But using multiple tools increases complexity and introduces operational overhead for managing underlying infrastructure and workflow tools themselves.
Cloud Composer, on the other hand, is a fully managed offering that allows customers to orchestrate all these workflows with a single product. Deutsche Bank recently began introducing Cloud Composer into its application landscape, and continues to use it in more and more parts of the business.
“Cloud Composer is our strategic workload automation (WLA) tool. It enables us to further drive an engineering culture and represents an intentional move away from the operations-heavy focus that is commonplace in traditional banks with traditional technology solutions. The result is engineering for all production scenarios up front, which reduces risk for our platforms that can suffer from reactionary manual interventions in their flows. Cloud Composer is built on open-source Apache Airflow, which brings with it the promise of portability for a hybrid multi-cloud future, a consistent engineering experience for both on-prem and cloud-based applications, and a reduced cost basis.
We have enjoyed a great relationship with the Google team that has resulted in the successful migration of many of our scheduled applications onto Google Cloud using Cloud Composer in production.” -Richard Manthorpe, Director Workload Automation, Deutsche Bank
Why use Cloud Composer in financial services
Financial services companies want to focus on implementing their business processes, not on managing infrastructure and orchestration tools. In addition to consolidating multiple workflow orchestration technologies into one and thus reducing complexity, there are a number of other reasons companies choose Cloud Composer as a strategic workflow orchestration product.
First of all, Cloud Composer is significantly more cost-effective than traditional workflow management and orchestration solutions. As a managed service, Google takes care of all environment configuration and maintenance activities. Cloud Composer version 2 introduces autoscaling, which allows for an optimized resource utilization and improved cost control, since customers only pay for the resources used by their workflows. And because Cloud Composer is based on open source Apache Airflow, there are no license fees; customers only pay for the environment that it runs on, adjusting the usage to current business needs.
Highly regulated industries like financial services must comply with domain-specific security and governance tools and policies. For example, Customer-Managed Encryption Keys ensure that data won’t be accessed without the organization’s consent, while Virtual Private Network Service Controls mitigate the risk of data exfiltration. Cloud Composer supports these and many other security and governance controls out-of-the box, making it easy for customers in regulated industries to use the service without having to implement these policies on their own.
The ability to orchestrate both native Google Cloud as well as on-prem workflows is another reason that Deutsche Bank chose Cloud Composer. Cloud Composer uses Airflow Operators (connectors for interacting with outside systems) to integrate with Google Cloud services like BigQuery, Dataproc, Dataflow, Cloud Functions and others, as well as hybrid and multi-cloud workflows. Airflow Operators also integrate with Oracle databases, on-prem VMs, sFTP file servers and many others, provided by Airflow’s strong open-source community.
And while Cloud Composer lets customers consolidate multiple workflow orchestration tools into one, there are some use cases where it’s just not the right fit. For example, if customers have just a single job that executes once a day on a fixed schedule, Cloud Scheduler, Google Cloud’s managed service for Cron jobs, might be a better fit. Cloud Composer in turn excels for more advanced workflow orchestration scenarios.
Finally, technologies based on open source technologies also provide a simple exit strategy from cloud — an important regulatory requirement for financial services companies. With Cloud Composer, customers can simply move their Airflow workflows from Cloud Composer to a self-managed Airflow cluster. Because Cloud Composer is fully compatible with Apache Airflow, the workflow definitions stay exactly the same if they are moved to a different Airflow cluster.
Cloud Composer applied
Having looked at why Deutsche Bank chose Cloud Composer, let’s dive into how the bank is actually using it today. Apache Airflow is well-suited for ETL and data engineering workflows thanks to the rich set of data Operators (connectors) it provides. So Deutsche Bank, where a large-scale data lake is already in place on-prem, leverages Cloud Composer for its modern Cloud Data Platform, whose main aim is to work as an exchange for well-governed data, and enable a “data mesh” pattern.
At Deutsche Bank, Cloud Composer orchestrates the ingestion of data to the Cloud Data Platform, which is primarily based on BigQuery. The ingestion happens in an event-driven manner, i.e., Cloud Composer does not simply run load jobs based on a time-schedule; instead it reacts to events when new data such as Cloud Storage objects arrives from upstream sources. It does so using so-called Airflow Sensors, which continuously watch for new data. Besides loading data into BigQuery, Composer also schedules ETL workflows, which transform data to derive insights for business reporting.
Due to the rich set of Airflow Operators, Cloud Composer can also orchestrate workflows that are part of standard, multi-tier business applications running non-data-engineering workflows. One of the use cases includes a swap reporting platform that provides information about various asset classes, including commodities, credits, equities, rates and Forex. In this application, Cloud Composer orchestrates various services implementing the business logic of the application and deployed on Cloud Run — again, using out-of-the-box Airflow Operators.
These use cases are already running in production and delivering value to Deutsche Bank. Here is how their Cloud Data Platform team sees the adoption of Cloud Composer:
“Using Cloud Composer allows our Data Platform team to focus on creating Data Engineering and ETL workflows instead of on managing the underlying infrastructure. Since Cloud Composer runs Apache Airflow, we can leverage out of the box connectors to systems like BigQuery, Dataflow, Dataproc and others, making it well-embedded into the entire Google Cloud ecosystem.”—Balaji Maragalla, Director Big Data Platforms, Deutsche Bank
Data continues to grow in volume and is increasingly distributed across lakes, warehouses, clouds, and file formats. As more users demand more use cases, the traditional approach to build data movement infrastructure is proving difficult to scale. Unlocking the full potential of data requires breaking down these silos, and is increasingly a top priority for enterprises.
Earlier this year, we previewed BigLake, a storage engine that extends innovations in BigQuery storage to open file formats running on public cloud object stores. This allows customers to build secure multi-cloud data lakes over open file formats. BigLake provides consistent, fine-grained security controls for Google Cloud and open-source query engines to interact with data. Today, we are excited to announce General Availability for BigLake, and a set of new capabilities to help you build a differentiated data platform.
“We are using GCP to build and extend one of the street’s largest risk systems. During several tests we have seen the great potential and scale of BigLake. It is one of the products that could support our cloud journey and drive application’s future efficiency” – Scott Condit, Director, Risk CTO Deutsche Bank.
Build a distributed data lake that spans across warehouses, object stores & clouds with BigLake
Customers can create BigLake tables on Google Cloud Storage (GCS), Amazon S3 and ADLS Gen 2 over supported open file formats, such as Parquet, ORC and Avro. BigLake tables are a new type of external table that can be managed similar to data warehouse tables. Administrators do not need to grant end users access to files in object stores, but instead manage access at a table, row or a column level. These tables can be created from a query engine of your choice, such as BigQuery or open-source engines using the BigLake connector. Once these tables are created, BigLake and BigQuery tables can be centrally discovered in the data catalog and managed at scale using Dataplex.
BigLake extends the BigQuery storage API to object stores to help you build a multi-compute architecture. BigLake connectors are built on the BigQuery storage API and enable Google Cloud DataFlow and open-source query engines (such as Spark, Trino, Presto, Hive) to query BigLake tables by enforcing security. This eliminates the need to move the data to a query engine specific use case and security only needs to be configured at one place and is enforced everywhere.
“We are using GCP to design datalake solutions for our customers and transform their digital strategy to create a data-driven enterprise. Biglake has been critical for our customers to quickly realize the value of analytical solutions by reducing the need to build ETL pipelines and cutting-down time-to-market. The performance & governance features of BigLake enabled a variety of data lake use cases for our customers.” – Sureet Bhurat, Founding Board member – Synapse LLC
BigLake unlocks new use cases using Google Cloud and OSS Query engines
During the preview, we saw a large number of customers use BigLake in various ways. Some of the top use cases include:
Building secure and governed data lakes for open-source workloads – Workloads migrating from Hadoop, Spark first customers, or those using Presto/Trino, can now use BigLake to build secure, governed and performant data lakes on GCS. BigLake tables on GCS provide fine-grained security, table management (vs giving access to files), better query performance and integrated governance with Dataplex. These characteristics are accessible across multiple OSS query engines when using the BigLake connectors.
“To support our data driven organization, Wizard needs a data lake solution that leverages open file formats and can grow to meet our needs. BigLake allows us to build and query on open file formats, scales to meet our needs, and accelerates our insight discovery. We look forward to expanding our use cases with future BigLake features” – Rich Archer, Senior Data Engineer – Wizard
Eliminate or reduce data duplication across data warehouses and lakes – Customers who use GCS, and BigQuery managed storage had to previously create two copies of data to support users using BigQuery and OSS engines. BigLake makes the GCS tables more consistent with BigQuery tables, reducing the need to duplicate data. Instead, customers can now keep a single copy of data split across BigQuery storage and GCS, and data can be accessed by BigQuery or OSS engines in either places in a consistent, secure manner.
Fine-grained security for multi-cloud use cases – BigQuery Omni customers can now use BigLake tables on Amazon S3, and ADLS Gen 2 to configure fine grained security access control, and take advantage of localized data processing, and cross cloud transfer capabilities to do multi-cloud analytics. Tables created on other clouds are centrally discoverable on Data catalog for ease of management & governance
Interoperability between analytics and data science workloads – Data science workloads, using either Spark or Vertex AI notebooks can now directly access data in BigQuery or GCS through the API connector, enforcing security & eliminating the need to import data for training models. For BigQuery customers, these models can be imported back into BigQuery ML to produce inferences.
Build a differentiated data platform with new BigLake capabilities
We are also excited to announce new capabilities as part of this General Availability launch. These include:
Analytics Hub support: Customers can now share BigLake tables on GCS with partners, vendors or suppliers as linked data sets. Consumers can access this data in place through the preferred query engine of their choice (BigQuery, Spark, Presto, Trino, Tensorflow).BigLake tables is now the default table type BigQuery Omni, and has been upgraded from the previous default of external tables.BigQuery ML support: BigQuery customers can now train their models on GCS BigLake tables using BigQuery ML, without needing to import data, and accessing the data in accordance to the access policies on the table.Performance acceleration (preview): Queries for GCS BigLake tables can now be accelerated using the underlying BigQuery infrastructure. If you would like to use this feature please get in touch with your account team or fill out this form.Cloud Data Loss Prevention (DLP) profiling support (coming soon): Cloud DLP can soon scan BigLake tables to identify and protect sensitive data at scale. If you would like to use this feature please get in touch with your account team or fill out this form.Data masking and audit logging (Coming soon): BigLake tables now support dynamic data masking, enabling you to mask sensitive data elements to meet compliance needs. End user query requests to GCS for BigLake tables are now audit logged and are available to query via logs.
Next steps
Refer to BigLake documentation to learn more, or get started with this quick start tutorial. If you are already using external tables today, consider upgrading them to BigLake tables to take advantage of above mentioned new features. For more information, reach out to the Google cloud account team to see how BigLake can add value to your data platform.
The seamless integration between BQML and Vertex AI helps automate and monitor the entire model life cycle of BQML models from training to serving. Developers, especially ML engineers, no longer have to write bespoke code in order to include BQML workflows in their ML pipelines, they can now simply include these new BQML components in their pipelines natively, making it easier and faster to deploy end-to-end ML lifecycle pipelines.
In addition, using these components as part of a Vertex AI Pipelines provides data and model governance. Any time a pipeline is executed, Vertex AI Pipelines tracks and manages any artifacts produced automatically.
For BigQuery, the following components are available:
Allows users to submit an arbitrary BQ query which will either be written to a temporary or permanent table. Launches a BigQuery query job and waits for it to finish.
For BigQuery ML (BQML), the following components are now available:
Launches a BigQuery drop model job and waits for it to finish.
Now that you have a broad overview of all pipeline operators for BQML available, let’s see how to use forecasting ones in the end-to-end example of building demand forecast predictions. You will find the code in the Vertex AI samples repo on Github.
Example of a demand forecast predictions pipeline in BigQuery ML
In this section, we’ll show an end-to-end example of using BigQuery and BQML components in a Vertex AI Pipeline for demand forecasting. The pipeline is based on the solving for food waste with data analytics blog post. In this scenario, a fictitious grocer, FastFresh, specialized in selling fresh food distribution, wants to minimize food waste and optimize stock levels across all stores. Due to the frequency of inventory updates (by minute of every single item), they want to train a demand forecasting model on an hourly basis. With 24 training jobs per day, they want to automate model training using an ML pipeline using pipeline operators for BQML ARIMA_PLUS, the forecasting model type in BQML.
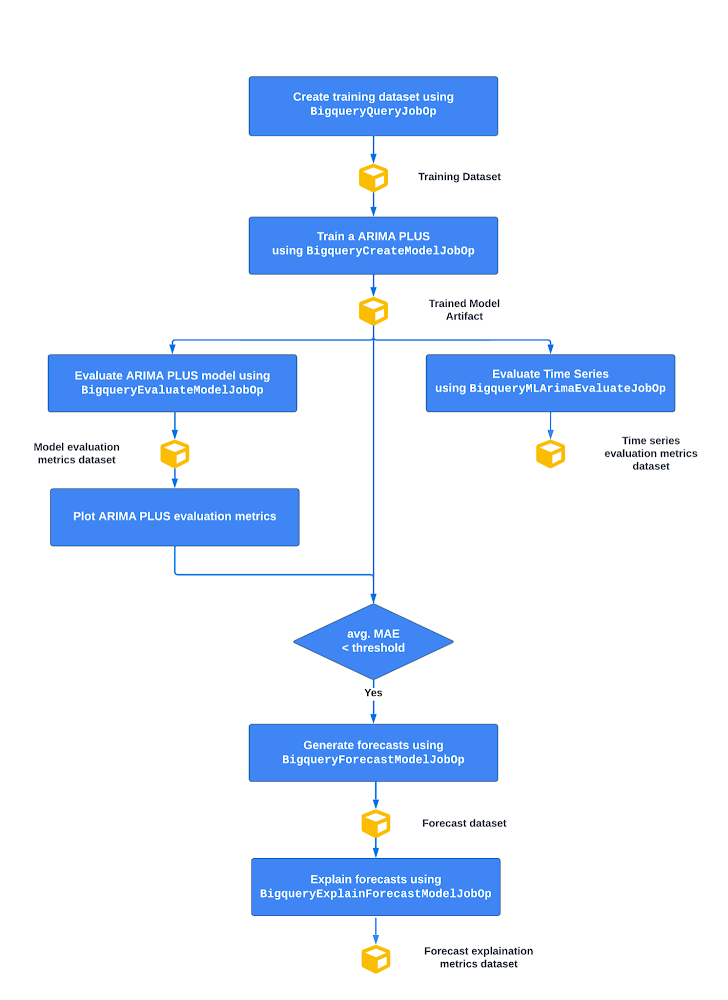
Below you can see a high level picture of the pipeline flow
Figure 1 – The high level architecture of the pipeline flow
From top to bottom:
Create the training dataset in BigQuery
Train a BigQuery ML ARIMA_PLUS model
Evaluate ARIMA_PLUS time series and model metrics
Then, if the average mean absolute error (MAE), which measures the mean of the absolute value of the difference between the forecasted value and the actual value, is less than a certain threshold:
Generate time series forecasts based on a trained time series ARIMA_PLUS model
Generate separate time series components of both the training and the forecasting data to explain predictions
Let’s dive into the pipeline operators for BQML ARIMA_PLUS.
Training a demand forecasting model
Once you have the training data (as a table), you are ready to build a demand forecasting model with the ARIMA_PLUS algorithm. You can automate this BQML model creation operation within a Vertex AI Pipeline using the BigqueryCreateModelJobOp. As we discussed in the previous article, this component allows you to pass the BQML training query to submit a model training of an ARIMA_PLUS model on BigQuery. The component returns a google.BQMLModel which will be recorded in the Vertex ML Metadata so that you can keep track of the lineage of all artifacts. Below you find the model training operator where the set_display_name attribute allows you to name the component during the execution. And the after attribute allows you to control the sequential order of the pipeline step.
code_block[StructValue([(u’code’, u’bq_arima_model_op = BigqueryCreateModelJobOp(rn query=f”””rn — create model tablern CREATE OR REPLACE MODEL `{project}.{bq_dataset}.{bq_model_table}`rn OPTIONS(rn MODEL_TYPE = \’ARIMA_PLUS\’,rn TIME_SERIES_TIMESTAMP_COL = \’hourly_timestamp\’,rn TIME_SERIES_DATA_COL = \’total_sold\’,rn TIME_SERIES_ID_COL = [\’product_name\’],rn MODEL_REGISTRY = \’vertex_ai\’,rn VERTEX_AI_MODEL_ID = \’order_demand_forecasting\’,rn VERTEX_AI_MODEL_VERSION_ALIASES = [\’staging\’]rn ) ASrn SELECTrn hourly_timestamp,rn product_name,rn total_soldrn FROM `{project}.{bq_dataset}.{bq_training_table}`rn WHERE split=’TRAIN’;rn “””,rn project=project,rn location=location,rn ).set_display_name(“train arima plus model”).after(create_training_dataset_op)’), (u’language’, u”), (u’caption’, <wagtail.wagtailcore.rich_text.RichText object at 0x3e42c0a09bd0>)])]
Evaluating time series and model metrics
Once you train the ARIMA_PLUS model, you would need to evaluate the model before generating predictions. In BigQuery ML, you have ML.ARIMA_EVALUATE and ML.EVALUATE functions. The ML.ARIMA_EVALUATE function generates both statistical metrics such as log_likelihood, AIC, and variance and other time series information about seasonality, holiday effects, spikes-and-dips outliers, etc. for all the ARIMA models trained with the automatic hyperparameter tuning enabled by default (auto.ARIMA). The ML.EVALUATE retrieves forecasting accuracy metrics such as the mean absolute error (MAE) and the mean squared error (MSE). To integrate those evaluation functions in a Vertex AI pipeline you can now use the corresponding BigqueryMLArimaEvaluateJobOp and BigqueryEvaluateModelJobOp operators. In both cases they take google.BQMLModel as input and return Evaluation Metrics Artifact as output.
For the BigqueryMLArimaEvaluateJobOp, here is an example of it used in a pipeline component:
code_block[StructValue([(u’code’, u’bq_arima_evaluate_time_series_op = BigqueryMLArimaEvaluateJobOp(rn project=project,rn location=location,rn model=bq_arima_model_op.outputs[‘model’],rn show_all_candidate_models=’false’,rnjob_configuration_query=bq_evaluate_time_series_configuration).set_display_name(“evaluate arima plus time series”).after(bq_arima_model_op)’), (u’language’, u”), (u’caption’, <wagtail.wagtailcore.rich_text.RichText object at 0x3e42c3528110>)])]
Below is the view of statistical metrics (the first five columns) resulting from BigqueryMLArimaEvaluateJobOp operators in a BigQuery table.
Figure 2 – A view of metrics resulting from BigqueryMLArimaEvaluateJobOp in BigQuery
For the BigqueryEvaluateModelJobOp, below you have the corresponding pipeline component:
code_block[StructValue([(u’code’, u’bq_arima_evaluate_model_op = BigqueryEvaluateModelJobOp(rn project=project,rn location=location,rn model=bq_arima_model_op.outputs[‘model’],rn query_statement=f”SELECT * FROM `<my_project_id>.<my_dataset_id>.<train_table_id>` WHERE split=’TEST'”,rn job_configuration_query=bq_evaluate_model_configuration).set_display_name(“evaluate arima_plus model”).after(bq_arima_model_op)’), (u’language’, u”), (u’caption’, <wagtail.wagtailcore.rich_text.RichText object at 0x3e42c0a1b050>)])]
Where you have a query statement to select the test sample to generate evaluation forecast metrics.
As Evaluation Metrics Artifacts in the Vertex ML metadata, you can consume those metrics afterwards for visualizations in the Vertex AI Pipelines UI using Kubeflow SDK visualization APIs. Indeed, Vertex AI allows you to render that HTML in an output page which is easily accessible from the Google Cloud console. Below is an example of a custom forecasting HTML report you can create.
Figure 3 – A custom forecasting accuracy report resulting from BigqueryEvaluateModelJobOp
Also you can use those values to implement conditional if-else logic using Kubeflow SDK condition in the pipeline graph. In this scenario, a model performance condition has been implemented using the average mean squared error in a way that if the trained model average mean squared error is below a certain threshold then the model can be consumed to generate forecast predictions.
Generate and explain demand forecasts
To generate forecasts in the next n hours, you can use the BigqueryForecastModelJobOp which launches a BigQuery forecast model job. The component consumes the google.BQMLModel as Input Artifact and allows you to set the number of time points to forecast (horizon) and the percentage of the future values that fall in the prediction interval (confidence_level). In the example below it has been decided to generate hourly forecasts with a confidence interval of 90%.
Then forecasts are materialized in a predefined destination table using the job_configuration_query parameter which will be tracked as google.BQTable in the Vertex ML Metadata. Below is an example of the forecast table you would get (only the five columns).
Figure 4 – A view of the resulting ARIMA_PLUS forecasts
After you generate your forecasts, you can also explain them using the BigqueryExplainForecastModelJobOp which extends the capabilities of BigqueryForecastModelJobOp operator and allows to use the ML.EXPLAIN_FORECAST function which provides extra model explainability like trend, detected seasonality, and holiday effects.
At the end, here you will see the visualization of the overall pipeline you define in the Vertex AI Pipelines UI.
Figure 5 – The visualization of the pipeline in the Vertex AI Pipelines UI.
And if you want to analyze, debug, and audit ML pipeline artifacts and their lineage, you can access the following representation in the Vertex ML Metadata by clicking on one of the yellow artifact objects rendered by the Google Cloud console.
Figure 6 – The ML lineage of demand forecast pipeline in Vertex ML Metadata.
Conclusion
In this blogpost, we described the new BigQuery and BigQuery ML (BQML) components now available for Vertex AI Pipelines, enabling data scientists and ML engineers to orchestrate and automate any BigQuery and BigQuery ML functions. We also showed an end-to-end example of using the components for demand forecasting involving BigQuery ML and Vertex AI Pipelines.
What’s next
Are you ready for running your BQML pipeline with Vertex AI Pipelines? Check out the following resources and give it a try:
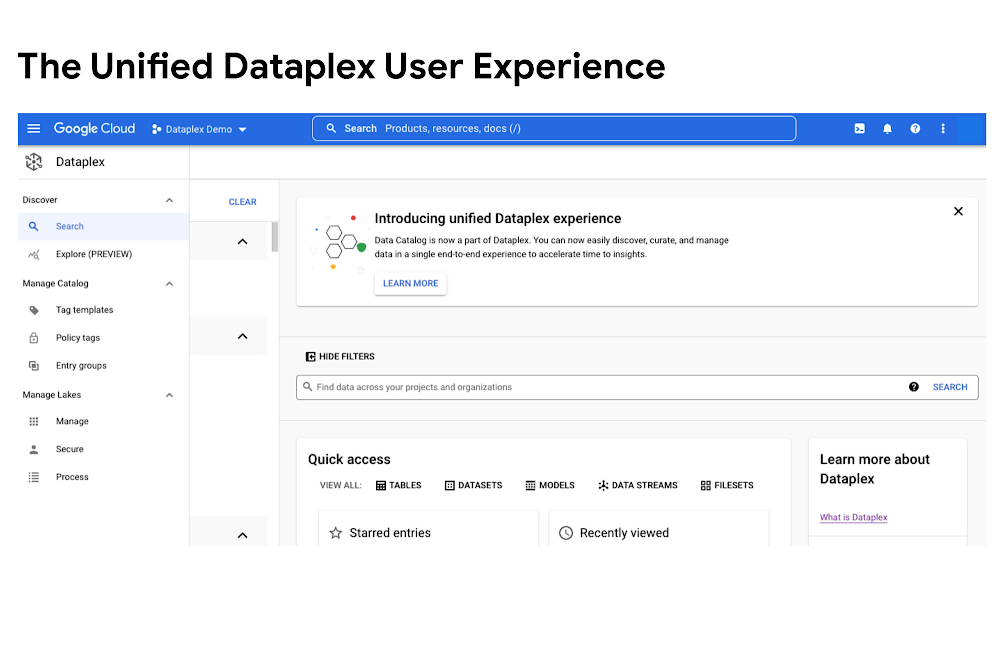
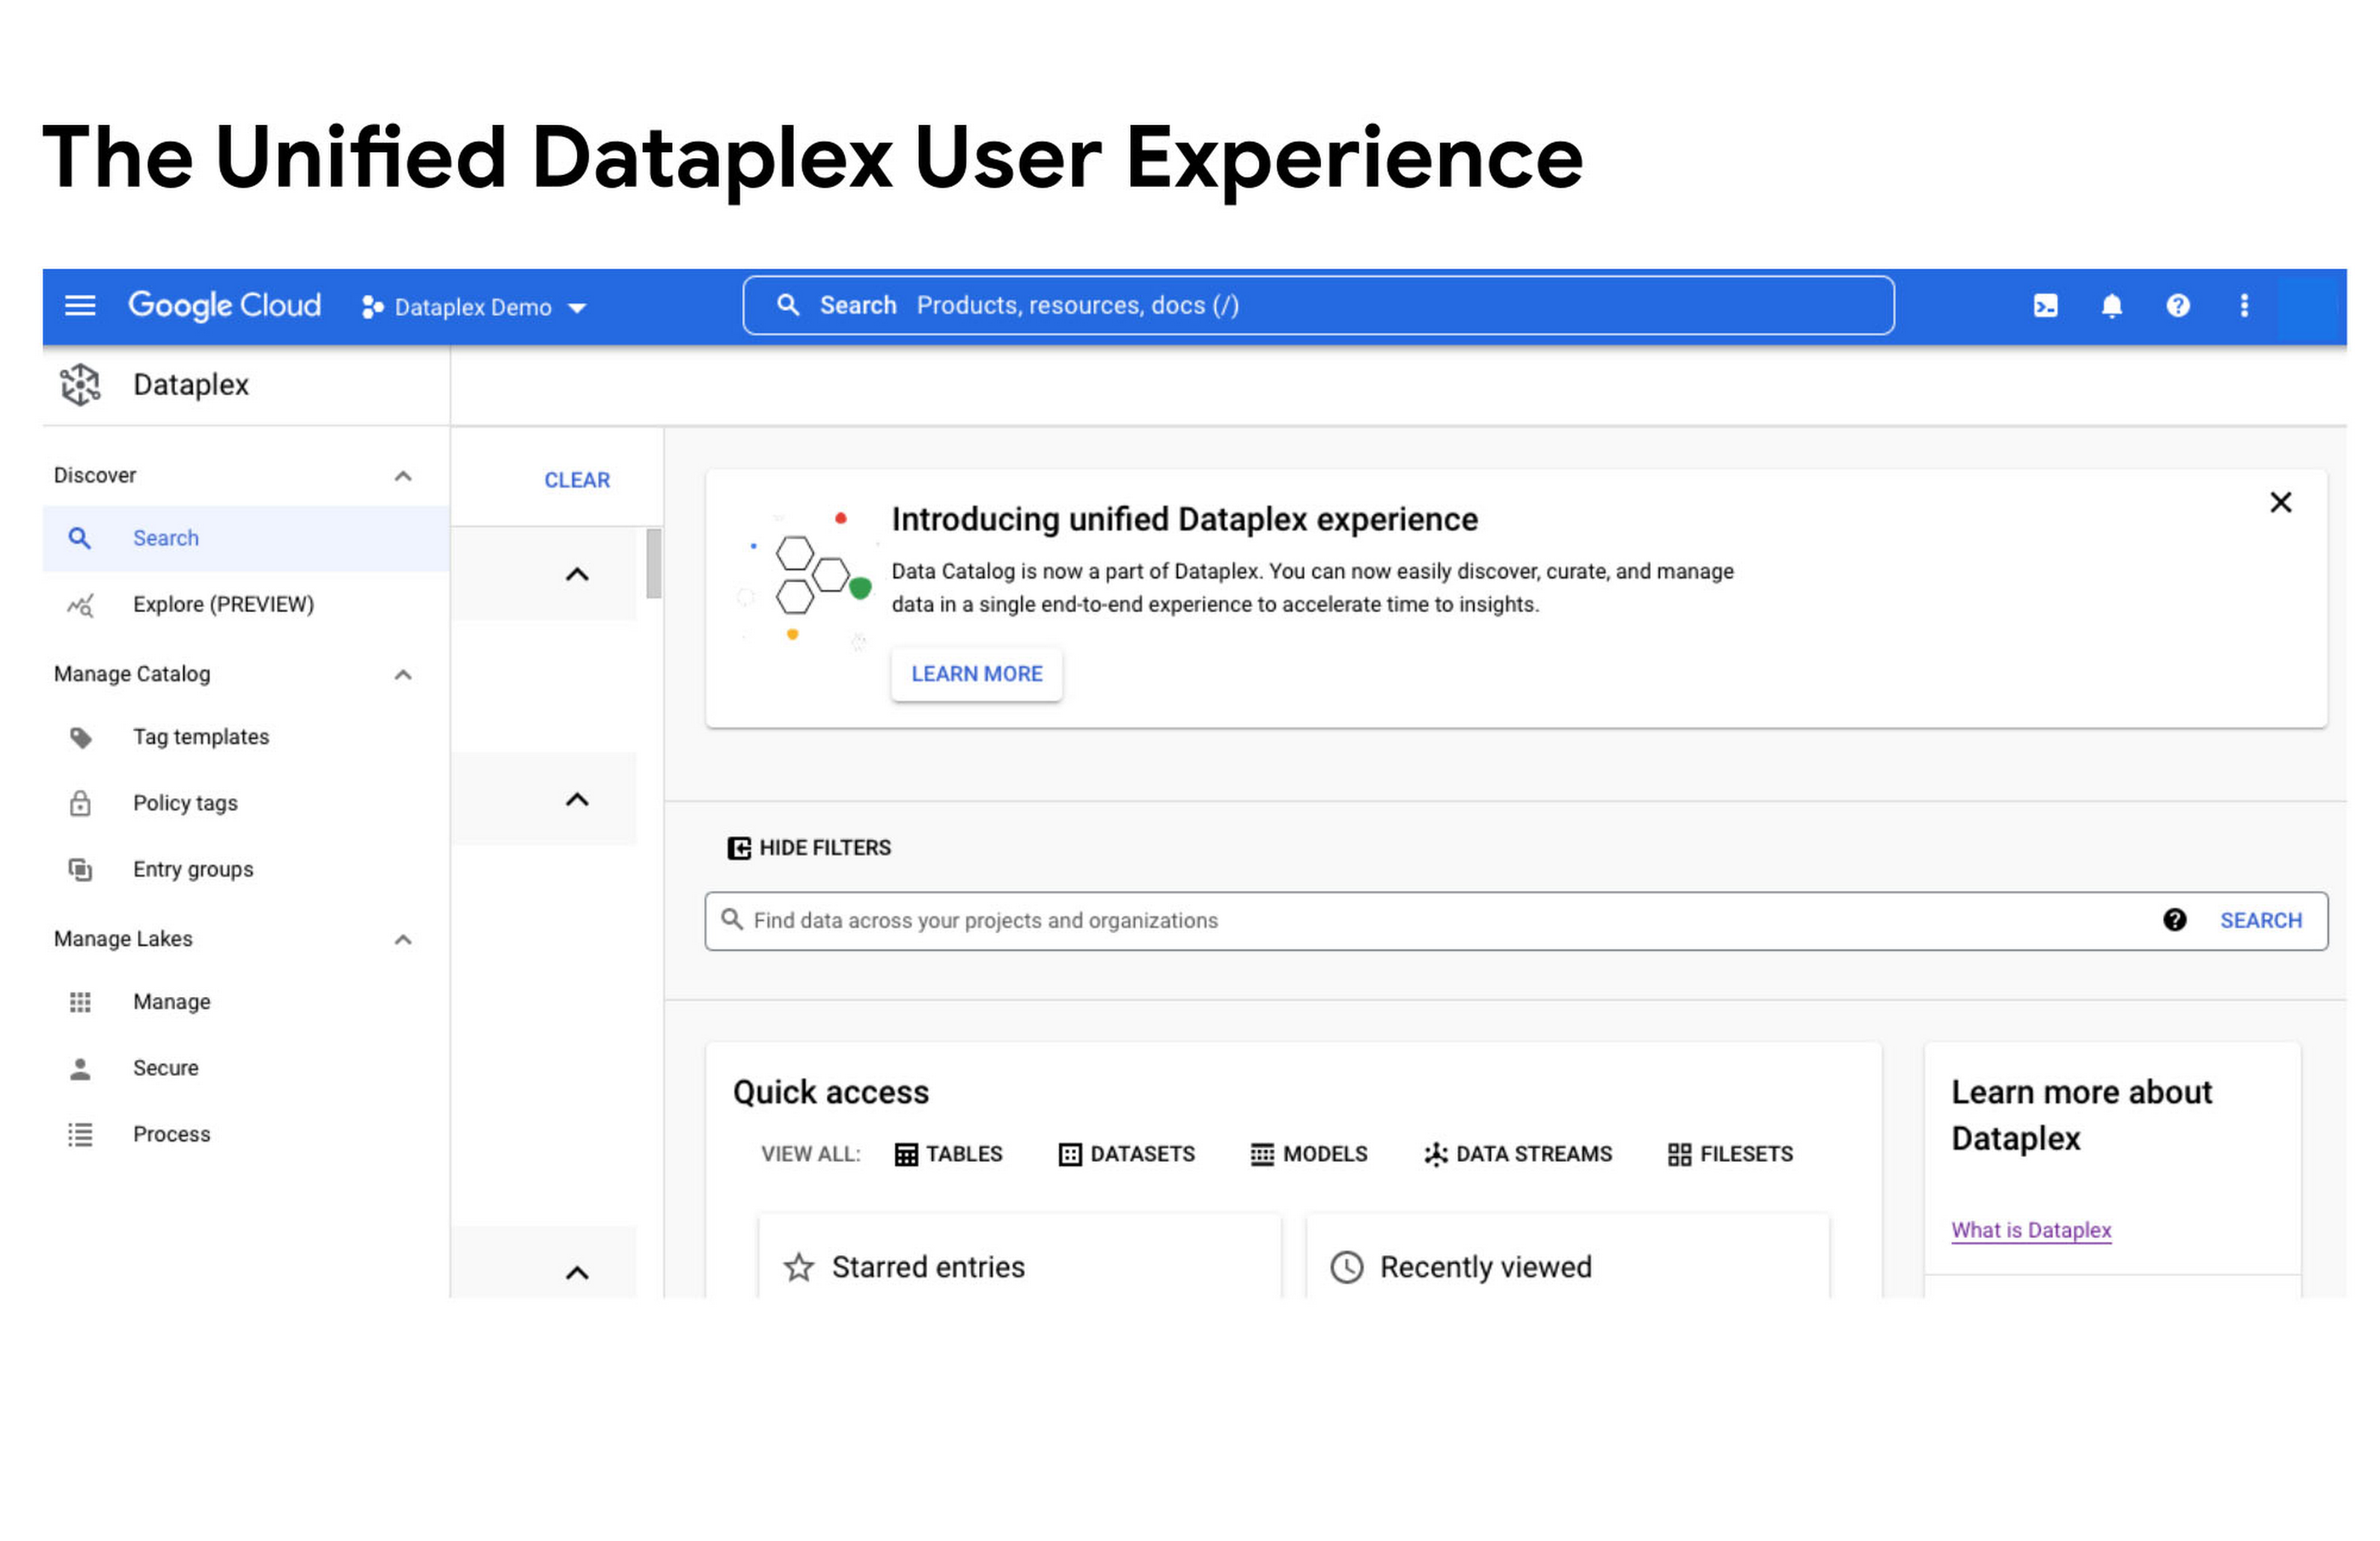
Today, we are excited to announce that Google Cloud Data Catalog will be unified with Dataplex into a single user interface. With this unification, customers have a single experience to search and discover their data, enrich it with relevant business context, organize it by logical data domains, and centrally govern and monitor their distributed data with built-in data intelligence and automation capabilities. Customers now have access to an integrated metadata platform that connects technical and operational metadata with business metadata, and then uses this augmented and active metadata to drive intelligent data management and governance.
The enterprise data landscape is becoming increasingly diverse and distributed with data across multiple storage systems, each having its own way of handling metadata, security, and governance. This creates a tremendous amount of operational complexity, and thus, generates strong market demand for a metadata platform that can power consistent operations across distributed data.
Dataplex provides a data fabric to automate data management, governance, discovery, and exploration across distributed data at scale. With Dataplex, enterprises can easily organize their data into data domains, delegate ownership, usage, and sharing of data to data owners who have the right business context, while still maintaining a single pane of glass to consistently monitor and govern data across various data domains in their organization.
Prior to this unification, data owners, stewards and governors had to use two different interfaces – Dataplex to organize, manage, and govern their data, and Data Catalog to discover, understand, and enrich their data. Now with this unification, we are creating a single coherent user experience where customers can now automatically discover and catalog all the data they own, understand data lineage, check for data quality, augment that metadata with relevant business context, organize data into business domains, and then use that combined metadata to power data management. Together we provide an integrated experience that serves the full spectrum of data governance needs in an organization, enabling data management at scale.
“With Data Catalog now being part of Dataplex, we get a unified, simplified, and streamlined experience to effectively discover and govern our data, which enables team productivity and analytics agility for our organization. We can now use a single experience to search and discover data with relevant business context, organize and govern this data based on business domains, and enable access to trusted data for analytics and data science – all within the same platform.” saidElton Martins, Senior Director of Data Engineering at Loblaw Companies Limited.
Getting started
Existing Data Catalog and Dataplex customers and new customers can now start using Dataplex for metadata discovery, management and governance. Please note that while the user experience interface is unified via this release, all existing APIs and feature functionalities of both products will continue to work as before. To learn more, please refer to technical documentations or contact the Google Cloud sales team.
Today, we are pleased to announce three major releases that bring the power of Google Cloud’s Dataflow to more developers for expanded use cases and higher data processing workloads, while keeping the costs low, as part of our goal to democratize the power of big data, real time streaming, and ML/AI for all developers, everywhere.
The three big Dataflow releases we’re thrilled to announce in general availability are:
Dataflow Prime – Dataflow Prime takes the serverless, no-operation benefits of Dataflow to a totally new level. Dataflow Prime allows users to take advantage of both horizontal autoscaling (more machines) and vertical autoscaling (larger machines with more memory) automatically for your streaming data processing workloads, with batch coming in the near future. With Dataflow Prime, pipelines are more efficient, enabling you to apply the insights in real time.
Dataflow Go – Dataflow Go provides native support for Go, a rapidly growing programming language thanks to its flexibility, ease of use and differentiated concepts, for both batch and streaming data processing workloads. With Apache Beam’s unique multi-language model, Dataflow Go pipelines can leverage the well adopted, best-in-class performance provided by the wide range of Java I/O connectors with ML transforms and I/O connectors from Python coming soon.
Dataflow ML – Speaking of ML transforms, Dataflow now has added out of the box support for running PyTorch and scikit-learn models directly within the pipeline. The new RunInference transform enables simplicity by allowing models to be used in production pipelines with very little code. These features are in addition to Dataflow’s existing ML capabilities such as GPU support and the pre and post processing system for ML training, either directly or via frameworks such as Tensorflow Extended (TFX).
We’re so excited to make Dataflow even better. With the world’s only truly unified batch and streaming data processing model provided by Apache Beam, the wide support for ML frameworks, and the unique cross-language capabilities of the Beam model, Dataflow is becoming ever easier, faster, and more accessible for all data processing needs.
Getting started
To get started with Dataflow Go easily, see the Quickstart and download the Go SDK.To learn more about Dataflow Prime, see the documentation. To learn more about Dataflow ML and RunInference, read about the new RunInference Beam transform on the Apache Beam website.
Interested in running a proof of concept using your own data? Talk to your Google Cloud sales contact for hands-on workshop opportunities or sign up here.
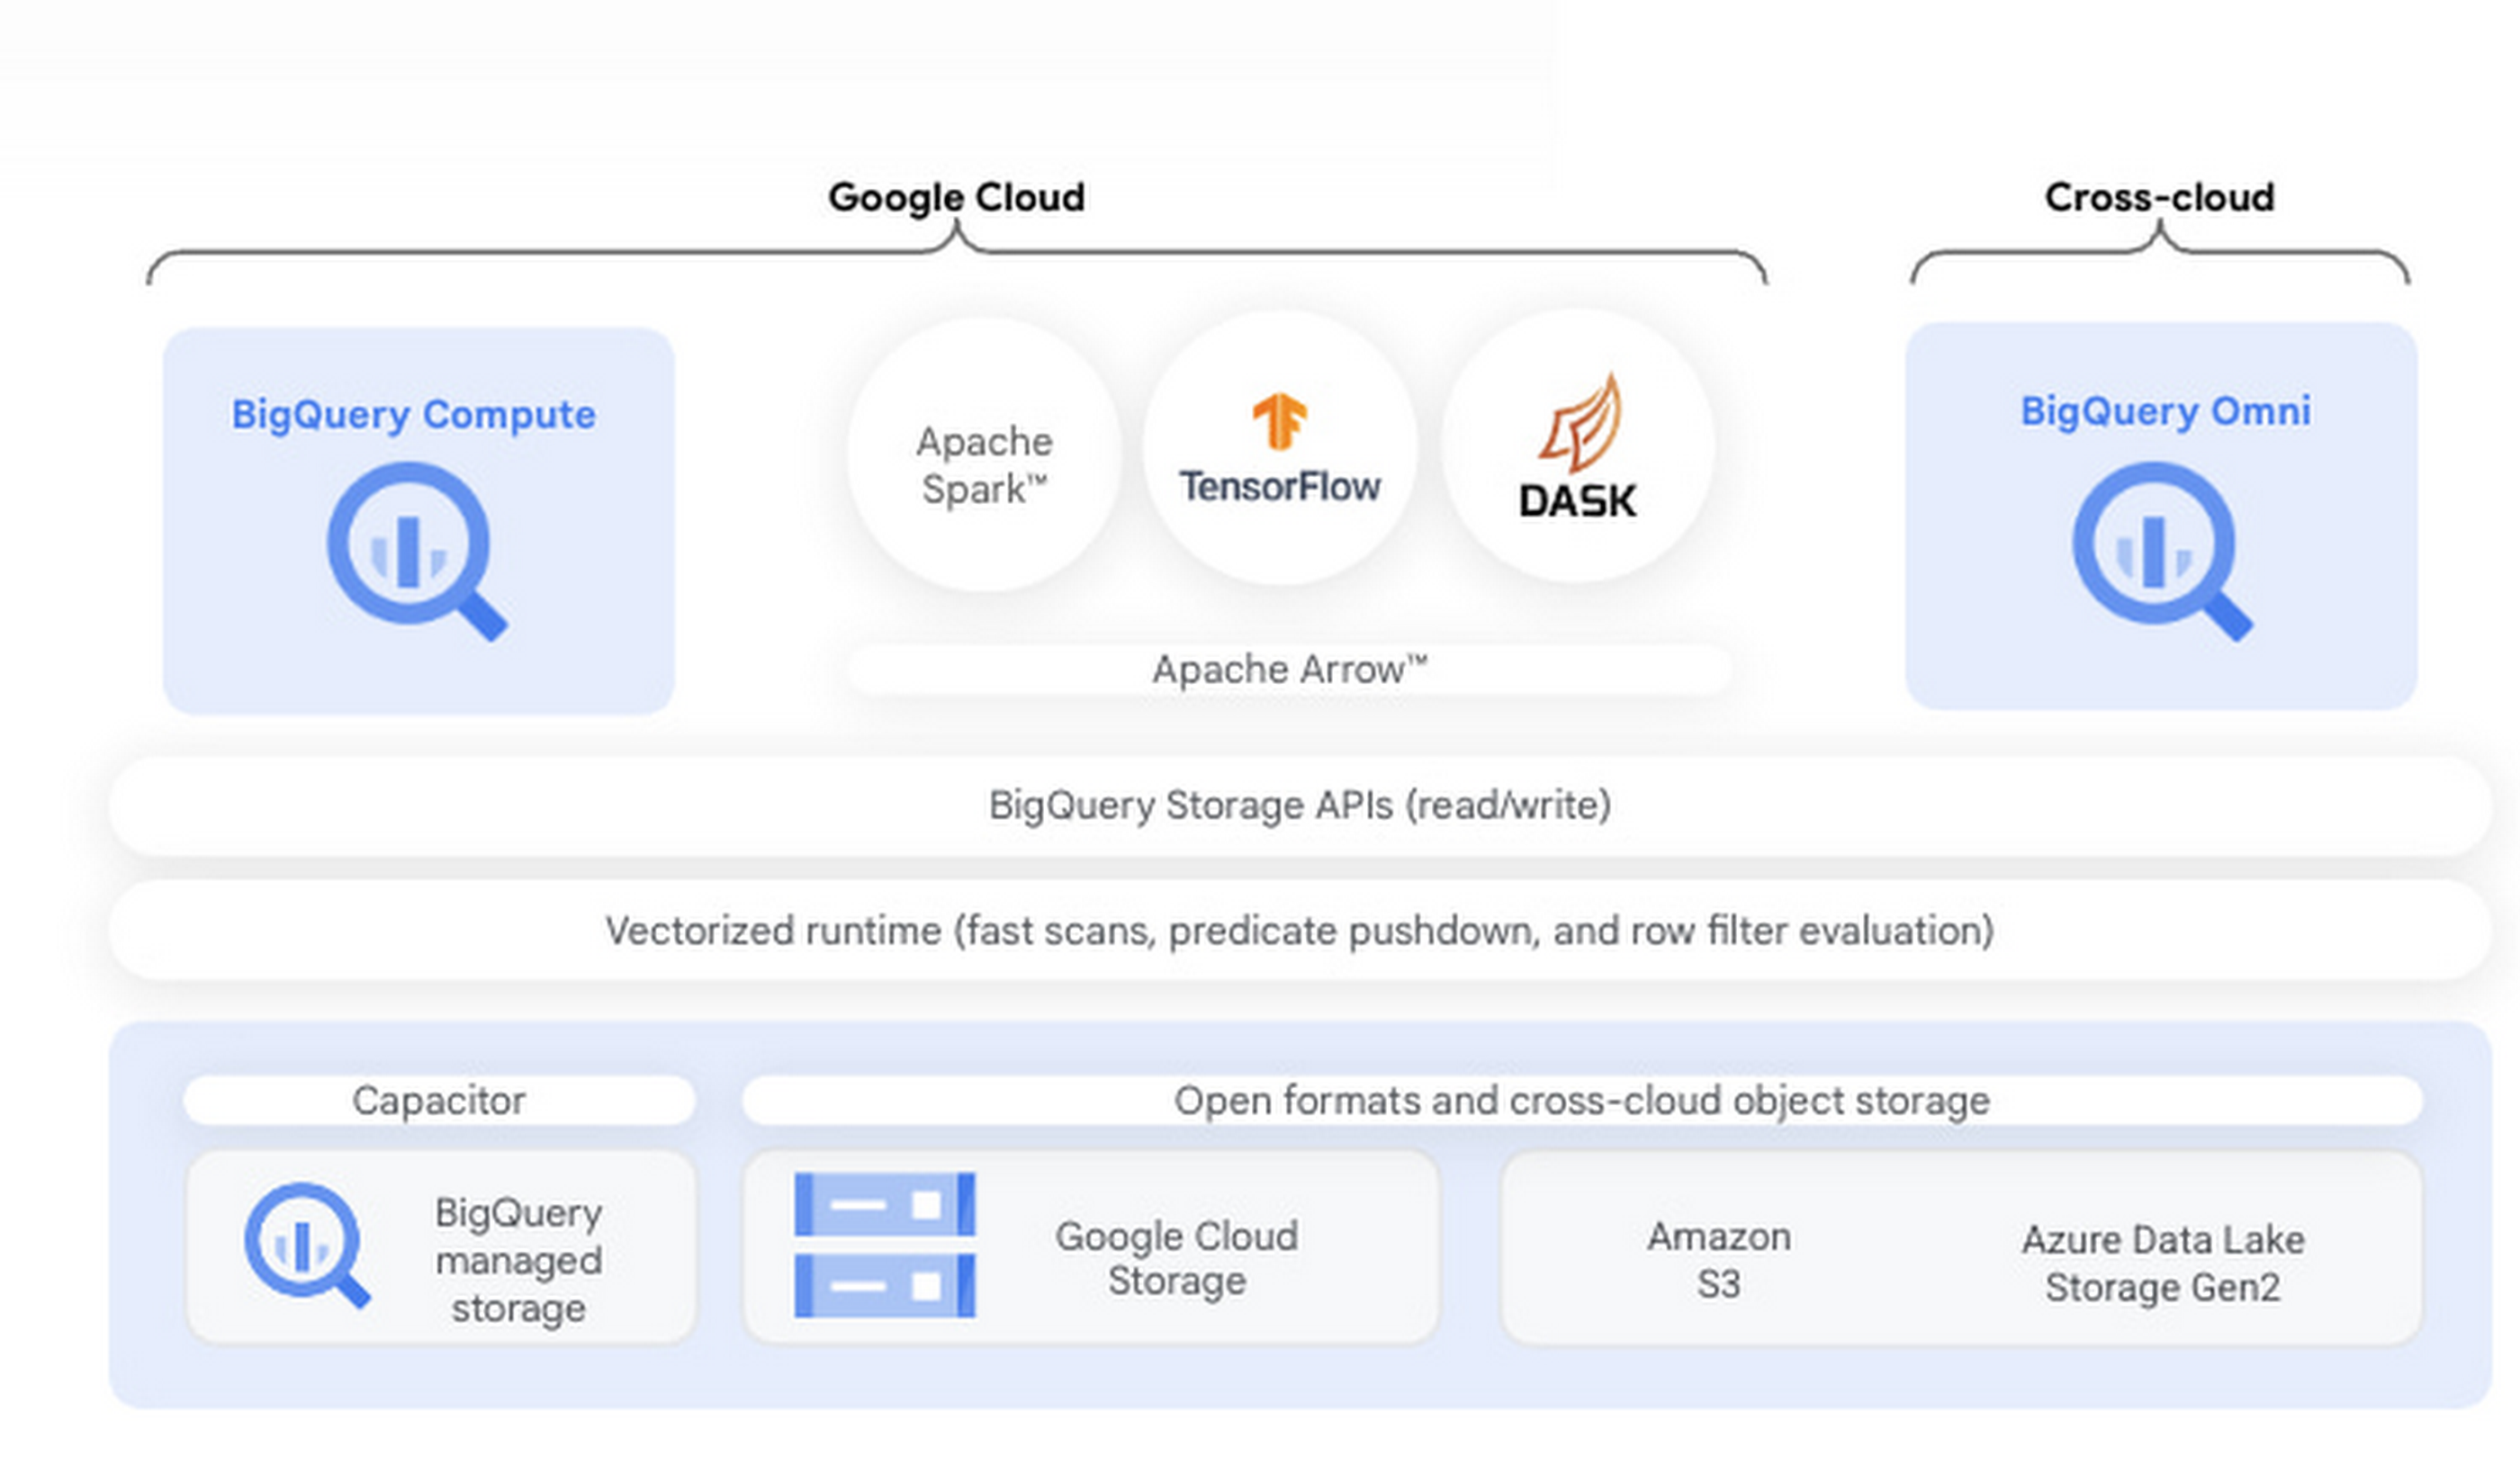
BigQuery is Google Cloud’s fully managed serverless data platform that supports querying using ANSI SQL. BigQuery also has a data lake storage engine that unifies SQL queries with other open source processing frameworks such as Apache Spark, Tensorflow, and Dask. BigQuery storage provides an API layer for OSS engines to process data. This API enables mixing and matching programming in languages like Python with structured SQL in the same data platform. This post provides an introduction to using BigQuery with one popular distributed Python framework, Dask, an open source library that makes it easy to scale Python tools to BigQuery sized datasets. We will also show you how to extend Dask with RAPIDS, a suite of open-source libraries and APIs to execute GPU-accelerated pipelines directly on BigQuery storage.
Integrating Dask and RAPIDS with BigQuery storage
A core component of BigQuery architecture is the separation of compute and storage. BigQuery storage can be directly accessed over a highly performant Storage Read API which enables users to consume data in multiple streams and provides both column projections and filtering at the storage level. Coiled, a Google Cloud Partner that provides enterprise-grade Dask in your GCP account, developed an open-source Dask-BigQuery connector (GitHub) that enables Dask processing to take advantage of the Storage Read API and governed access to BigQuery data. RAPIDSis an open sourced library spawned from NVIDIA that uses Dask to distribute data and computation over multiple NVIDIA GPUs. The distributed computation can be done on a single machine or in a multi-node cluster. Dask integrates with both RAPIDS cuDF, XGBoost, and RAPIDS cuML for GPU-accelerated data analytics and machine learning.
To start using Dask using BigQuery data, you can install the dask-bigquery connector from any Python IDE. You simply install `dask-bigquery` with `pip` or `conda`, authenticate with Google Cloud, and then use the few lines of python code as shown below to pull data from a BigQuery table.
Achieving Python scalability on BigQuery with Dataproc
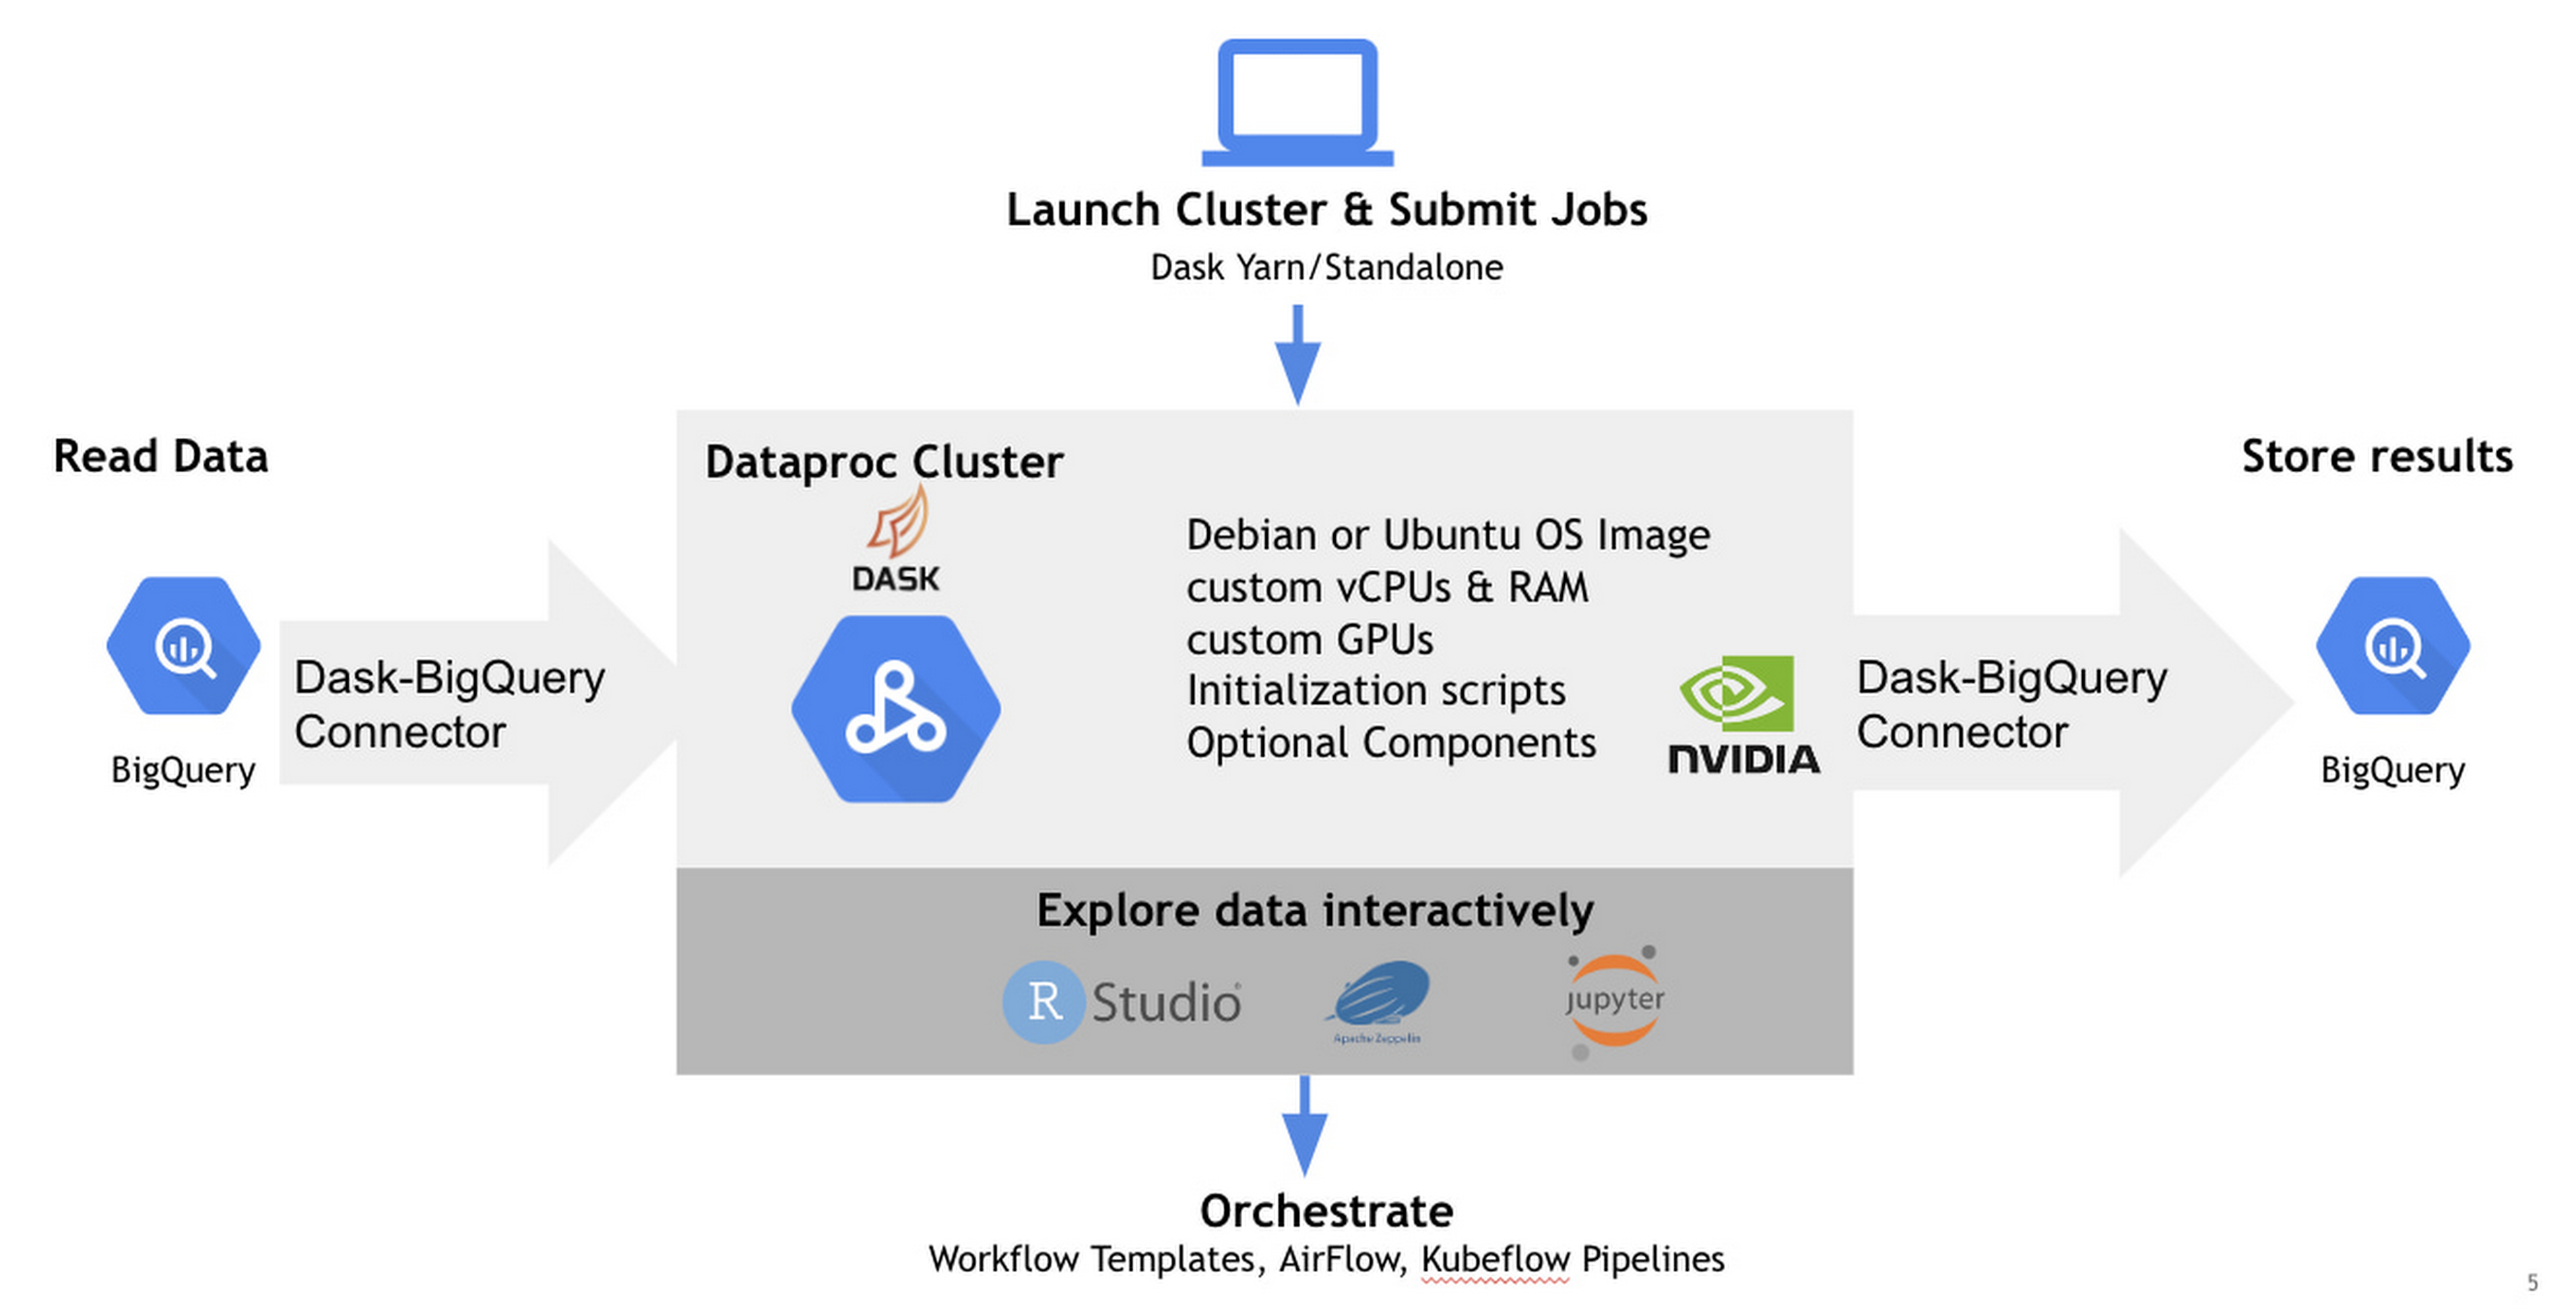
While Dask and the BQ connector can essentially be installed anywhere that Python can be run and scale to the number of cores available in that machine, the real power of scaling comes in when you can use an entire cluster of virtual machines. An easy way to do this on Google Cloud is by using Dataproc.
Using the initialization actions outlined in this GitHub repo, getting setup with Dask and RAPIDS on a Dataproc cluster with NVIDIA GPUs is fairly straightforward.
Let’s walk through an example using the NYC taxi dataset.
As a first step, let’s create a RAPIDS accelerated Dask yarn cluster object on Dataproc by running the following code:
Next, let’s use RAPIDS Dask cuDF libraries to accelerate the preprocessing with GPUs.
code_block[StructValue([(u’code’, u”taxi_df = dask_cudf.from_dask_dataframe(d_df)rntaxi_df = clean(taxi_df, remap, must_haves)rntaxi_df = taxi_df.query(‘ and ‘.join(query_frags))”), (u’language’, u”), (u’caption’, <wagtail.wagtailcore.rich_text.RichText object at 0x3e6ba345dc90>)])]
Finally, we can use a feature of the Dask dataframe to split into two datasets — one for training and one for testing. These datasets can also be converted to XGBoost Dmatrix and sent into XGBoost for training on GPU.
The complete notebook can be accessed at this GitHub link. Currently, Dask-BigQuery connector doesn’t support native write back to BigQuery, user need work around that through cloud storage, with Dask or Dask Rapids, write back to GCS first with `to_parquet(“gs://temp_path/”)`, then having BigQuery load from GCS with: `bigquery.Client.load_table_from_uri(“gs://temp_path/”)`.
What’s next
In this blog, we introduced a few key components to allow BigQuery users to scale their favorite Python libraries through Dask to process large datasets. With the broad portfolio of NVIDIA GPUs embedded across Google Cloud data analytics services like BigQuery and Dataproc and the availability of GPU-accelerated software like RAPIDS, developers can significantly accelerate their analytics and machine learning workflows.
Acknowledgements: Benjamin Zaitlen, Software Engineer Manager, NVIDIA; Jill Milton, Senior Partnership Manager, NVIDIA, Coiled Developer Team.
Google Cloud Data Heroes is a series where we share stories of the everyday heroes who use our data tools to do incredible things. Like any good superhero tale, we explore our Google Cloud Data Heroes’ origin stories, how they moved from data chaos to a data-driven environment, what projects and challenges they are overcoming now, and how they give back to the community.
In this month’s edition, we’re pleased to introduce Tomi! Tomi grew up in Croatia, and is now residing in Berlin, Germany, where he currently works as a freelance Google Cloud data engineer. In this role, he regularly uses BigQuery. Tomi’s familiarity with BigQuery and his passion for Google Cloud led him to creating the weekly newsletter Not So BigQuery, where he discusses the latest data-related information from the GCP world. Additionally, he also works for one of the largest automotive manufacturers in Germany as an analyst. When not in front of the keyboard, Tomi enjoys walking with his dog and his girlfriend, going to bakeries, or spending a night watching television.
When were you introduced to the cloud, tech, or data field? What made you pursue this in your career?
I always struggled with the question ‘what do you want to do in your life?. I attended school at Zagreb University of Applied Science for my information technology studies degree, but I was still unsure if I should become a developer, data engineer or something completely different.
A couple of years into working as a junior IT Consultant, I stumbled upon a job advertisement looking for a Data Analyst/Scientist. Back then, finding out that you can get paid to just work with data all day sounded mind-blowing to me. A dream job.
I immediately applied for the role and started learning about the skills needed. This is also where I gained my first experience with the Cloud as I signed up for a Google Cloud Platform free trial in February 2018. On the platform, there was a blog post describing how to run Jupyter notebooks in the Cloud. It interested me, and I went ahead and created my very first Compute Engine instance in Google Cloud Platform.
I didn’t get the job I initially applied for, but this was the trigger for me that set things in motion and got me to where I am now.
What courses, studies, degrees, or certifications were instrumental to your progression and success in the field? In your opinion, what data skills or competencies should data practitioners be focusing on acquiring to be successful in 2022 and why?
Looking back at my university days, I really enjoyed the course about databases, which was partially because I had a really great teacher, but also because this was the first time I got to do something which catered to my then still-unknown data-nerdy side.
In 2019, I got my Google Cloud Certified Associate Cloud Engineer Certification which was a challenging and rewarding entry-level certification for Google Cloud. I would recommend considering getting one of these as a way of focusing one’s learning.
One major change I’ve observed since working in the data field is the ongoing transition from on-prem to cloud and serverless. I remember a story from my early consulting days working in an IT operations team, when there was a major incident caused by an on-prem server outage. At some point one frustrated colleague said something like, ‘why do we even have to have servers? Why can’t it just *run* somehow?’ What sounded like a bit of a silly question back then turned out to be quite ‘visionary’ with all the serverless and cloud-based tech we have today.
What drew you to Google Cloud? Tell us about that process, what you’re most proud of in this area, and why you give back to the community?
There is this great newsletter on Google Cloud Platform called GCP Weekly, run by a data community member named Zdenko Hrček that I really like. However, since the GCP ecosystem is growing at a rapid pace there are sometimes just too many news and blogs in a single week. I really struggled to catch up with all the new product updates and tutorials. That’s when I had the idea: ‘what if there would be a shorter newsletter with only news about BigQuery and other data-related tools’? Fast forward to today, my Not So BigQuery newsletter has more than 220 subscribers.
I was also inspired by the awesome content created by Priyanka Vergadia, Staff Developer Advocate at Google Cloud, such as her Sketchnotes series. I created the GCP Data Wiki, which is a public Notion page with cards for every database/storage service in GCP with useful details such as links to official docs, Sketchnotes and more.
What are 1-2 of your favorite projects you’ve done with Google Cloud’s data products?
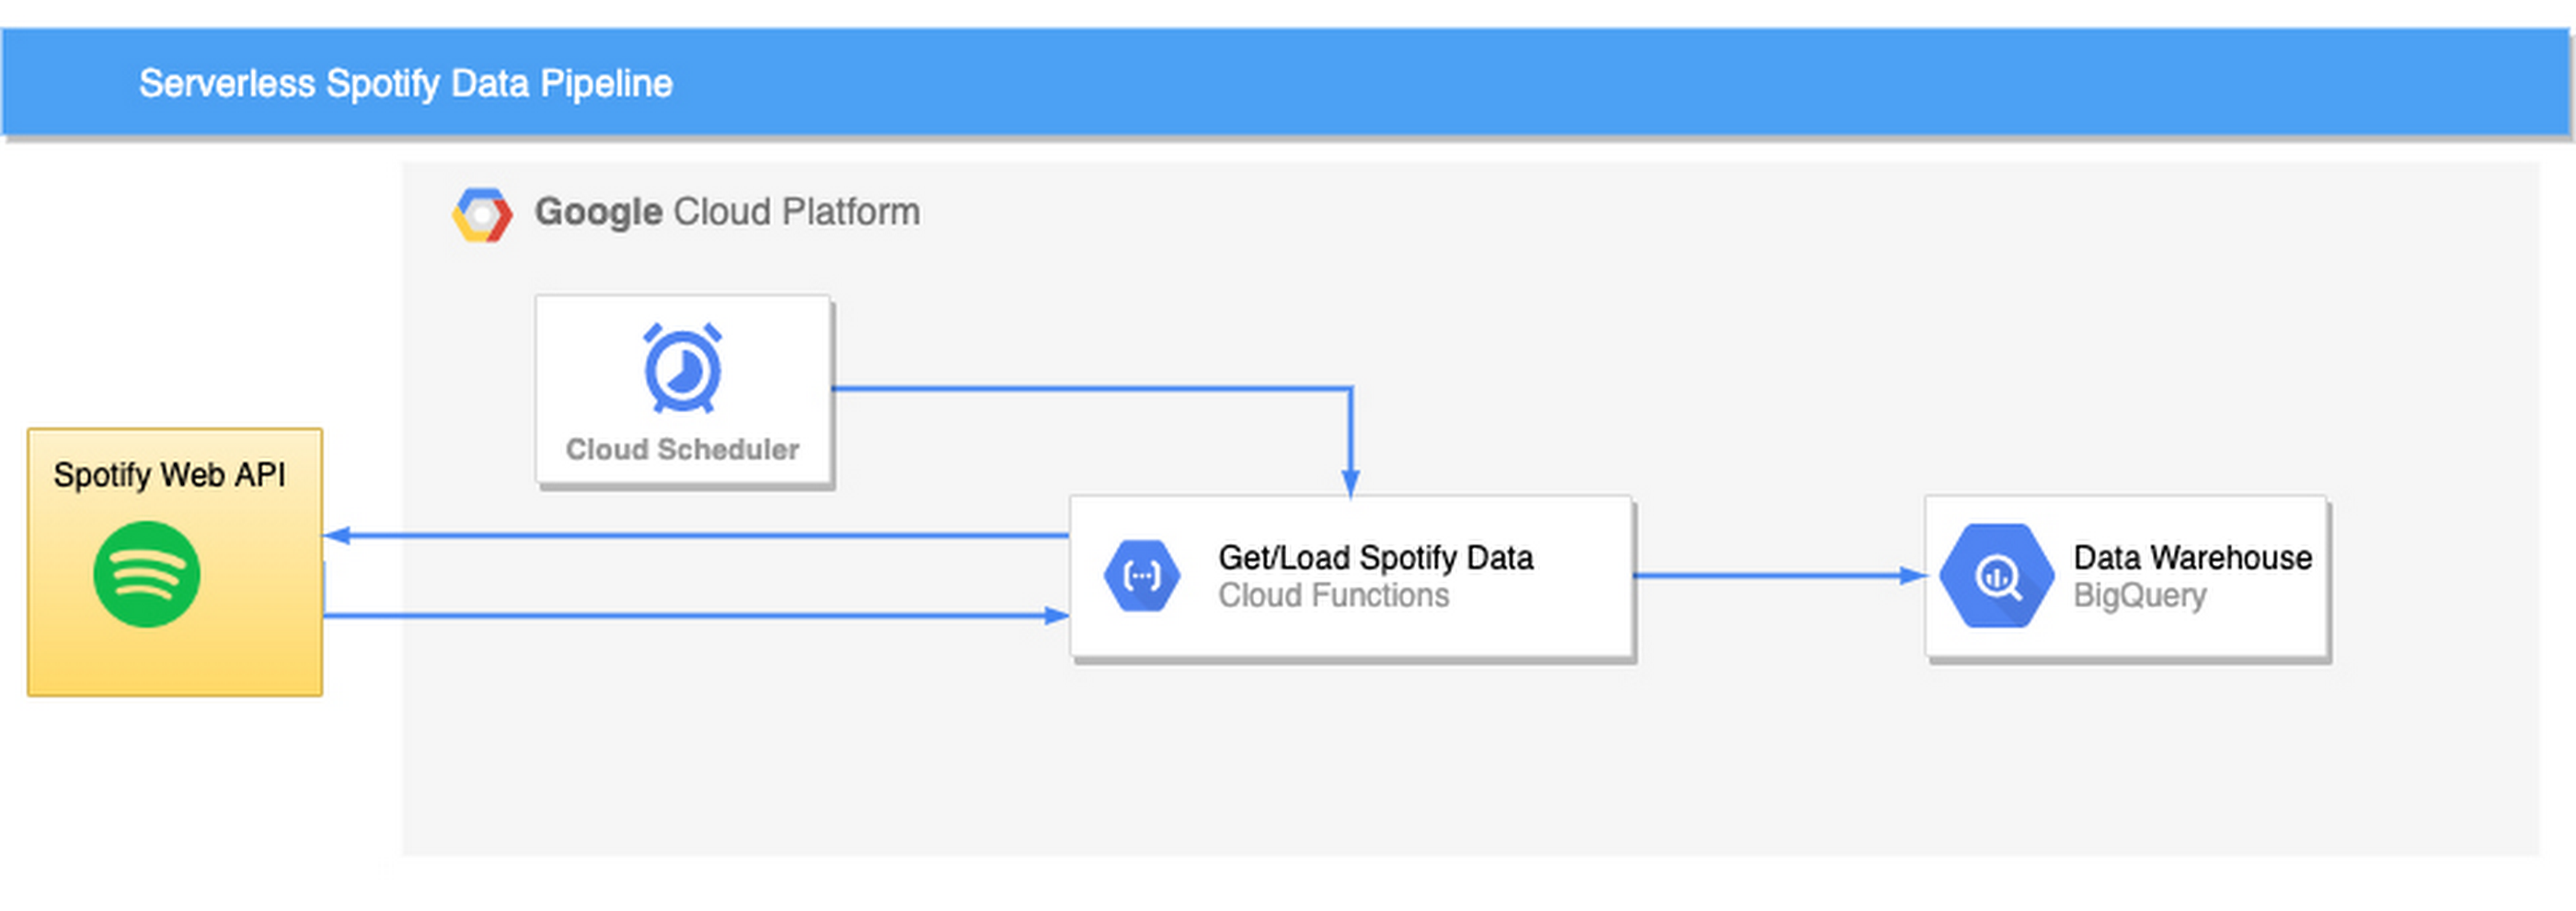
One of my first projects built with Google Cloud products was an automated data pipeline to get track data from the official Spotify API. I was looking for a data project to add to my portfolio and found out that Spotify lets you query their huge library via a REST API. This later evolved into a fully-serverless pipeline running on Google Cloud Functions and BigQuery. I also wrote a blog post about the whole thing, which got 310 claps on Medium.
Additionally, the Not So BigQuery newsletter I created is actually powered by a tool I built using Google Sheets and Firebase (Functions). I have a Google Sheet where I pull in the news feed sections from sources such as the Google Cloud Blog and Medium. Using the built-in Sheets formulas such as IMPORTFEED and FILTER, I built a keyword-based article curation algorithm pre-selecting the articles to include in the next issue of the newsletter. Then my tool called crssnt (pronounced as the french pastry) takes the data from the Google Sheet and displays it in the newsletter. If you are curious how the Google Sheet looks like, you can check it out here.
What are your favorite Google Cloud Platform data products within the data analytics, databases, and/or AI/ML categories? What use case(s) do you most focus on in your work? What stands out about GCP’s offerings?
My favorite is BigQuery but I’m also a huge fan of Firestore. BigQuery is my tool of choice for pretty much all of my data warehouse needs (for both personal and client projects). What really stood out to me for me is the ease of use when it comes to setting up new databases from scratch and getting first results in the form of e.g. a Data Studio dashboard built on top of a BigQuery table. Similarly, I always go back to Firestore whenever I have an idea about some new front-end project since it’s super easy to get started and gives me a lot of flexibility.
From similar non-Google products, I used Snowflake a while ago but didn’t find the user interface nearly as intuitive and user-friendly as BigQuery.
What’s next for you in life?
It’s going to be mostly ‘more of the same’ for me: as a data nerd, there is always something new to discover and learn.
My overall message to readers would be to try to not worry too much about fitting into predefined career paths, job titles and so on, and just do your thing. There is always more than one way of doing things and reaching your goals.
Want to join the Data Engineer Community?
Register for the Data Engineer Spotlight on July 20th, where attendees have the chance to learn from four technical how-to sessions and hear from Google Cloud Experts on the latest product innovations that can help you manage your growing data.
Begin your own Data Hero journey
Ready to embark on your Google Cloud data adventure? Begin your own hero’s journey with GCP’s recommended learning path where you can achieve badges and certifications along the way. Join the Cloud Innovators program today to stay up to date on more data practitioner tips, tricks, and events.
It is not unusual for customers to load very large data sets into their enterprise data warehouse. Whether you are doing an initial data ingestion with hundreds of TB of data or incrementally loading from your systems of record, performance of bulk inserts is key to quicker insights from the data. The most common architecture for batch data loads uses Google Cloud Storage(Object storage) as the staging area for all bulk loads. All the different file formats are converted into an optimized Columnar format called ‘Capacitor’ inside BigQuery.
This blog will focus on various file types and data loading tools for best performance. Data files that are uploaded to BigQuery, typically come in Comma Separated Values(CSV), Avro, Parquet, JSON, ORC formats. We are going to use a large dataset to compare and contrast each of these file formats. We will explore loading efficiencies of compressed vs. uncompressed data for each of these file formats. Data can be loaded into BigQuery using multiple tools in the GCP ecosystem. You can use the Google Cloud console, bq load command, using the BigQuery API or using the client libraries. We will also compare and contrast each loading mechanism for the same dataset. This blog attempts to elucidate the various options for bulk data loading into BigQuery and also provides data on the performance for each file-type and loading mechanism.
Introduction
There are various factors you need to consider when loading data into BigQuery.
Data file format
Data compression
Tool used to load data
Level of parallelization of data load
Schema autodetect ‘ON’ or ‘OFF’
Data file format Bulk insert into BigQuery is the fastest way to insert data for speed and cost efficiency. Streaming inserts are however more efficient when you need to report on the data immediately. Today data files come in many different file types including comma separated(CSV), json, parquet, avro to name a few. We are often asked how the file format matters and whether there are any advantages in choosing one file format over the other.
CSV files (comma-separated values) contain tabular data with a header row naming the columns. When loading data one can parse the header for column names. When loading from csv files one can use the header row for schema autodetect to pick up the columns. With schema autodetect set to off, one can skip the header row and create a schema manually, using the column names in the header. CSV files can use other field separator/newline characters too as a separator, since many data outputs already have a comma in the data. You cannot store nested or repeated data in CSV file format.
JSON (JavaScript object notation) data is stored as a key-value pair in a semi structured format. JSON is preferred as a file type because it can store data in a hierarchical format. The schemaless nature of json data rows gives the flexibility to evolve the schema and thus change the payload. JSON and XML formats are user-readable, but JSON documents are typically much smaller than XML. REST-based web services use json over other file types.
Parquet is a column-oriented data file format designed for efficient storage and retrieval of data. Parquet compression and encoding is very efficient and provides improved performance to handle complex data in bulk.
Avro: The data is stored in a binary format and the schema is stored in JSON format. This helps in minimizing the file size and maximizes efficiency. Avro has reliable support for schema evolution by managing added, missing, and changed fields.
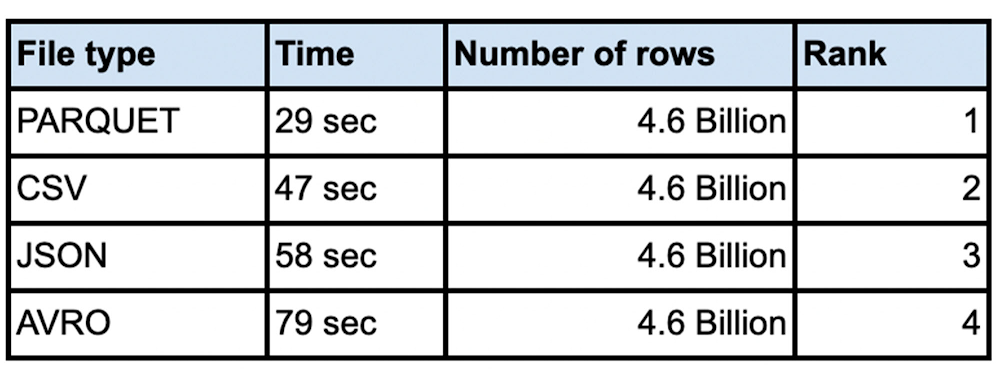
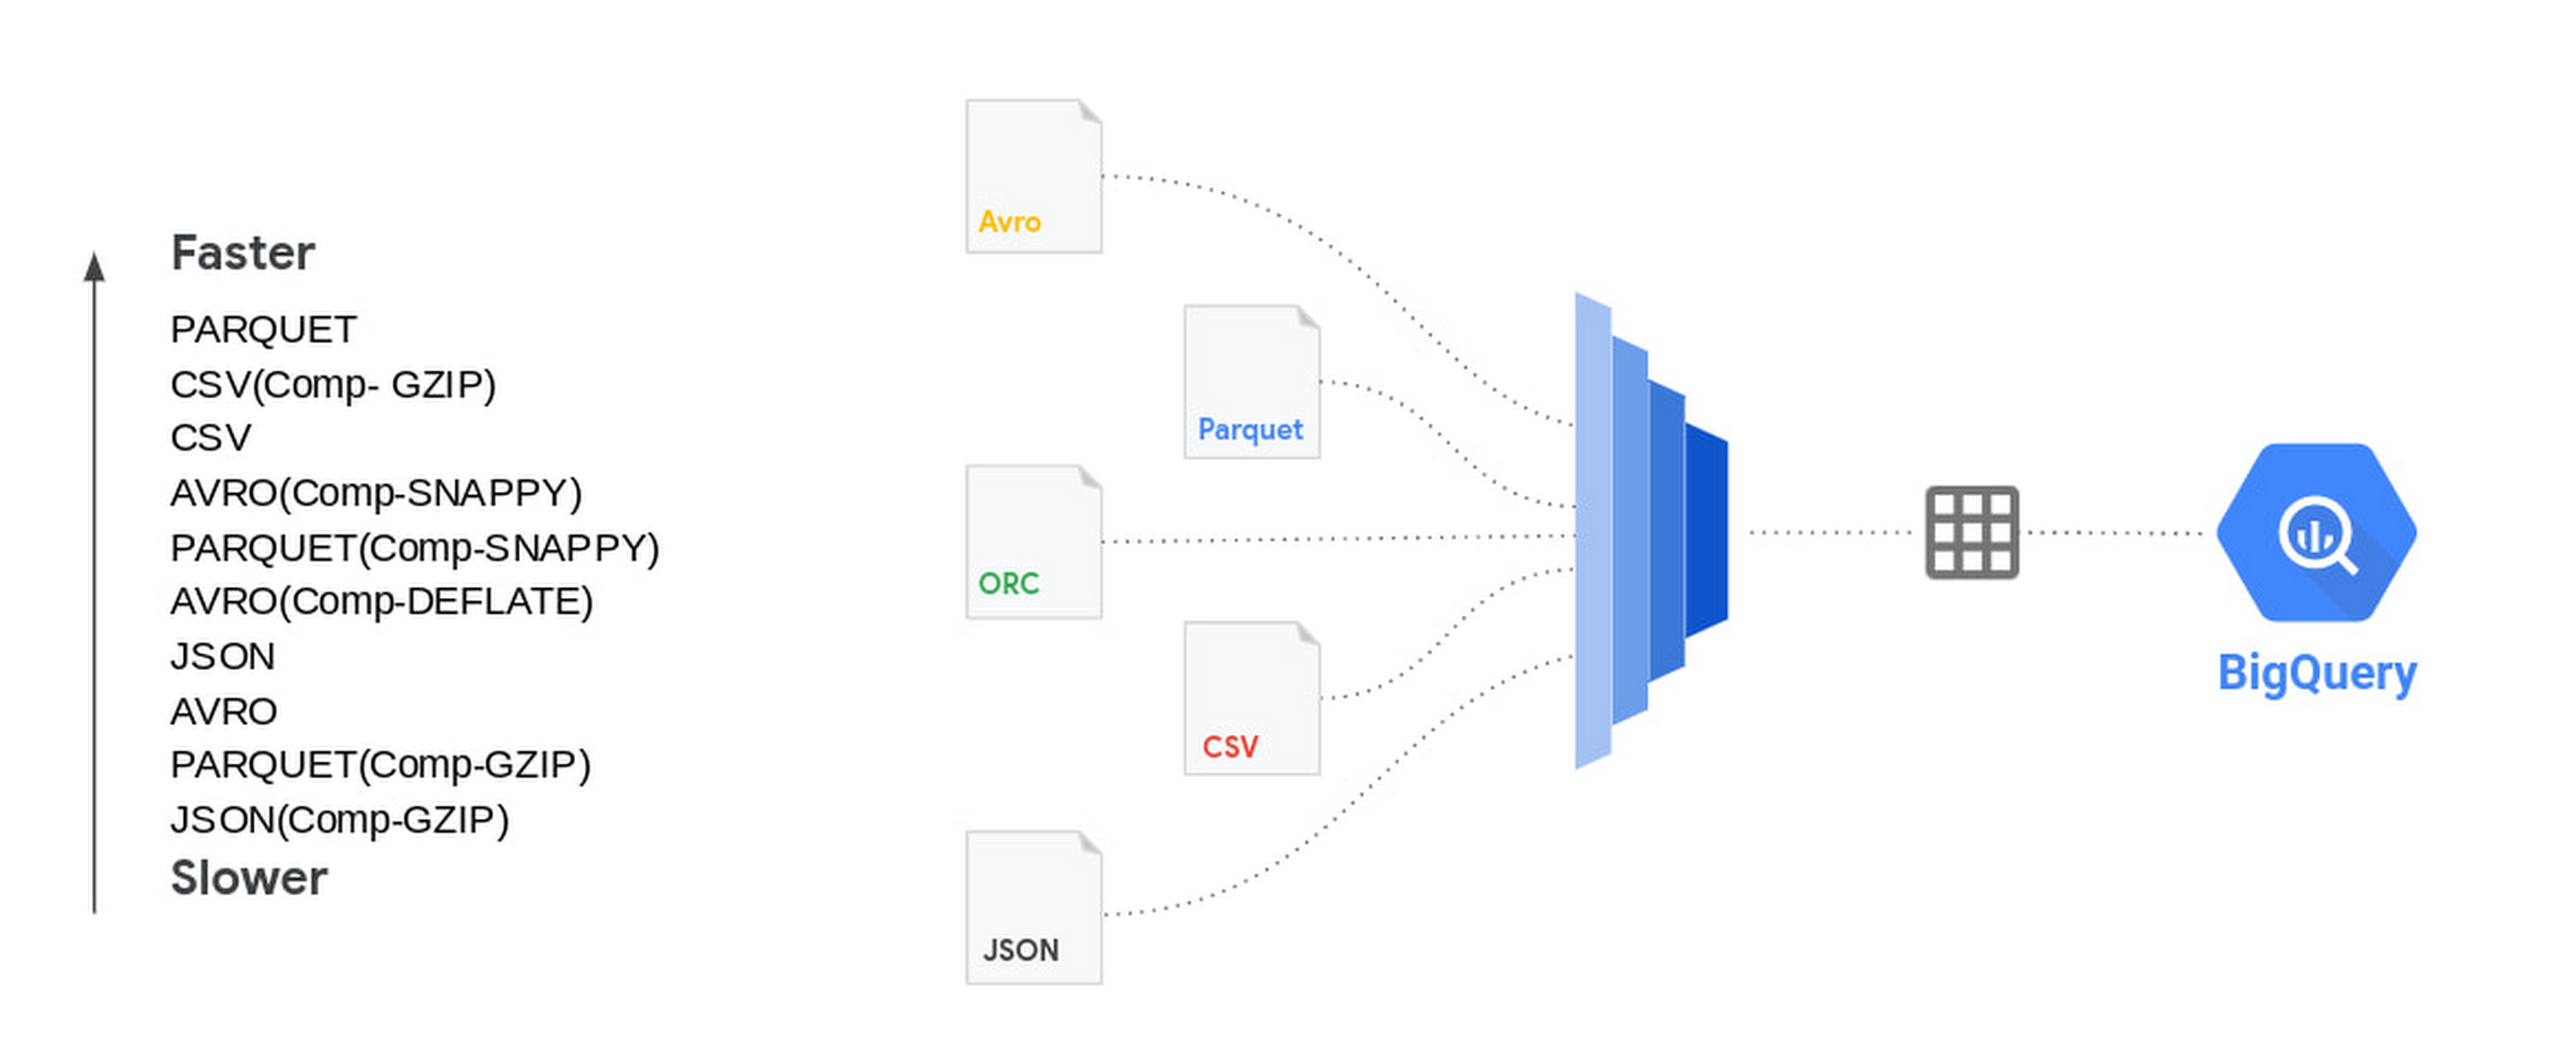
From a data loading perspective we did various tests with millions to hundreds of billions of rows with narrow to wide column data .We have done this test with a public dataset named `bigquery-public-data:worldpop.population_grid_1km`. We used 4000 flex slots for the test and the number of loading slots is limited to the number of slots you have allocated for your environment, though the load slots do not use all of the slots you throw at it.. Schema Autodetection was set to ‘NO’. For the parallelization of the data files each file should typically be less than 256MB for faster throughput and here is a summary of our findings:
Do I compress the data?
Sometimes batch files are compressed for faster network transfers to the cloud. Especially for large data files that are being transferred, it is faster to compress the data before sending over the cloud Interconnect or VPN connection. In such cases is it better to uncompress the data before loading into BigQuery? Here are the tests we did for various file types with different compression algorithms.Shown results are the average of five runs:
How do I load the data?
There are various ways to load the data into BigQuery. You can use the Google Cloud Console, command line, Client Library(shown python here) or use the Direct API call. We compared these data loading techniques and compared the efficacy of each method. Here is a comparison of the timings for each method. You can also see that Schema Autodetect works very well, where there are no datatype quality issues in the source data and you are consistently getting the same columns from a data source
Conclusion
There is no advantage in loading time when the source file is in compressed format. In fact for the most part uncompressed data loads in the same or faster time than compressed data. We noticed that for csv and avro file types you do not need to uncompress for faster load times. For other file types including parquet and json it takes longer to load the data when the file is compressed. Decompression is a CPU bound activity and your mileage varies based on the amount of load slots assigned to your load job. Data loading slots are different from the data querying slots. For compressed files, you should parallelize the load operation, so as to make sure that data loads are efficient. Split the data files to 256MB or less to avoid spilling over the uncompression task to disk.
From a performance perspective avro, csv and parquet files have similar load times. Use the command line to load larger volumes of data for the most efficient data loading. Fixing your schema does load the data faster than schema autodetect set to ‘ON’. Regarding ETL jobs, it is faster and simpler to do your transformation inside BigQuery using SQL, but if you have complex transformation needs that cannot be done with SQL, use Dataflow for unified batch and streaming, Dataproc for open source based pipelines, or Cloud Data Fusion for no-code / low-code transformation needs.
To learn more about how Google BigQuery can help your enterprise, try out Quickstarts page here.
Disclaimer: These tests were done with limited resources for BigQuery in a test environment during different times of the day with noisy neighbors, so the actual timings and the number of rows might not be reflective of your test results. The numbers provided here are for comparison sake only, so that you can choose the right file types, compression and loading technique for your workload.


