Building the most open data cloud ecosystem: Unifying data across multiple sources and platforms

Building the most open data cloud ecosystem: Unifying data across multiple sources and platforms

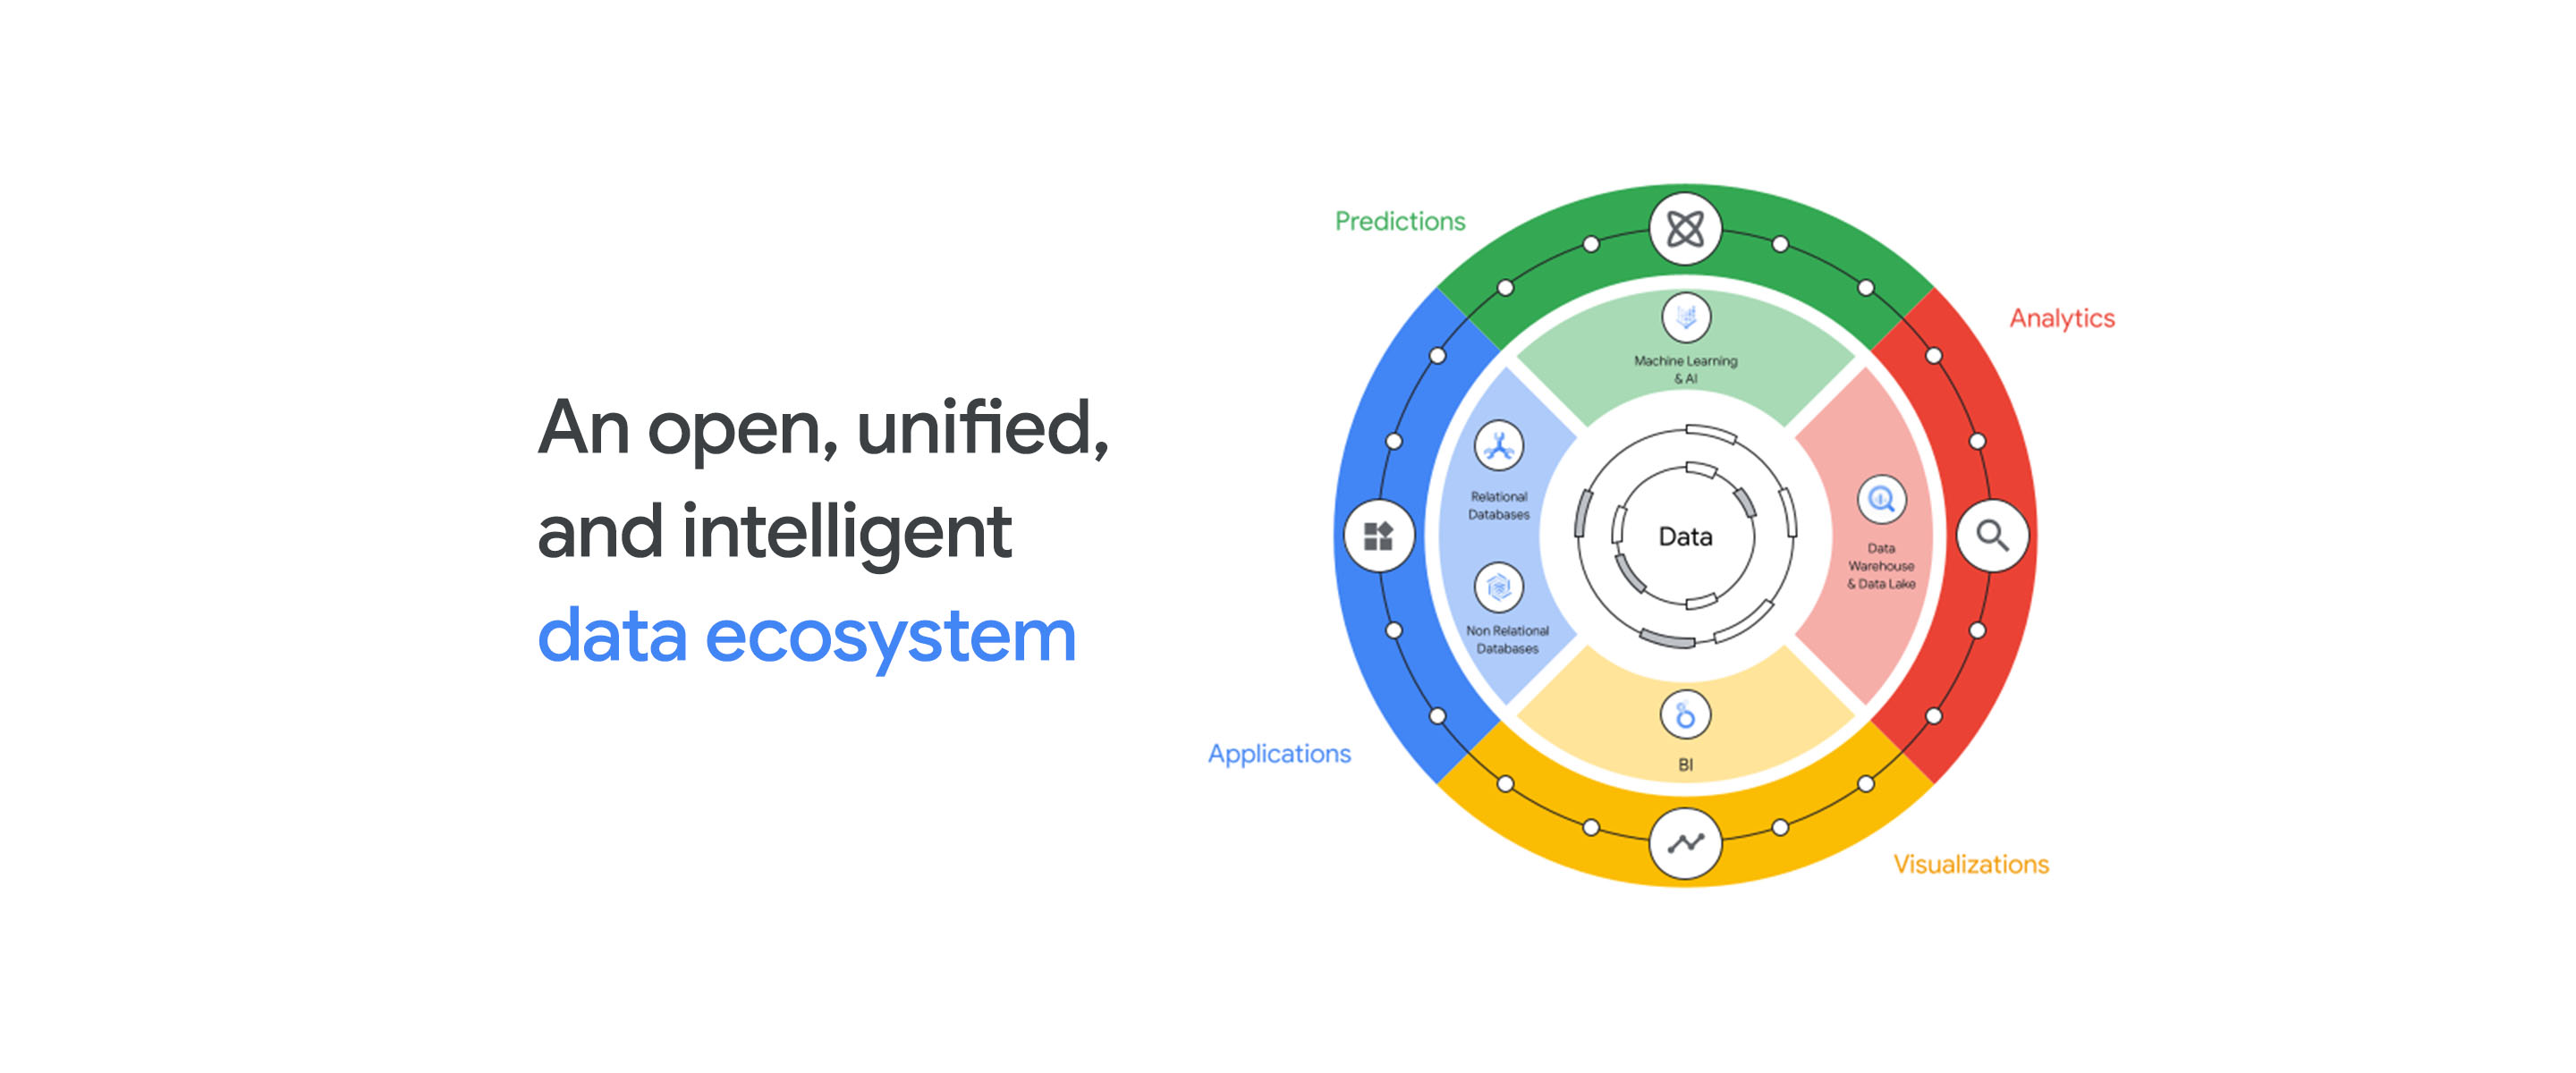
Data is the most valuable asset in any digital transformation. Yet limits on data are still too common, and prevent organizations from taking important steps forward — like launching a new digital business, understanding changes in consumer behavior, or even utilizing data to combat public health crises. Data complexity is at an all time high and as data volumes grow, data is becoming distributed across clouds, used in more workloads and accessed by more people than ever before. Only an open data cloud ecosystem can unlock the full potential of data and remove the barriers to digital transformation.

Already, more than 800 software companies are building their products using Google’s Data Cloud, and more than 40 data platform partners offer validated integrations through our Google Cloud Ready – BigQuery initiative. Earlier this year we launched the Data Cloud Alliance, now supported by 17 leaders in data working together to promote open standards and interoperability between popular data applications.

This week at Next, we’re announcing significant steps to our mission to provide the most open and extensible Data Cloud — that helps ensure customers can utilize all their data, from all sources, in all storage formats and styles of analysis, across all cloud providers and platforms of their choice. These include:

Launching a new capability to analyze unstructured and streaming data in BigQuery.

Adding support for major data formats in the industry, including Apache Iceberg, and the upcoming support for Linux Foundation Delta Lake, Apache Hudi.

A new integrated experience in BigQuery for Apache Spark.

Expanding the capabilities of Dataplex for automated data quality and data lineage to help ensure customers have greater confidence in their data.

Unifying our business intelligence portfolio under the Looker umbrella to begin creating a deep integration of Looker, Data Studio, and core Google technologies like AI and machine learning (ML). 

Launching Vertex AI Vision, a new service that can make powerful computer vision and image recognition AI more accessible to data practitioners.

Expanding our integrations with many of the most popular enterprise data platforms, including Collibra, Elastic, MongoDB, Palantir Foundry, and ServiceNow to help remove barriers between data and give customers more choice and prevent data lock-in.

You can read more about each of these exciting updates below.

Unifying data, across source systems, with major formats

We believe that a data cloud should allow people to work with all kinds of data, no matter its storage format or location. To do this, we’re adding several exciting new capabilities to Google’s Data Cloud.

First, we’re adding support for unstructured data in BigQuery to help significantly expand the ability for people to work with all types of data. Most commonly, data teams have worked with structured data, using BigQuery to analyze data from operational databases and SaaS applications like Adobe, SAP, ServiceNow, and Workday as well as semi-structured data such as JSON log files. 

But this represents a small portion of an organization’s information. Unstructured data may account for up to 90 percent of all data today, like video from television archives, audio from call centers and radio, and documents of many formats. Beginning now, data teams can manage, secure, and analyze structured and unstructured data in BigQuery, with easy access to many of Google Cloud’s capabilities in ML, speech recognition, computer vision, translation, and text processing, using BigQuery’s familiar SQL interface.

Second, we’re adding support for major data formats in use today.Our storage engine, BigLake, adds support for Apache Iceberg and support for Linux Foundation Delta Lake, and Apache Hudi will be added soon. By supporting these widely adopted data formats, we can help organizations gain the full value from their data faster.

“Google Cloud’s support for Delta is a testament to the demand for an open, multicloud lakehouse that gives customers the flexibility to leverage all of their data, regardless of where it resides,” said David Meyer, senior vice president of products at Databricks. “This partnership further exemplifies our joint commitment to open data sharing and the advancement of open standards like Delta Lake that make data more accessible, portable, and collaborative across teams and organizations.”

Third, we’re announcing a new integrated experience in BigQuery for Apache Spark, a leading open-source analytics engine for large-scale data processing. This new Spark integration, launching in preview today, allows data practitioners to create procedures in BigQuery, using Apache Spark, that integrate with their SQL pipelines. Organizations like Walmart use Google Cloud to improve Spark processing times by 23% and have reduced time to close financial books from five days to three. 

In addition, we’ve launched Datastream for BigQuery which will help organizations more effectively replicate data in real-time, from sources including AlloyDB, PostgreSQL, MySQL and third-party databases like Oracle — directly into BigQuery. By helping to accelerate the ability to bring data from an array of sources into BigQuery, we enable you to get more insights from your data in real time. To learn more about these announcements read our dedicated post about key innovations with Google Databases

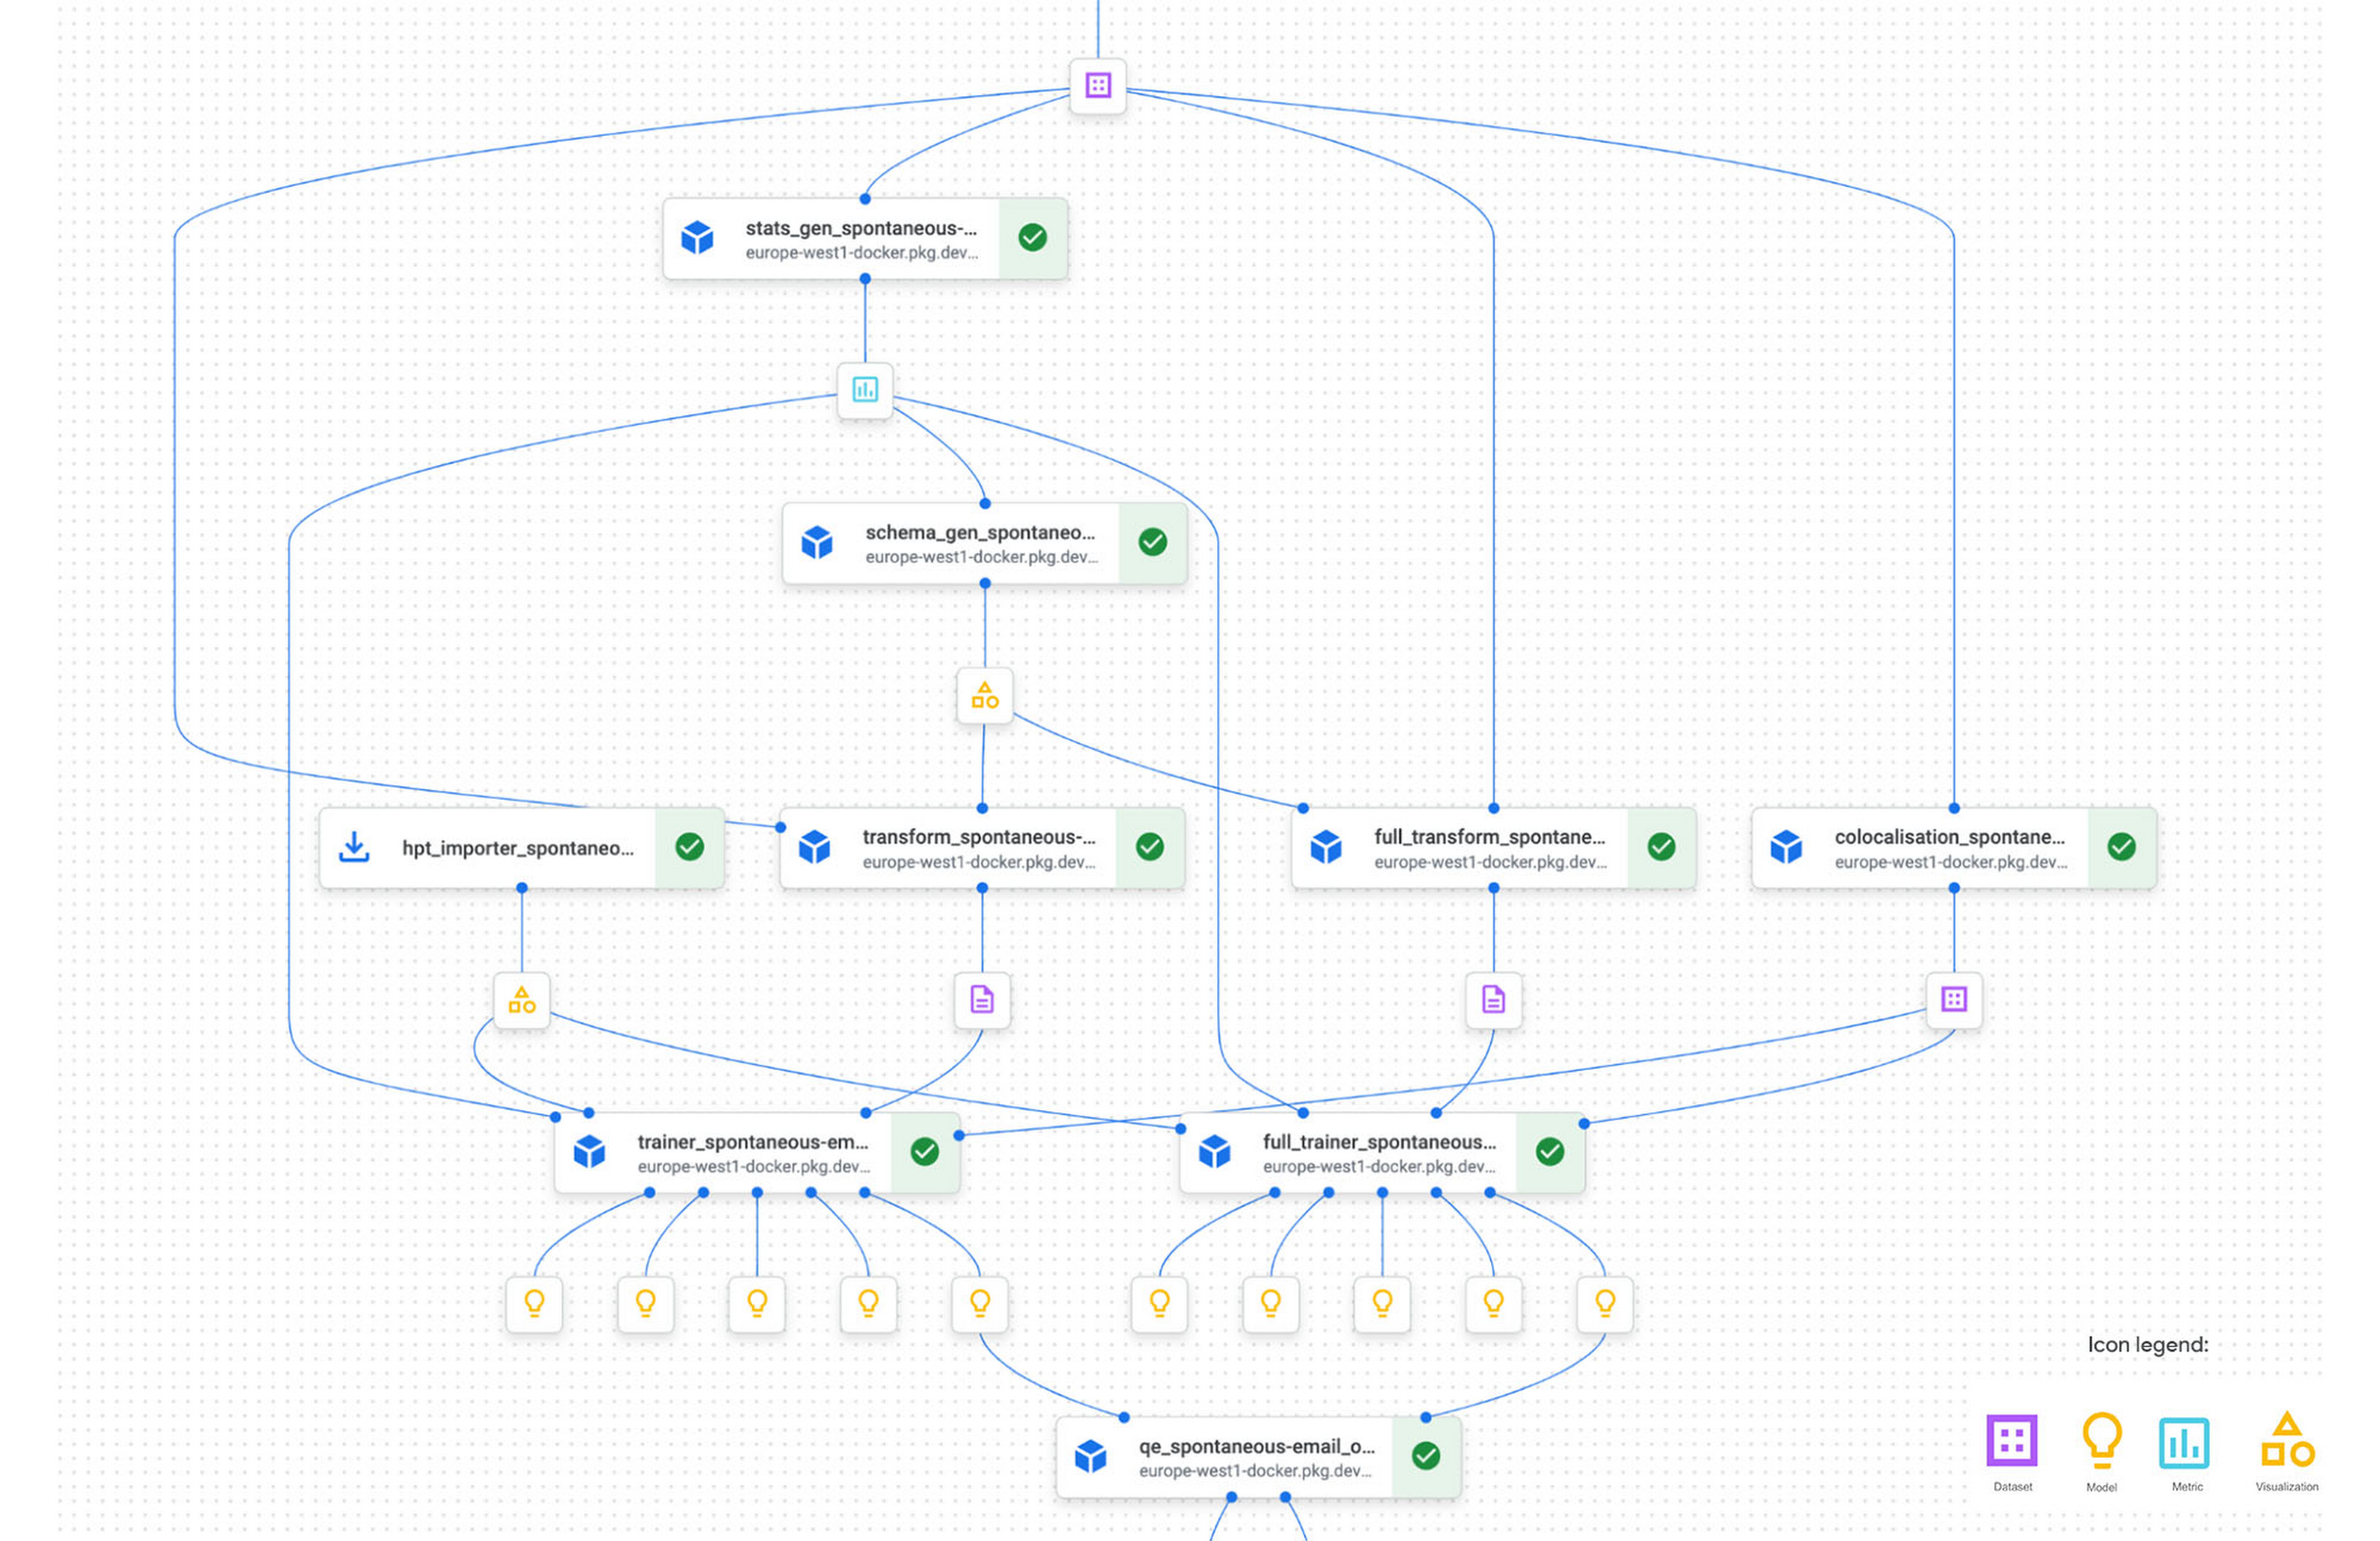
Finally, a data cloud should enable organizations to manage, secure, and observe their data, which helps ensure their data is high quality and enable strong, flexible data management, and governance capabilities. To address data management, we’re announcing updates to Dataplex that will automate common processes associated with data quality. For instance, users will now be able to easily understand data lineage — where data originates and how it has transformed and moved over time — which can reduce the need for manual, time consuming processes.

The ability to let our customers work with all kinds of data, in the formats they choose, is the hallmark of an open data cloud. We’re committed to delivering the support and integrations that customers need to remove limits from their data and avoid data lock-in across clouds.

Supporting all styles of analysis and empowering analysts with AI

More than 10 million users access Google Cloud’s business intelligence solutions each month, including Looker and Google Data Studio. Now, we’re unifying these two popular tools under the Looker umbrella to start creating a deep integration of Looker, Data Studio, and core Google technologies like AI and ML. As part of that unification, Data Studio is now Looker Studio. This solution will help you go beyond dashboards and infuse your workflows and applications with the intelligence needed to help make data-driven decisions. To learn more about the next evolution of Looker and business intelligence, please read our dedicated post on Looker’s future.

We’re committed to enabling our customers to work with the business intelligence tools of their choice. We’ve already announced integrations between Looker and Tableau, and today we’re announcing enhancements for Looker and BigQuery with Microsoft Power BI — another significant step forward in providing customers with the most open data cloud. This means that Tableau and Microsoft customers can easily analyze trusted data from Looker and simply connect with BigQuery.

Increasingly, AI and ML are becoming important tools for modeling and managing data – particularly as organizations find ways to put these capabilities in the hands of users. Already, Vertex AI helps you get value from data more quickly by simplifying data access and ingestion, enabling model orchestration, and deploying ML models into production. 

We are now releasing Vertex AI Vision to extend the capabilities of Vertex AI to be more accessible to data practitioners and developers. This new end-to-end application development environment helps you ingest, analyze, and store visual data: streaming video in manufacturing plants, for example, to help ensure safety, or streams from store shelves to improve inventory analysis, or following traffic lights for management of busy intersections. Vertex AI Vision allows you to easily build and deploy computer vision applications to understand and utilize this data.

Vertex AI Vision can reduce the time to create computer vision applications from weeks to hours at one-tenth the cost of current offerings. To help you achieve these efficiencies, Vertex AI Vision provides an easy-to-use, drag-and-drop interface and a library of pre-trained ML models for common tasks such as occupancy counting, product recognition, and object detection. It also provides the option to import your existing AutoML or custom ML models, from Vertex AI, into your Vertex AI Vision applications. As always,  our new AI products also adhere to our AI Principles

Plainsight, a leading provider of computer vision solutions, is using Google Cloud to increase speed and cost efficiency. “Vertex AI Vision is changing the game for use cases that for us were previously not viable at scale,” Elizabeth Spears, co-founder and chief product officer at Plainsight, said. “The ability to run computer vision models on streaming video with up to a 100-times cost reduction for Plainsight is creating entirely new business opportunities for our customers.”

Supporting an open data ecosystem

Giving customers flexibility to work across the data platforms of their choice is critical to prevent data lock-in. To keep Google’s data cloud open, we’re committed to partnering with major open data platforms, including companies like Collibra, Databricks, Elastic, Fivetran, MongoDB, Sisu Data, Reltio, Striim, and many others to ensure that help our joint customers can use these products with Google’s data cloud. We’re also working with the 17 members of the Data Cloud Alliance to promote open standards and interoperability in the data industry, and continuing our support for open-source database engines like MongoDB, MySQL, PostgreSQL, and Redis, in addition to Google Cloud databases like AlloyDB for PostgreSQL, Cloud Bigtable, Firestore, and Cloud Spanner. 

At Next, we’re announcing important new updates and integrations with several of these partners, to help you more easily move data between the platforms of your choice and bring more of Google’s data cloud capabilities to partner platforms.

Collibra will integrate with Dataplex to help customers more easily discover data in business context, understand data lineage, and apply consistent controls on data stored across major clouds and on-premises environments.

Elasticis bringing its Elasticsearch capabilities to Google’s data cloud, giving customers the ability to federate their search queries to their data lakes on Google Cloud. This expands upon the existing integration already available to directly ingest data from BigQuery into Elastic for search use cases. We’re also extending Looker support to the Elastic platform, which can easily embed search insights into data-driven applications. 

MongoDB is launching new templates to significantly help accelerate customers’ ability to move data between Atlas and BigQuery. This will also open up new use cases for customers to apply Google Cloud AI and ML capabilities to MongoDB using Vertex AI. 

Palantir is certifying BigQuery as an engine for Foundry Ontology which connects underlying data models to business objects, predictive models, and actions which can enable customers to turn data into intelligent operations.

ServiceNow plans to work with mutual customers and build use case specific integrations with BigQuery to help customers aggregate diverse, external data with data residing in their ServiceNow instance. The integration will help customers create greater insights and value from data residing in the ServiceNow instance, like IT service management data, customer service records, or order management data and move data to BigQuery where the customers can use Google’s analytics capabilities to process and analyze data from these multiple sources. 

Sisu Data will collaborate with Google Cloud’s business intelligence solutions to help automate finding root causes 80% faster than traditional approaches to provide augmented analytics for more customers.

Reltio’s integration with BigQuery can improve the customer experience by consolidating, cleansing, and enriching data in real-time with master data management capabilities, and then enable intelligent action with Vertex AI.

Striim’s managed service for BigQuery can reduce time to insight, allowing customers to replicate data from a variety of operational sources with automatic schema creation, coordinated initial load, and built-in parallel processing for sub-second latency. With faster insights can come faster decision-making across the organization.

Watchthe Google Cloud Next ‘22 broadcast or dive into our on-demand sessionsand learn more about how you can use these latest innovations to turn data into value.

Related Article

Read Article

Source : Data Analytics Read More

New AI Agents can drive business results faster: Translation Hub, Document AI, and Contact Center AI

New AI Agents can drive business results faster: Translation Hub, Document AI, and Contact Center AI

When it comes to the adoption of artificial intelligence (AI), we have reached a tipping point. Technologies that were once accessible to only a few are now broadly available. This has led to an explosion in AI investment. However, according to research firm McKinsey, for AI to make a sizable contribution to a company’s bottom line, they “must scale the technology across the organization, infusing it in core business processes” — and based on conversations with our customers, we couldn’t agree more.  

While investments in pure data science continue to be essential for many, widespread adoption of AI increasingly involves a category of applications and services that we call AI Agents. These are technologies that let customers apply the best of AI to common business challenges, with limited technical expertise required by employees, and include Google Cloud products like Document AI and Contact Center AI. Today, at Google Cloud Next ‘22, we’re announcing new features to our existing AI Agents and a brand new one with Translation Hub.  

“AI is becoming a key investment for many companies’ long term success. However, most companies are still in the experimental phases with AI and haven’t fully put the technology into production because of long deployment timelines, IT staffing needs, and more,” said Ritu Jyoti, group vice president, worldwide AI and automation research practice global AI research lead, at IDC. “Organizations need AI products that can be immediately applied to automate processes and solve business problems. Google Cloud is answering this problem by providing fully managed, scalable AI Agents that can be deployed fast and deliver immediate results.”

Translation Hub: An enterprise-scale translation AI Agent 

At I/O this year, we announced the addition of 24 new languages to Google Translate to allow consumers in more locations, especially those whose languages aren’t represented in most technology, to help reduce communication barriers through the power of translation. Businesses strive for the same goals, but unfortunately it is often out of reach due to the high costs that come with scaling translation. 

That’s why today, we are announcing Translation Hub, our AI Agent that provides customers with self-service document translation. With 135 languages, Translation Hub can create impactful, inclusive, and cost-effective global communications in a few clicks.

With Translation Hub, now researchers are able to share their findings instantly across the world, goods and services providers can reach underserved markets, and public sector administrators can reach more members of their communities in a language they understand — all of which ultimately help make for a more connected, inclusive world.

Translation Hub brings together Google Cloud AI technology, like Neural Machine Translation and AutoML, to help make it easy to ingest and translate content from the most common enterprise document types, including Google Docs and Slides, PDFs, and Microsoft Word. It not only preserves layouts and formatting, but also provides granular management controls such as support for post-editing human-in-the-loop feedback and document review. 

“In just three months of using Translation Hub and AutoML translation models, we saw our translated page count go up by 700% and translation cost reduced by 90%,” said Murali Nathan, digital innovation and employee experience lead, at materials science company Avery Dennison. “Beyond numbers, Google’s enterprise translation technology is driving a feeling of inclusion among our employees. Every Avery Dennison employee has access to on-demand, general purpose, and company-specific translations. English language fluency is no longer a barrier, and our employees are beginning to broadly express themselves right in their native language.” 

Document AI: A document processing AI Agent to automate workflows 

Every organization needs to process documents, understand their content, and make them available to the appropriate people. Whether it’s during procurement cycles involving invoices and receipts, contract processes to close deals, or for general increases in efficiency, Document AI simplifies and automates various document processing. With two new features launching today, Document AI can allow employees to focus on higher impact tasks and better serve their own customers. 

For example, payments provider Libeo used Document AI to uptrain an invoice parser with 1,600 documents and increase its testing accuracy from 75.6% to 83.9%. “Thanks to uptraining, the Document AI results now beat the results of a competitor and will help Libeo save ~20% on the overall cost for model training over the long run,” said Libeo chief technology officer, Pierre-Antoine Glandier.

Today, we’re announcing these new features to our existing Document AI Agent: 

Document AI Workbench can remove the barriers around building custom document parsers, helping organizations extract fields of interest that are specific to their business needs. Relative to more traditional development approaches, it requires less training data and offers a simple interface for both labeling data and one-click model training. 

Document AI Warehouse can eliminate the challenges that many enterprises face when tagging and extracting data in documents by bringing Google’s Search technologies to Document AI. This feature can make it simpler and easier to search for and manage documents like workflow controls to accommodate invoice processing, contracts, approvals, and custom workflows.

Contact Center AI: A contact center AI Agent to improve customer experiences

Scaling call center support can be expensive and difficult, especially when implementing AI technologies to support representatives. Contact Center AI is an AI Agent for virtually all contact center needs, from intelligently routing customers, to facilitating handoffs between virtual and human customer support representatives, to analyzing call center transcripts for trends and much more. 

Just days ago, we announced that Contact Center AI Platform is now generally available to provide additional deployment choice and flexibility. With this addition to Contact Center AI, we are furthering our commitment to providing an AI Agent that can assist organizations to quickly scale their contact centers to improve customer experiences and create value via data-driven decisions. 

Dean Kontul, division chief information officer at KeyBank, had this to say about powering their contact center with Contact Center AI from Google Cloud: “With Google Cloud and Contact Center AI, we will quickly move our contact center to the Cloud, supporting both our customers and agents with industry-leading customer experience innovations, all while streamlining operations through more efficient customer care operations.”

Start delivering business results with AI Agents, today!  

If you’re ready to get started with Translation Hub, this Next ‘22 session has the details, including a deeper dive into Avery Dennison’s use of the AI Agent. 

To learn more about our Document AI announcements, check out our session with Commerzbank, “Improve document efficiency with AI,” as well as “Transform digital experiences with Google AI powered search and recommendations.” 

And, to explore Contact Center AI Platform, watch “Delight customers in every interaction with Contact Center AI,” featuring more insight into KeyBank’s use case.

Related Article

Cloud Wisdom Weekly: 4 ways AI/ML boosts innovation and reduces costs

Whether ML models into production or injecting AI into operations, tech companies and startups want to do more with AI— and these tips ca…

Read Article

Source : Data Analytics Read More

Google Cloud Next for data professionals: analytics, databases and business intelligence

Google Cloud Next for data professionals: analytics, databases and business intelligence

Google Cloud Next kicks off tomorrow, and we’ve prepared a wealth of content — keynotes, customer panels, technical breakout sessions — designed for data professionals. If you haven’t already, now is the perfect time to register, and build out your schedule. Here’s a sampling of data-focused breakout sessions:

1. ANA204What’s next for data analysts and data scientists

Join this session to learn how Google’s Data Cloud can transform your decision making and turn data into action by operationalizing Data Analytics and AI. Google Cloud brings together Google’s most advanced Data and AI technology to help you train, deploy, and manage ML faster at scale. You will learn about the latest product innovations for BigQuery and Vertex AI to bring intelligence everywhere to analyze and activate your data. You will also hear from industry leading organizations who have realized tangible value with data analytics and AI using Google Cloud.

2. DSN100What’s next for data engineers

Organizations are facing increased pressure to deliver new, transformative user experiences in an always-on, global economy. Learn how Google’s data cloud unifies your data across analytical and transactional systems for increased agility and simplicity. You’ll also hear about the latest product innovations across Spanner, AlloyDB, Cloud SQL and BigQuery.

3. ANA101What’s new in BigQuery

In the new digital-first era, data analytics continues to be at the core of driving differentiation and innovation for businesses. In this session, you’ll learn how BigQuery is fueling transformations and helping organizations build data ecosystems. You’ll hear about the latest product announcements, upcoming innovations, and strategic roadmap.

4. ANA100What’s new in Looker and Data Studio

Business intelligence (BI) is more than dashboards and reports, and we make it easy to deliver insights to your users and customers in the places where it’ll make the most difference. In this session, we’ll discuss the future of our BI products, as well as go through recent launches and the roadmap for Looker and Google Data Studio. Hear how you can use both products — today and in the future — to get insights from your data, including self-service visualization, modeling of data, and embedded analytics.

5. ANA102So long, silos: How to simplify data analytics across cloud environments

Data often ends up in distributed environments like on-premises data centers and cloud service providers, making it incredibly difficult to get 360-degree business insights. In this session, we’ll share how organizations can get a complete view of their data across environments through a single pane of glass without building huge data pipelines. You’ll learn directly from Accenture and L’Oréal about their cross-cloud analytics journeys and how they overcame challenges like data silos and duplication.

6. ANA104How Boeing overcame their on-premises implementation challenges with data & AI

Learn how leading aerospace company Boeing transformed its data operations by migrating hundreds of applications across multiple business groups and aerospace products to Google Cloud. This session will explore the use of data analytics, AI, and machine learning to design a data operating system that addresses the complexity and challenges of traditional on-premises implementations to take advantage of the scalability and flexibility of the cloud.

7. ANA106How leading organizations are making open source their super power

Open source is no longer a separate corner of the data infrastructure. Instead, it needs to be integrated into the rest of your data platform. Join this session to learn how Walmart uses data to drive innovation and has built one of the largest hybrid clouds in the world, leveraging the best of cloud-native and open source technologies. Hear from Anil Madan, Corporate Vice President of Data Platform at Walmart, about the key principles behind their platform architecture and his advice to others looking to undertake a similar journey.

Build your data playlist today

One of the coolest things about the Next ‘22 website is the ability to create your own playlist, and share it with people. To explore the full catalog of breakout sessions and labs designed for data scientists and engineers, check out the Analyze and Design tracks in the Next ‘22 Catalog.

Related Article

Read Article

Source : Data Analytics Read More

Google Cloud Next: top AI and ML sessions

Google Cloud Next: top AI and ML sessions

Google Cloud Next starts this week, and features over a dozen sessions dedicated to helping organizations innovate with machine learning (ML) and inject artificial intelligence (AI) into their workflows. Whether you’re a data scientist looking for cutting-edge ML tools, a developer aiming to more easily build AI-powered apps, or a non-technical worker who wants to leverage AI for greater productivity, here are some can’t miss AI and ML sessions to add to your playlist

Developing ML models faster and turning data into action 

For data scientists and ML experts, we’re offering a variety of sessions to help accelerate the training and deployment of models to production, as well to bridge the gap between data and AI. Top sessions include: 

ANA204: What’s next for data analysts and data scientists

Join this session to learn how Google Cloud can help your organization turn data into action, including overviews of the latest announcements and best practices for BigQuery and Vertex AI.

ANA207: Move from raw data to ML faster with BigQuery and Vertex AI

What does the end-to-end journey from raw data to AI look like on Google Cloud? In this session, learn how Vertex AI can help you decrease time to production, track data lineage, catalog ML models for production, support governance, and more — including step-by-step instructions for integrating your data warehouse, modeling, and MLOps with BigQuery and Vertex AI.

ANA103: How to accelerate machine learning development with BigQuery ML 

Google Cloud’s BigQuery ML accelerates the data-to-AI journey by letting practitioners build and execute ML models using standard SQL queries. Join this session to learn about the latest BigQuery ML innovations and how to apply them. 

Building AI-powered apps 

Developers building AI into their apps will also find lots to love, including the following: 

ANA206: Maximize content relevance and personalization at scale with large language models

Accurately classifying content at scale across domains and languages ranks among the most challenging natural language problems. Featuring Erik Bursch, Senior Vice President of Digital Consumer Product and Engineering at Gannett, this session explores how Google Cloud can help identify content for ad targeting, taxonomize product listings, serve the most relevant content, and generate actionable insights.

BLD104:Power new voice enabled interfaces and applications with Google Cloud’s speech solutions

Featuring Ryan Wheeler, Vice President of Machine Learning at Toyota Connected North American, this session dives into the ways organizations use Google’s automatic speech recognition (ASR) and speech synthesis products to unlock new use cases and interfaces.

Applying AI to core business processes

Employees without technical expertise are innovating with AI and ML as well, infusing it into business processes so they can get more done. To learn more, be sure to check out these sessions:

ANA109:Increase the speed and inclusivity of global communications with Google’s zero code translation tools

An estimated 500 billion words are translated daily but most translation processes for enterprises are manual, time-consuming, and expensive. Join this session — featuring Murali Nathan, Senior Director, Digital Experience and Transformation at Avery Dennison — to find out how Google Cloud’s AI-powered translation services are addressing these challenges, helping businesses to drive more inclusive consumer experiences, save millions of dollars, and localize messages across the world in minutes.

ANA111: Improve document efficiency with AI: Make document workflows faster, simpler, and pain free with AI

Google’s Document AI family of solutions help organizations capture data at scale by extracting structured data from unstructured documents, reducing processing costs and improving business speed and efficiency. Featuring Andreas Vollmer, Managing Director, Head of Document Lifecycle at Commerzbank, this session investigates how Google is expanding the capabilities of our Document AI suite to solve document workflow challenges. 

ANA108:Delight customers in every interaction with Contact Center AI

Google Cloud Contact Center AI brings the power of AI to large contact centers, helping them to deliver world-class customer experiences while reducing costs. Join this session — featuring Stephen Chauvin, Business Technology Executive, Voice & Chat Automation/Contact Center Delivery at KeyBank — to learn about the newest Contact Center AI capabilities and how they can help your business. 

Register for Next ‘22.

Related Article

Read Article

Source : Data Analytics Read More

Built with BigQuery: How Tinyclues and Google Cloud deliver the CDP capabilities that marketers need

Built with BigQuery: How Tinyclues and Google Cloud deliver the CDP capabilities that marketers need

Editor’s note: The post is part of a series highlighting our awesome partners, and their solutions, that are Built with BigQuery.

What are Customer Data Platforms (CDPs) and why do we need them?

Today, customers utilize a wide array of devices when interacting with a brand. As an example, think about the last time you bought a shirt. You may start with a search on your phone as you take the subway to work. During that 20 minute ride, you narrow down the type of shirt . Later, as you take your lunch break, you spend a few more minutes refining your search on your work laptop and you are able to find two shirt models of interest. Pressed for time, you add both to your shopping cart at an online retailer to review at a later point. Finally, after you arrive back home and as you are checking your physical mail, you stumble across a sales advertisement for the type of shirt that you are looking for, available at your local brick and mortar store. The next day you visit that store during your lunch break and purchase the shirt. 

Many marketers face the challenge of creating a consistent 360 customer view that captures the customer lifecycle, as illustrated in the example above – including their online/offline journey, interacting with multiple data points across multiple data sources.

The evolution of managing customer data reached a turning point in the late 90’s with CRM software that sought to match current and potential customers with their interactions. Later as a backbone of data-driven marketing, Data Management Platforms (DMPs) expanded the reach of data management to include second and third party datasets including anonymous IDs. A Customer Data Platform combines these two types of systems, creating a unified, persistent customer view across channels (mobile, web etc) that provide data visibility and granularity at individual level.

A new approach to empowering marketing heroes

Tinyclues is a company that specializes in empowering marketers to drive sustainable engagement from their customers and generate additional revenue, without damaging customer equity. The company was founded in 2010 on a simple hunch: B2C marketing databases contain sufficient amounts of implicit information (data unrelated to explicit actions) to transform the way marketers interact with customers, and a new class of algorithms based on Deep Learning (sophisticated machine learning that mimics the way humans learn) holds the power to unlock this data’s potential. Where other players in the space have historically relied – and continue to rely – on a handful of explicit past behaviors and more than a handful of assumptions, Tinyclues’ predictive engine uses all of the customer data that marketers have available in order to formulate deeply precise models, down even to the SKU level. Tinyclues’ algorithms are designed to detect changes in consumption patterns in real-time, and adapt predictions accordingly.

This technology allows marketers to find precisely the right audiences for any offer during any timeframe, increasing engagement with those offers and, ultimately, revenue; additionally, marketers are able to increase campaign volume while decreasing customer fatigue and opt-outs, knowing that audiences are receiving only the most relevant messages. Tinyclues’ technology also reduces time spent building and planning campaigns by upwards of 80%, as valuable internal resources can be diverted away from manual audience-building.

Google Cloud’s Data Platform, spearheaded by BigQuery, provides a serverless, highly scalable, and cost-effective foundation to build this next generation of CDPs. 

Tinyclues Architecture:

To enable this scalable solution for clients, Tinyclues receives purchase and interaction logs from clients in addition to product and user tables. In most cases, this data is already in the client’s BigQuery instance, in which case they can be easily shared with Tinyclues utilizing BigQuery authorized views

In cases where the data is not in BigQuery, flat files are sent to Tinyclues via GCS and are ingested in the client’s data set via a lightweight Cloud Function. The orchestration of all pipelines is implemented via Cloud Composer (Google’s managed Airflow). The transformation of data is accomplished by utilizing simple select statements in the Data Built Tool (DBT), which is wrapped inside an airflow DAG that powers all data normalization and transformations. There are several other DAGs to fulfill more functionalities, including: 

Indexing the product catalog on Elastic Cloud (Elasticsearch managed service) on GCP to provide auto-complete search capabilities to TCs clients as shown below:

The export of Tinyclues-powered audiences to the clients’ activation channels, whether they are using SFMC, Braze, Adobe, GMP, or Meta.

Tinyclues AI/ML Pipeline powered by Google Vertex AI

TCs ML Training pipelines are used to train models that calculate propensity scores. They are composed using Airflow DAGs, powered by Tensorflow & Vertex AI Pipelines. BigQuery is used natively, without data movement, to perform as much feature engineering as possible in-place. 

TC uses the TFX library to run ML Pipelines in Vertex AI. Building on top of Tensorflow as their main deep learning framework of choice due to its maturity, open source platform, scalability and support for complex data structures (Ragged and Spare Tensors). 

Below is a partial example of TC’s Vertex AI Pipeline graph, illustrating the workflow steps in the training pipeline. This pipeline allows for the modularization & standardization of functionality into easily manageable building blocks. These blocks are composed of TFX components (TC reuses most of the standard components in addition to customizing some such as a proprietary implementation of the Evaluator to compute both ML Metrics (which is part of the standard implementation) but also more Business Metrics like Overlap of clickers etc. The individual components/steps are chained with DSL to form a pipeline that is modular and easily orchestrated or updated as needed.

With the trained Tensorflow models available in GCS, TCs exposes these in BigQuery ML (BQML) to enable their clients to score millions of users for their propensity to buy X or Y within minutes. This would not be possible without the power of BigQuery and also frees TC from previously experienced scalability issues.

As an illustration, TC has the need to score thousands of topics among millions of users. This used to take north of 20 hours on their previous stack, and now takes less than 20 minutes thanks to the optimization work that TC has implemented in their custom algorithm and the sheer power of BQ to scale to any workload accordingly. 

Data Gravity: Breaking the Paradigm – Bringing the Model to your Data

BQML enables TC to call pre-trained TensorFlow models within an SQL environment, thus avoiding exporting data in and out of BQ using already provisioned BQ serverless processing power. Using BQML removes the layers between the models and the data warehouse and allows them to express the entire inference pipe as a number of SQL requests. TC no longer has to export data to load it into their models. Instead, they are bringing their models to the data.

Avoiding the export of data in and out of BQ and the serverless provisioning and start of machines saves significant time. As an example, exporting an 11M lines campaign for a large client previously took 15 min or more to process. Deployed on BQML it now takes minutes with more than half of the processing time attributed to network transfers to our client system. 

Inference times in BQML compared to TCs legacy stack:

As can be seen, using this approach enabled by BQML, the reduction in the number of steps leads to a 50% decrease in overall inference time, improving upon each step of the prediction.

The Proof is in the pudding

Tinyclues has consistently delivered on its promises of increased autonomy for CRM teams, rapid audience building, superior performance against in-house segmentation, identification of untapped messaging and revenue opportunities, fatigue management, and more, working with partners like Tiffany & Co, Rakuten, and Samsung, among many others.

Conclusion

Google’s data cloud provides a complete platform for building data-driven applications like the headless CDP solution developed by Tinyclues — from simplified data ingestion, processing, and storage to powerful analytics, AI, ML, and data sharing capabilities — all integrated with the open, secure, and sustainable Google Cloud platform. With a diverse partner ecosystem, open-source tools, and APIs, Google Cloud can provide technology companies the portability and differentiators they need to serve the next generation of marketing customers.  

To learn more about Tinyclues on Google Cloud, visit Tinyclues. Click here to learn more about Google Cloud’s Built with BigQuery initiative. 

We thank the many Google Cloud team members who contributed to this ongoing data platform  collaboration and review, especially Dr. Ali Arsanjani in Partner Engineering.

Related Article

Read Article

Source : Data Analytics Read More

Moving to Log Analytics for BigQuery export users

Moving to Log Analytics for BigQuery export users

If you’ve already centralized your log analysis on BigQuery as your single pane of glass for logs & events…congratulations! You’re already benefiting from BigQuery’s:

Petabyte-scale cost-effective analytics,

Analyzing heterogeneous data across multi-cloud & hybrid environments,

Running on fully-managed serverless data warehouse with enterprise security features,

Democratizing analytics for everyone using standard familiar SQL with extensions. 

With the introduction of Log Analytics (Public Preview), something great is now even better. It leverages BigQuery while also reducing your costs and accelerating your time to value with respect to exporting and analyzing your Google Cloud logs in BigQuery.

This post is for users who are (or are considering) migrating from BigQuery log sink to Log Analytics. We’ll highlight the differences between the two, and go over how to easily tweak your existing BigQuery SQL queries to work with Log Analytics. For an introductory overview of Log Analytics and how it fits in Cloud Logging, see our user docs.

Comparison

When it comes to advanced log analytics using the power of BigQuery, Log Analytics offers a simple, cost-effective and easy-to-operate alternative to exporting to BigQuery with Log Router (using log sink) which involves duplicating your log data. Before jumping into examples and patterns to help you convert your BigQuery SQL queries, let’s compare Log Analytics and Log sink to BigQuery.

Log sink to BigQuery

Log Analytics

Operational Overhead

Create and manage additional log sink(s) and BigQuery dataset to export a copy of the log entries

Set up a Google-managed linked BigQuery dataset with one click via Cloud Console

Cost

Pay twice for storage and ingestion since data is duplicated in BigQuery

BigQuery storage and ingestion cost are included in Cloud Logging ingestion costs

Free tier of queries from Log Analytics

Storage

Schema defined at table creation time for every log type

Log format changes can cause schema mismatch errors 

Single unified schema

Log format changes do not cause schema mismatch errors

Analytics

Query logs in SQL from BigQuery

Query logs in SQL in Log Analytics page or from BigQuery page

Easier to query JSON fields with native JSON data type 

Faster search with pre-built search indexes

Security

Manage access to log bucket

Manage access to BigQuery dataset to secure logs and ensure integrity

Manage access to log bucket

Manage only read-only access to linked BigQuery dataset

Comparing Log Analytics with traditional log sink to BigQuery 

Simplified table organization

The first important data change is that all logs in a Log Analytics-upgraded log bucket are available in a single log view _AllLogs with an overarching schema (detailed in next section) that supports all Google Cloud log types or shapes. This is in contrast to traditional BigQuery log sink where each log entry gets mapped to a separate BigQuery table in your dataset based on the log name, as detailed in BigQuery routing schema. Below are some examples:

Table path in SQL FROM clause

The second column in this table assumes your BigQuery log sink is configured to use partitioned tables. If your BigQuery log sink is configured to use date-sharded tables, your queries must also account for the additional suffix (calendar date of log entry) added to table names e.g. cloudaudit_googleapis_com_data_access_09252022.

As shown in the above comparison table, with Log Analytics, you don’t need to know apriori the specific log name nor the exact table name for that log since all logs are available in the same view. This greatly simplifies querying especially when you want to search and correlate across different logs types.

You can still control the scope of a given query by optionally specifying log_id or log_name in your WHERE clause. For example, to restrict the query to data_access logs, you can add the following:

WHERE log_id = “cloudaudit.googleapis.com/data_access”

Unified log schema

Since there’s only one schema for all logs, there’s one superset schema in Log Analytics that is managed for you. This schema is a collation of all possible log schemas. For example, the schema accommodates the different possible types of payloads in a LogEntry (protoPayload, textPayload and jsonPayload) by mapping them to unique fields (proto_payload, text_payload and json_payload respectively):

Log field names have also generally changed from camelCase (e.g. logName) to snake_case (e.g. log_name). There are also new fields such as log_id, that is log_id of each log entry.

Another user-facing schema change is the use of native JSON data type by Log Analytics for some fields representing nested objects like json_payload and labels. Since JSON-typed columns can include arbitrary JSON objects, the Log Analytics schema doesn’t list the fields available in that column. This is in contrast to traditional BigQuery log sink which has pre-defined rigid schemas for every log type including every nested field.  With a more flexible schema that includes JSON fields, Log Analytics can support semi-structured data including arbitrary logs while also making queries simpler, and in some cases faster.

Schema migration guide

With all these table schema changes, how would you compose new or translate your existing SQL queries from traditional BigQuery log sink to Log Analytics?

The following lists side-by-side all log fields and maps them to corresponding column names and types, for both cases of traditional Log sink routing into BigQuery, and the new Log Analytics. Use this table as a migration guide to help you identify breaking changes, properly reference the new fields and methodically migrate your existing SQL queries:

All fields with breaking changes are bolded to make it visually easier to track where changes are needed. For example, if you’re querying audit logs, you’re probably referencing and parsing protopayload_auditlog STRUCT field. Using the schema migration table above, you can see how that field now maps to proto_payload.audit_log STRUCT field with Log Analytics. 

Notice the newly added fields are marked in yellow cells and the JSON-converted fields are marked in red cells.

Schema changes summary

Based on the above schema migration guide, there are 5 notable breaking changes (beyond the general column name change from camelCase to snake_case):

1) Fields whose type changed from STRING to JSON (highlighted in red above):

metadataJson

requestJson

responseJson

resourceOriginalStateJson 

2) Fields whose type changed from STRUCT to JSON (also highlighted in red above):

labels

resource.labels

jsonPayload

jsonpayload_type_loadbalancerlogentry

protopayload_auditlog.servicedata_v1_bigquery

protopayload_auditlog.servicedata_v1_iam

protopayload_auditlog.servicedata_v1_iam_admin

3) Fields which are further nested:

protopayload_auditlog (now proto_payload.audit_log)

protopayload_requestlog (now proto_payload.request_log)

4) Fields which are coalesced into one:

jsonPayload (now json_payload)

jsonpayload_type_loadbalancerlogentry (now json_payload)

jsonpayload_v1beta1_actionlog (now json_payload)

5) Other fields with type changes:

httpRequest.latency (from FLOAT to STRUCT)

Query migration patterns

For each of these changes, let’s see how your SQL queries should be translated. Working through examples, we highlight below SQL excerpts and provide a link to complete SQL query in Community Security Analytics (CSA) repo for full real-world examples. In the following examples:

‘Before’ refers to SQL with traditional BigQuery log sink, and

‘After’ refers to SQL with Log Analytics

Pattern 1: Referencing nested field from a STRING column now turned into JSON: 
This pertains to some of the fields highlighted in red in the schema migration table, namely: 

metadataJson

requestJson

responseJson

resourceOriginalStateJson

Before: JSON_VALUE(protopayload_auditlog.metadataJson, ‘$.violationReason’)
After: JSON_VALUE(proto_payload.audit_log.metadata.violationReason)

Real-world full query: CSA 1.10

Before: JSON_VALUE(protopayload_auditlog.metadataJson, ‘$.ingressViolations[0].targetResource’)
After: JSON_VALUE(proto_payload.audit_log.metadata.ingressViolations[0].targetResource)

Real-world full query: CSA 1.10

Pattern 2: Referencing nested field from a STRUCT column now turned into JSON: 
This pertains to some of the fields highlighted in red in the schema migration table, namely: 

labels

resource.labels

jsonPayload

jsonpayload_type_loadbalancerlogentry

protopayload_auditlog.servicedata*

Before: jsonPayload.connection.dest_ip
After: JSON_VALUE(jsonPayload.connection.dest_ip)

Real-world full query: CSA 6.01

Before: resource.labels.backend_service_name
After: JSON_VALUE(resource.labels.backend_service_name)

Real-world full query: CSA 1.20

Before: jsonpayload_type_loadbalancerlogentry.statusdetails
After: JSON_VALUE(json_payload.statusDetails)

Real-world full query: CSA 1.20

Before: protopayload_auditlog.servicedata_v1_iam.policyDelta.bindingDeltas
After: JSON_QUERY_ARRAY(proto_payload.audit_log.service_data.policyDelta.bindingDeltas)

Real-world full query: CSA 2.20

Pattern 3: Referencing fields from protoPayload:
This pertains to some of the bolded fields in the schema migration table, namely: 

protopayload_auditlog (now proto_payload.audit_log)

protopayload_requestlog (now proto_payload.request_log)

Before: protopayload_auditlog.authenticationInfo.principalEmail
After: proto_payload.audit_log.authentication_info.principal_email

Real-world full query: CSA 1.01

Pattern 4: Referencing fields from jsonPayload of type load balancer log entry:

Before: jsonpayload_type_loadbalancerlogentry.statusdetails
After: JSON_VALUE(json_payload.statusDetails)

Real-world full query: CSA 1.20

Pattern 5: Referencing latency field in httpRequest:

Before: httpRequest.latency
After: http_request.latency.nanos / POW(10,9)

Conclusion

With Log Analytics, you can reduce the cost and complexity of log analysis, by moving away from self-managed log sinks and BigQuery datasets, into Google-managed log sink and BigQuery dataset while also taking advantage of faster and simpler querying. On top of that, you also get the features included in Cloud Logging such as the Logs Explorer for real-time troubleshooting, logs-based metrics, log alerts and Error Reporting for automated insights. 

Armed with this guide, switching to use Log Analytics for log analysis can be easy. Use the above schema migration guide and apply the 5 prescriptive migration patterns, to help you convert your BigQuery SQL log queries or to author new ones in Log Analytics.

Related Article

Read Article

Source : Data Analytics Read More

100,000 new SUVs booked in 30 minutes: How Mahindra built its online order system

100,000 new SUVs booked in 30 minutes: How Mahindra built its online order system

Almost 70 years ago, starting in 1954, the Mahindra Group began assembling the Indian version of the Willys CJ3. Willys were arguably the first SUV in any country, and that vehicle would lay the groundwork for our Automotive Division’s continued leadership in the space, up to our iconic and best-selling Scorpio models.

When it came time to launch the newest version, the Scorpio-N this summer, we knew we wanted to attempt something as special and different as the vehicle itself. As in most markets, vehicle sales in India are largely made through dealerships. Yet past launches have shown us an enthusiasm among our tech-savvy buyers to have a different kind of sales experience, not unlike those they have come to expect from so many other products. 

As a result, we set out to build a first-of-its-kind site for digital bookings. We knew it would face a serious surge, like most e-commerce sites on a big sales day, but that was the kind of traffic automotive sites are hardly accustomed to.

To our delight, the project exceeded our wildest expectations, setting digital sales records in the process. On launch day, July 30, 2022, we saw more than 25,000 booking requests in the first minute, and 100,000 booking requests in the first 30 minutes, totaling USD 2.3 billion in car sales. 

At its peak, there were around 60,000 concurrent users on the booking platform trying to book the vehicle. Now let’s look under the hood of how to create a platform robust and scalable enough to handle an e-commerce-level rush for the automotive industry.

A cloud-first approach to auto sales and architecture

Our aim was to build a clean, lean, and highly efficient system, which is also fast, robust, and scalable. And to achieve it, we went back to the drawing board to remove all the inefficiencies in our existing online and dealer booking processes. We put on our design thinking hats, to give our customers and dealers a platform that was meant to be used during high rush launches and does the only thing which mattered during launch day: the ability for all to book a vehicle swiftly and efficiently.

While order booking use cases are quite common development scenarios, our particular challenge was to handle a large volume of orders in a very short time, and ensure almost immediate end-user response times. Each order required a sequence of business logic checks, customer notifications, payment flow, and interaction with our CRM systems. We knew we needed to build a cloud-first solution that could scale to meet the surge and then rapidly scale down once the rush was over.

We arrived at a list of required resources about three months before the launch date and planned for resources to be reserved for our Google Cloud project. We chose to build the solution on managed platform services, which allowed us to focus on developing our solution logic rather than worrying about day-two concerns such as platform scalability and security. The core platform stack is comprised of Google Kubernetes Engine (GKE), Cloud Spanner, and Cloud Memorystore (Redis), and is supported by Container Registry, Pub/Sub, Cloud Functions, reCaptcha Enterprise, Google Analytics, and Google Cloud’s operations suite. The solution architecture is described in detail in the following section.

Architecture components

The diagram below depicts the high-level solution architecture. We had three key personas interacting with our portal: customers, dealers, and our admin team. To identify the microservices, we dissected the use cases for each of these personas and designed parameterized microservices to serve them. As solution design progressed, our microservices-based approach allowed us to quickly adapt business logic and keep up with changes suggested by our sales teams. The front-end web application was created using ReactJS as a single-page application, while the microservices were built using NodeJS and hosted on Google Kubernetes Engine (GKE).

Container orchestration with Google Kubernetes Engine

GKE provides Standard and Autopilot as two modes of operation. In addition to the features provided by the Standard mode, GKE Autopilot mode adds day-two conveniences such as Google Cloud managed nodes. We opted for GKE Standard mode, with nodes provisioned across three Google Cloud availability zones in the Mumbai Google Cloud region, as we were aware of the precise load pattern to be anticipated, and the portal was going to be relatively short-lived. OSS Istio was configured to route the traffic within the cluster, which was sitting behind a cloud load balancer, itself behind the CDN. All microservices code components were built, packaged into containers, and deployed via our corporate build platform. At peak, we had 1,200 GKE nodes in operation.

All customer notifications generated in the user flow were delivered via email and SMS/text messages. These were routed via Pub/Sub, acting as a queue, with Cloud Functions draining the queues and delivering them via partner SMS gateways and Mahindra’s email APIs. Given the importance of sending timely SMS notifications of booking confirmations, two independent third-party SMS gateway providers were used to ensure redundancy and scale. Both Pub/Sub and Cloud Functions scaled automatically to keep up with notification workload.  

Data strategy  

Given the need for incredibly high transaction throughput for a short burst of time, we chose Spanner as the primary datastore as it offers the best features of relational databases and scale-out performance of NoSQL databases. Using Spanner not only provided us the scale needed to store the car bookings rapidly, but also allowed the admin teams to see real-time drill-down pivots of sales performance across vehicle models, towns and dealerships, without the need for an additional analytical processing layer. Here’s how:
Spanner uniquely offers Interleaved tables that physically collocate the child table rows with the parent table row, leading to faster retrieval. Spanner also has a scale-out model where it automatically and dynamically partitions data across compute nodes (splits) to scale out the transaction workload. We were able to prevent Spanner from dynamically partitioning data during peak traffic, by pre-warming the Spanner database with representative data, and allowing it to settle before the booking window opened. 

Together, these benefits ensured a quick and seamless booking and checkout process for our customers.

We chose Memorystore (Redis) to serve mostly static, master data such as models, cities/towns, and dealer lists. It also served as the primary store for user session/token tracking. Separate Memorystore clusters were provisioned for each of the above needs. 

UI/UX Strategy  

We kept the website in line with a lean booking process. We only had the necessary components that a customer would need to book the vehicle: 1) vehicle choice, 2) the dealership to deliver the vehicle to, 3) the customer’s personal details, and 4) payment mode.

Within the journey, we worked towards a lean system and ensured all images and other master assets were optimized for size and pushed to Cloudflare CDN, with cache enabled to reduce latency and to reduce server calls. All the static and resource files were pushed to CDN during the build process.

On the service backend side, we had around 10 microservices that were independent of each other. Each microservice was scaled proportionally to the request frequency and the data it was processing. The source code was reviewed and optimized to have fewer iterations. We made sure there were no bottlenecks in any of the microservices and had mechanisms in place to recover in case there were some failures.

Monitoring the solution

Monitoring the solution was going to be a key necessity. We anticipated that customer volume would spike when the web portal launched on a specific date and time, so the solution team required real-time operational visibility into how each component was performing. To monitor the performance of all Google Cloud services, specific Google Cloud Monitoring dashboards were developed. Custom dashboards were also developed to analyze application logs via Cloud Trace and Cloud Logging. This allowed the operations team to monitor some business metrics correlated with operations status in real time. The war room team kept track of end users’ experiences by manually navigating through the main booking flow and logging in to the portal. 

Finally, integration with Google Analytics gave our team almost real-time visibility to user traffic in terms of use cases, with the ability to drill down to get city/state-wise details. 

Preparing for the portal launch

The team did extensive performance testing ahead of the launch. The critical parameter was to achieve low, single-digit end-user response times in seconds, for all customer requests. Given that the architecture exclusively used REST APIs and sync calls wherever possible for client-server communication, the team had to test the REST APIs to arrive at the best GKE and Spanner sizing to meet the peak performance test target of 250,000 concurrent users. Locust, an open-source performance testing tool running on an independent GKE cluster, was used to perform and monitor the stress test. Numerous configurations (e.g. min/max pod settings in GKE, Spanner indexes and interleaved storage settings, introducing MemoryStore for real-time counters, etc.) were tuned during the process. We did extensive load testing which established GKE’s and Spanner’s ability to handle the traffic spike we were expecting by a significant margin.

Transforming the SUV buying experience

In India, the traditional SUV purchasing process is offline and centered around dealerships. Pivoting to an exclusive online booking experience needed internal business process tweaks to make it simple and secure for customers and dealers to do online bookings themselves. With our deep technical partnership with Google Cloud in powering the successful Scorpio-N launch event, we feel we have influenced a shift in the SUV buying experience, where we received more than 70% of the first 25,000 booking requests directly from buyers sitting in their homes. 

The Mahindra Automotive team looks forward to continuing to drive digital innovations in the Indian automotive sector with Google Cloud.

Related Article

Read Article

Source : Data Analytics Read More

Secure streaming data with Private Service Connect for Confluent Cloud

Secure streaming data with Private Service Connect for Confluent Cloud

Data speed and security should not be mutually exclusive, which is why Confluent Cloud, a cloud-first data streaming platform built by the founders of Apache Kafka, secures your data through encryption at rest and enables secure data in motion.

However, for the most sensitive data — particularly data generated by organizations in highly regulated industries such as financial services and healthcare — only fully segregated private pipelines will do. That’s why we’re excited to announce that Confluent Cloud now supports Google Cloud Private Service Connect (PSC) for secure network connectivity. 

A better data security solution

For many companies, a multi-layer data security policy starts with minimizing network attack vectors exposed to the public internet. Blocking internet access to key resources such as Apache Kafka clusters can prevent security breaches, DDOS attacks, spam, and other issues. To enable communications, organizations have relied on virtual private cloud (VPC) peering — where two parties share network addresses across two networks — for private network connectivity, but this has its downsides. 

VPC peering requires both parties to coordinate on an IP address block for communication between the networks. Many companies have limited IP space and finding an available IP address block can be challenging, requiring a lot of back and forth between teams. This can be especially painful in large organizations with hundreds of networks connected in sophisticated topologies. Applications that need access to Kafka are likely spread across many networks, and peering them all to Confluent Cloud is a lot of work.

Another concern of VPC peering is that each party has access to the other’s network. Confluent Cloud users want their clients to initiate connections to Confluent Cloud but restrict Confluent from having access back into their network.

Google Cloud PSC can overcome these shortfalls. PSC allows for a one-way, secure, and private connection from your VPC to Confluent Cloud. Confluent exposes a service attachment for each new network, for which customers can create corresponding PSC endpoints in their own VPCs on Google Cloud. There’s no need to juggle IP address blocks as clients connect using the PSC endpoint. The one-way connection from the customer to Confluent Cloud means there is less surface area for the network security team to keep secure. Making dozens or even hundreds of PSC connections to a single Confluent Cloud network doesn’t require any extra coordination, either with Confluent or within your organization.

This networking option combines a high level of data security with ease of setup and use. Benefits of using Private Service Connect with your Confluent Cloud networks include:

A secure, unidirectional gateway connection to Confluent Cloud that must be initiated from your VPC network to allow traffic to flow over Private Service Connect to Confluent Cloud

Centralized management with Google Cloud Console to configure DNS resolution for your private endpoints 

Registration of Google Cloud project IDs helps ensure that only your trusted projects have access

No need to coordinate CIDR ranges between your network and Confluent Cloud

To learn how to use Private Service Connect with your Confluent Cloud networks, read the developer documentation on confluent.com

The power of managed Kafka on Google Cloud

Confluent on Google Cloud brings the power of real-time data streaming to organizations without the exorbitant costs and technical challenges of in-house solutions. As Confluent grows and reaches across different industries, it will continue to support more customers who face more highly regulated or other risk-averse use cases. For those customers, private connectivity from a virtual network is an ideal solution for accessing Confluent’s SaaS offerings. Confluent can now address this need by offering Private Service Connect to simplify architectures and connectivity in Google Cloud while helping to eliminate the risk of data exfiltration. 

With the addition of Private Service Connect support, it’s easier than ever for organizations in need of private connectivity to take advantage of Confluent’s fully managed cloud service on Google Cloud to help eliminate the burdens and risks of self-managing Kafka and focus more time on building apps that differentiate your business.

Get started with a free trial on the Google Cloud Marketplace today. And to learn more about the launch of Private Service Connect, visit cnfl.io/psc.

Related Article

Read Article

Source : Data Analytics Read More

Building an automated data pipeline from BigQuery to EarthEngine with Cloud Functions

Building an automated data pipeline from BigQuery to EarthEngine with Cloud Functions

Over the years, vast amounts of satellite data have been collected and ever more granular data are being collected everyday. Until recently, those data have been an untapped asset in the commercial space. This is largely because the tools required for large scale analysis of this type of data were not readily available and neither was the satellite imagery itself. Thanks to Earth Engine, a planetary-scale platform for Earth science data & analysis, that is no longer the case. 

The platform, which was recently announced as a generally available Google Cloud Platform (GCP) product, now allows commercial users across industries to operationalize remotely sensed data. Some Earth Engine use cases that are already being explored include sustainable sourcing, climate risk detection, sustainable agriculture, and natural resource management. Developing spatially focused solutions for these use cases with Earth Engine unlocks distinct insights for improving business operations. Automating those solutions produces insights faster, removes toil and limits the introduction of error. 

The automated data pipeline discussed in this post brings data from BigQuery into Earth Engine and is in the context of a sustainable sourcing use case for a fictional consumer packaged goods company, Cymbal. This use case requires two types of data. The first is data that Cymbal already has and the second is data that is provided by Earth Engine and the Earth Engine Data Catalog. In this example, the data owned by Cymbal is starting in BigQuery and flowing through the data pipeline into Earth Engine through an automated process.

A helpful way to think about combining these data is as a layering process, similar to assembling a cake. Let’s talk through the layers for this use case. The base layer is satellite imagery, or raster data, provided by Earth Engine. The second layer is the locations of palm plantations provided by Cymbal, outlined in black in the image below. The third and final layer is tree cover data from the data catalog, the pink areas below. Just like the layers of a cake, these data layers come together to produce the final product. The goal of this architecture is to automate the aggregation of the data layers.

Another example of a use case where this architecture could be applied is in a methane emission detection use case. In that case, the first layer would remain the same. The second layer would be facility location details (i.e. name and facility type) provided by the company or organization. Methane emission data from the data catalog would be the third layer. As with methane detection and sustainable supply chain, most use cases will involve some tabular data collected by companies or organizations. Because the data are tabular, BigQuery is a natural starting point. To learn more about tabular versus raster data and when to use BigQuery versus Earth Engine, check out this post.

Now that you understand the potential value of using Earth Engine and BigQuery together in an automated pipeline, we will go through the architecture itself. In the next section, you will see how to automate the flow of data from GCP products, like BigQuery, into Earth Engine for analysis using Cloud Functions. If you are curious about how to move data from Earth Engine into BigQuery you can read about it in this post.

Architecture Walkthrough

Cymbal has the goal of gaining more clarity in their palm oil supply chain which is primarily located in Indonesia. Their specific goal is to identify areas of potential deforestation. In this section, you will see how we can move the data Cymbal already has about the locations of palm plantations into Earth Engine in order to map those territories over satellite images to equip Cymbal with information about what is happening on the ground. Let’s walk through the architecture step by step to better understand how all of the pieces fit together. If you’d like to follow along with the code for this architecture, you can find it here.

Architecture

Step by Step Walkthrough

1. Import Geospatial data into BigQuery
Cymbal’s Geospatial Data Scientist is responsible for the management of the data they have about the locations of palm plantations and how it arrives in BigQuery.

2. A Cloud Scheduler task sends a message to a Pub/Sub topic
A Cloud Scheduler task is responsible for starting the pipeline in motion. Cloud Scheduler tasks are cron tasks and can be scheduled at any frequency that fits your workflow. When the task runs it sends a message to a Pub/Sub topic.

3. The Pub/Sub topic receives a message and triggers a Cloud Function

4. The first Cloud Function transfers the data from BigQuery to Cloud Storage
The data must be moved into Cloud Storage so that it can be used to create an Earth Engine asset

5. The data arrives in the Cloud Storage bucket and triggers a second Cloud Function

6. The second Cloud Function makes a call to the Earth Engine API and creates an asset in Earth Engine
The Cloud Function starts by authenticating with Earth Engine. It then makes an APIcall creating an Earth Engine asset from the Geospatial data that is in Cloud Storage.

7. AnEarth Engine App (EE App) is updated when the asset gets created in Earth Engine
This EE App is primarily for the decision makers at Cymbal who are primarily interested in high impact metrics. The application is a dashboard giving the user visibility into metrics and visualizations without having to get bogged down in code.

8. A script for advanced analytics is made accessible from the EE App
An environment for advanced analytics in the Earth Engine code editor is created and made available through the EE App for Cymbal’s technical users. The environment gives the technical users a place to dig deeper into any questions that arise from decision makers about areas of potential deforestation.

9. Results from analysis in Earth Engine can be exported back to Cloud Storage
When a technical user is finished with their further analysis in the advanced analytics environment they have the option to run a task and export their findings to Cloud Storage. From there, they can continue their workflow however they see fit.

With these nine high-level steps, an automated workflow is achieved that provides a solution for Cymbal, giving them visibility into their palm oil supply chain. Not only does the solution address the company wide goal, it also keeps in mind the needs of various types of users at Cymbal. 

Summary

We’ve just walked through the architecture for an automated data pipeline from BigQuery to Earth Engine using Cloud Functions. The best way to deepen your understanding of this architecture and how all of the pieces fit together is to walk through building the architecture in your own environment. We’ve made building out the architecture easy by providing a Terraform Script available on GitHub. Once you have the architecture built out, try swapping out different elements of the pipeline to make it more applicable to your own operations. If you are looking for some inspiration or are curious to see another example, be sure to take a look at this post which brings data from Earth Engine into BigQuery. The post walks through creating a Cloud Function that pulls temperature and vegetation data from the Landsat satellite imagery within the GEE Catalog from SQL in BigQuery. Thanks for reading.

Related Article

Analyzing satellite images in Google Earth Engine with BigQuery SQL

Learn how to use BigQuery SQL inside Google Earth Engine to analyze satellite imagery to track farm health.

Read Article

Source : Data Analytics Read More

Analyzing satellite images in Google Earth Engine with BigQuery SQL

Analyzing satellite images in Google Earth Engine with BigQuery SQL

Google Earth Engine (GEE)  is a groundbreaking product that has been available for research and government use for more than a decade. Google Cloud recently launched GEE to General Availability for commercial use. This blog post describes a method to utilize GEE from within BigQuery’s SQL allowing SQL speakers to get access to and value from the vast troves of data available within Earth Engine.

We will use Cloud Functions to allow SQL users at your organization to make use of the computation and data catalog superpowers of Google Earth Engine.  So, if you are a SQL speaker and you want to understand how to leverage a massive library of earth observation data in your analysis then buckle up and read on.

Before we get started let’s spend thirty seconds on setting geospatial context for our use-case.  BigQuery excels at doing operations on vector data.  Vector data are things like points, polygons, things that you can fit into a table.  We use the PostGIS syntax so users that have used spatial SQL before will feel right at home in BigQuery.  

BigQuery has more than 175+ public datasets available within Analytics Hub.  After doing analysis in BigQuery users can use tools like GeoViz,  Data Studio, Carto and Looker to visualize those insights. 

Earth Engine is designed for raster or imagery analysis, particularly satellite imagery. GEE, which holds more than 70PB of satellite imagery, is used to detect changes, map trends, and quantify differences on the Earth’s surface. GEE is widely used to extract insights from satellite images to make better use of  land, based on its diverse geospatial datasets and easy-to-use application programming interface (API).

By using these two products in conjunction with each other you can expand your analysis to incorporate both vector and raster datasets to combine insights from 70PB of GEE and 175+ datasets from BigQuery.  For example, in this blog we’ll create a Cloud Function that pulls temperature and vegetation data from the Landsat satellite imagery within the GEE Catalog and we’ll do it all from SQL in BigQuery. If you are curious about how to move data from BigQuery into Earth Engine you can read about it in this post.

While our example is focused on agriculture this method can apply to any industry that matters to you.

Let’s get started 

Agriculture is transforming with the implementation of modern technologies. Technologies such as GPS and satellite image dissemination allow researchers and farmers to gain more information, monitor and manage agricultural resources. Satellite imagery can be a reliable source to track images of how a field is developing. 

A common analysis of imagery used in agricultural tools today is Normalized Difference Vegetation Index (NDVI). NDVI is a measurement of plant health that is visually displayed with a legend from -1 to +1. Negative values are indicative of water and moisture. But high NDVI values suggest a dense vegetation canopy. Imagery and yield tend to have a high correlation; thus, it can be used with other data like weather to drive seeding prescriptions.

As an agricultural engineer you are keenly interested in crop health for all the farms and fields that you manage.  The healthier the crop the better the yield and the more profit the farm will produce.  Let’s assume you have mapped all your fields and the coordinates are available in BQ. You now want to calculate the NDVI of every field, along with the average temperature for different months, to ensure the crop is healthy and take necessary action if there is an unexpected fall in NDVI. So the question is  how do we pull NDVI and temperature information into BigQuery for the fields by only using SQL?

Using GEE’s ready-to-go Landsat 8 imagerywe can calculate NDVI for any given point on the planet. Similarly, we can use the publicly available ERA5 dataset of monthly climate for global terrestrial surfaces to calculate the average temperature for any given point.

Architecture

Cloud Functions are a powerful tool to augment the SQL commands in BigQuery.  In this case we are going to wrap a GEE script within a Cloud Function and call that function directly from BigQuery’s SQL. Before we start, let’s get the environment set up.

Environment setup

Before you proceed we need to get the environment setup:

A Google Cloud project with billing enabled.  (Note:  this example cannot run within the BigQuery Sandbox as a billing account is required to run Cloud Functions)

Ensure your GCP user has access to Earth Engine, can create Service accounts and assign roles. You can sign up for Earth Engine at Earth Engine Sign Up. Verify if you have access, check if you can view the Earth Engine Code Editor with your GCP user.

At this point Earth Engine and BigQuery are enabled and ready to work for you. Now let’s set up the environment and define the cloud functions.

1. Once you have created your project in GCP, select it on the console and click on cloud-shell.

2. On cloud-shell, you will need to clone a git repository which contains the shell script and assets required for this demo. Run the following command on cloud shell,

code_block[StructValue([(u’code’, u’git clone https://github.com/dojowahi/earth-engine-on-bigquery.gitrncd ~/earth-engine-on-bigqueryrnchmod +x *.sh’), (u’language’, u”), (u’caption’, <wagtail.wagtailcore.rich_text.RichText object at 0x3ee1d943a550>)])]

3. Edit config.sh – In your editor of choice update the variables in config.sh to reflect your GCP project.

4. Execute setup_sa.sh. You will be prompted to authenticate and you can choose “n” to use your existing auth.

code_block[StructValue([(u’code’, u’sh setup_sa.sh’), (u’language’, u”), (u’caption’, <wagtail.wagtailcore.rich_text.RichText object at 0x3ee1d943a1d0>)])]

4. If the shell script has executed successfully, you should now have a new Service Account created, as shown in the image below

5. A Service Account(SA) in format <PROJECT_NUMBER>-compute@developer.gserviceaccount.com was created in the previous step, you need to sign up this SA for Earth Engine at EE SA signup. Check out the last line of the screenshot above it will list out SA name

The screenshot below shows how the signup process looks for registering your SA.

6. Execute deploy_cf.sh, it should take around 10 minutes for the deployment to complete.

code_block[StructValue([(u’code’, u’sh deploy_cf.sh’), (u’language’, u”), (u’caption’, <wagtail.wagtailcore.rich_text.RichText object at 0x3ee1ea169ad0>)])]

You should now have a dataset named gee and table land_coords under your project in BigQuery along with the functions get_poly_ndvi_month and get_poly_temp_month.

You will also see a sample query output on the Cloud shell, as shown below

7. Now execute the command below in Cloudshell

code_block[StructValue([(u’code’, u”bq query –use_legacy_sql=false ‘SELECT name,gee.get_poly_ndvi_month(aoi,2020,7) as ndvi_jul, gee.get_poly_temp_month(aoi,2020,7) as temp_jul FROM `gee.land_coords` LIMIT 10′”), (u’language’, u”), (u’caption’, <wagtail.wagtailcore.rich_text.RichText object at 0x3ee1ea7367d0>)])]

and you should see something like this

If you are able to get a similar output to one shown above, then you have successfully executed SQL over Landsat imagery.

Now navigate to the BigQuery console and your screen should look something like this:

You should see a new external connection us.gcf-ee-conn, two external routines called get_poly_ndvi_month, get_poly_temp_month and a new table land_coords.

Next navigate to the Cloud functions console and you should see two new functions polyndvicf-gen2 and polytempcf-gen2 as shown below.

At this stage your environment is ready. Now you can go to the BQ console and execute queries. The query below calculates the NDVI and temperature for July 2020 for all the field polygons stored in the table land_coords

code_block[StructValue([(u’code’, u’select name,rnst_centroid(st_geogfromtext(aoi)) as centroid,rngee.get_poly_ndvi_month(aoi,2020,7) AS ndvi_jul,rngee.get_poly_temp_month(aoi,2020,7) AS temp_jul rnFROM `gee.land_coords`’), (u’language’, u”), (u’caption’, <wagtail.wagtailcore.rich_text.RichText object at 0x3ee1db774d90>)])]

The output should look something like this:

When the user executes the query in BQ, the function get_poly_ndvi_month and get_poly_temp_month trigger remote calls to the cloud functions polyndvicf-gen2 and polytempcf-gen2 which would initiate the script on GEE. The results from GEE are streamed back to the BQ console and shown to the user.

What’s Next?

You can now plot this data on a map in Data Studio or Geoviz and publish it to your users

Now that your data is within BigQuery, you can join this data with your private datasets or other public datasets within BigQuery and build ML models using BigQuery ML to predict crop yields, seed prescriptions.

Summary

The example above demonstrates how users can wrap GEE functionality within Cloud Functions so that GEE can be executed exclusively within SQL. The method we have described requires someone who can write GEE scripts. The advantage is that once the script is built,  all of your SQL-speaking data analysts-scientists-engineers can do calculations on vast troves of satellite imagery in GEE directly from the BigQuery UI or API.

Once the data and results are in BigQuery you can join the data with other tables in BigQuery or with the data available through Analytics Hub.  Additionally with this method, users can combine GEE data with other functionality such as geospatial functions or BQML.  In future we’ll expand our examples to include these other BigQuery capabilities.

Thanks for reading, and remember,  if you are interested in learning more about how to move data from BigQuery to Earth Engine together, check out this blog post. The post outlines a solution for a sustainable sourcing use case for a fictional consumer packaged goods company trying to understand their palm oil supply chain which is primarily located in Indonesia. 

Acknowledgements: Shout out to David Gibson and Chao Shen for valuable feedback.

Related Article

Mosquitoes get the swat with new Mosquito Forecast built by OFF! Insect Repellents and Google Cloud

By visualizing data about mosquito populations with Google Earth Engine, SC Johnson built an app that predicts mosquito outbreaks in your…

Read Article

Source : Data Analytics Read More