Built with BigQuery: How Datalaksa provides a unified marketing and customer data warehouse for brands in South East Asia

Built with BigQuery: How Datalaksa provides a unified marketing and customer data warehouse for brands in South East Asia

Editor’s note: The post is part of a series highlighting our partners, and their solutions, that are Built with BigQuery.

Datalaksa is a unified marketing and customer data warehouse created by Persuasion Technologies, a Big Data Analytics & Digital Marketing consultancy serving clients throughout South East Asia. It enables marketing teams to optimize campaigns by combining data from across their marketing channels and enabling insight driven actions across marketing automation and delivery systems.

In this post, we explore how they have leveraged Google BigQuery and Google’s other data cloud products to build a solution that is rapid to set-up, highly flexible and able to scale with the needs of their customers. 

Through close collaboration with their customers, Persuasion Technologies gained first hand experience of the challenges they face trying to optimize campaigns across multiple channels.  “Marketing and CRM teams find it difficult to gain the insights that drive decisions across their marketing channels.” said Tzu Ming Chu, Director, Persuasion Technologies. “An ever-increasing variety of valuable data resides in siloed systems, while the teams that can integrate and analyze that data have never been more in demand. All too frequently this means that campaign planning is incomplete or too slow and campaign execution is less effective, ultimately resulting in lower sales and missed opportunities.”

Marketing teams of all sizes face similar challenges:

Access to technical skills and resources. Integrating data from the various sources requires skilled, and scarce, technical resources to scope out requirements, design solutions, build the pipelines that connect data sources, develop data models and ensure data quality. Machine learning (ML) requires data scientists to develop models to generate advanced insights, and ML Ops engineers to make sure those models are always updated and can be used for scoring at the needed scale.

Access to technology. While smaller companies may not have a data warehouse at all, even in large companies that do, gaining access to it and having resources allocated can be a long and difficult process, often with a lack of flexibility to accommodate local needs and with limitations to what can be provided. 

Ease of use. Even a well architected data warehouse may see little usage if data or marketing teams can’t figure out how to deep dive into the data. Without an intuitive data model, an easy to use interface that enables business users to query, transform and visualize data and beverage AI models that automate insights and predict outcomes, the full benefits will not be realized. 

Flexibility. Each marketing team is different – they each have their own set of requirements, data sources and use cases, and they continue to evolve and scale over time. Many of-the-shelf solutions lack the flexibility to accommodate the unique needs of each business.

In these challenges, the Persuasion Technologies team saw an opportunity — an opportunity to help their customers in a repeatable way, ensuring they all had easy access to rich data warehouse capabilities, and to enable them to create a new product-centric business and revenue stream. 

Datalaksa, a unified marketing and customer data warehouse

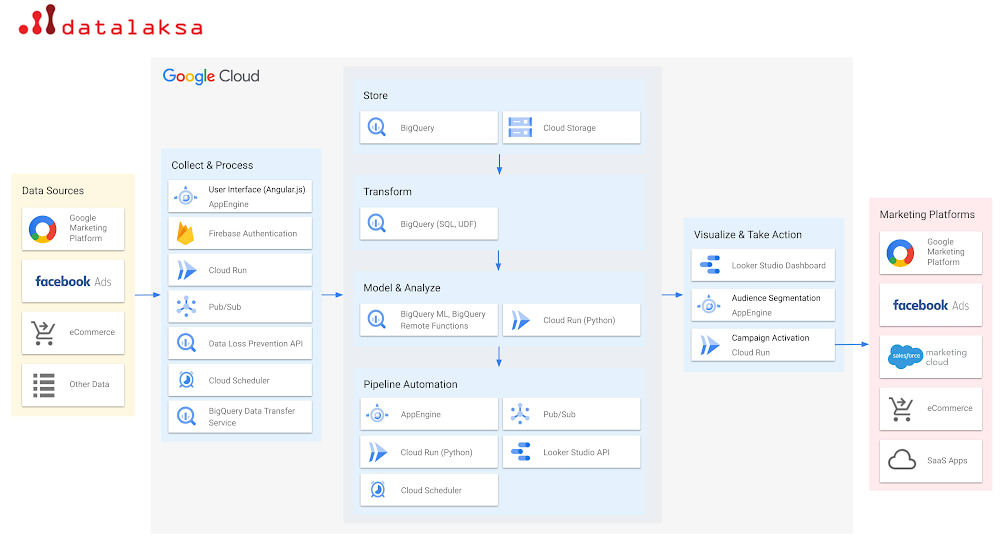
Datalaksa is a solution that enables marketing teams to easily, securely and scalably bring together marketing and customer data from multiple channels into a cloud data warehouse and enables them with advanced capabilities to derive actionable insights and take actions that increase campaign efficiency and effectiveness. 

Out of the box, Datalaksa includes data connectors that enable data to be imported from a wide range of platforms such as Google Marketing Platform, Facebook Ads and eCommerce systems, which means that marketing teams can unify data from across channels quickly and easily without reliance on scarce and costly technical resources to build and maintain integrations.

To accelerate time-to-insight, Datalaksa provides pre-built data models, machine learning models and analytical templates for key marketing use cases such as cohort analyses, customer clustering, campaign recommendation and lifetime value models, all wrapped within an simple and intuitive user interface that enables marketing teams to easily query, transform, enrich and analyze their data – decreasing the time from data to value. 

It’s often said that “insight without action is worthless” — to ensure this is not the case for Datalaksa users, the solution prompts action through notifications and enables audience segmentation tools and integrations back to marketing automation systems such as Salesforce Marketing Cloud, Google Ads and eCommerce systems. 

For example, teams can set thresholds and conditions using SQL queries to send notification emails for ‘out of stock’ or `low stock’ to relevant teams and automatically update product recommendation algorithms to offer in-stock items. Through built-in connectors, customer audience segments can be activated by automatically updating ad buying audiences in platforms including Tik Tok, Google Ads, Linkedin and Facebook or Instagram. These can be scheduled and updated regularly. 

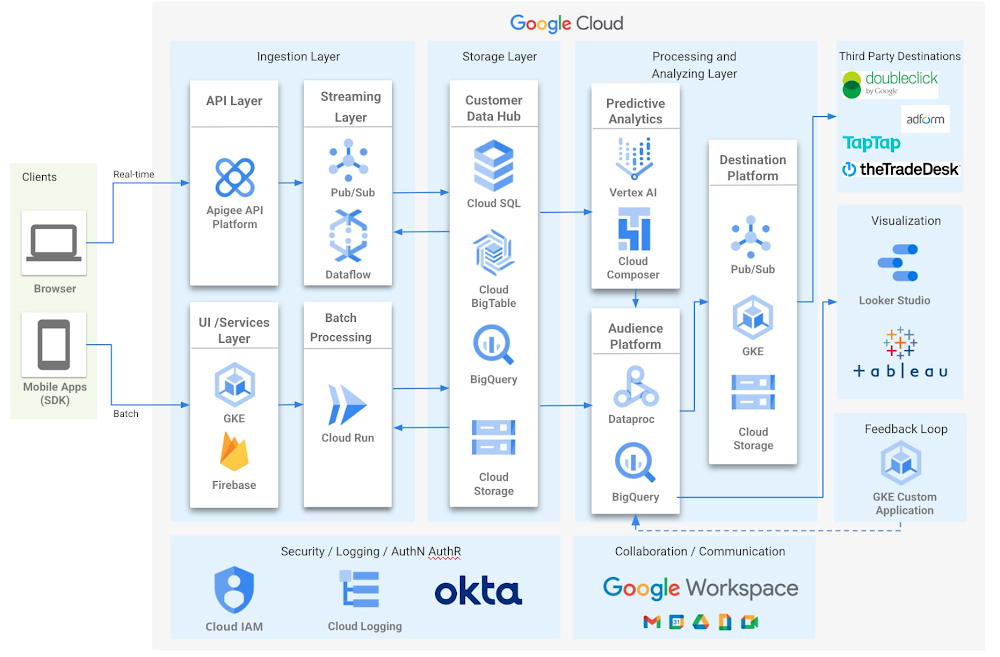
All of this is built using Google’s BigQuery and data cloud suite of products.

Why Datalaksa chose Google Cloud and BigQuery

The decision to use Google Cloud and BigQuery for Datalaksa was an easy one according to Tzu, “Not only did it accelerate our ability to provide our customers with industry leading data warehousing and analytical capabilities, it’s incredibly easy to integrate with many key marketing systems, including those from Google. This equates directly to saved time and cost, not just during the initial design and build, but in the ongoing support and maintenance.”

Persuasion Technologies story is one of deep expertise, customer empathy and innovative thinking, but BigQuery and Google Cloud’s end to end platform for building data driven applications is also key part of their success:

World class analytics. By leveraging BigQuery as the core of Datalaksa, they were immediately able to provide their customers with a fully-managed, petabyte-scale, world class analytics solution with a 99.99% SLA. Additionally, integrated, fully managed services like Cloud Data Loss Prevention help their users discover, classify, and protect their most sensitive data. This is a huge advantage for a startup, and enables them to focus their time on creating value for their customers by building their expertise into their product.

Built-in industry leading ML/AI. To deliver advanced machine learning capabilities to its customers, Datalaksa uses BigQuery ML. As the name suggests, BigQuery ML is built right into BigQuery, so not only does it enable them to easily leverage a wide range of advanced ML models, it further decreases development time and cost by eliminating the need to move data between the data warehouse and separate ML system, while enabling people no coding skills to gain extra insights by developing machine learning models using SQL constructs.

Serverless scalability and efficiency. As all of the services that Datalaksa uses are serverless or fully managed services, they offer high levels of resiliency and effortlessly scale up and down with their customers’ needs while keeping the total cost of ownership low by minimizing the operational overheads.    

Simplified data integration. Datalaksa is rapidly adding connections to Google data sources such as Google Ads and YouTube, and hundreds of other SaaS services, through BigQuery Data Transfer Service (DTS), and through access to a wide range of 3rd party connectors in the Google Cloud Marketplace including Facebook Ads and eCommerce cart connectors.

The Built with BigQuery advantage for ISVs

Through Built with BigQuery, Google is helping tech companies like Persuasion Technologies build innovative applications on Google’s data cloud with simplified access to technology, helpful and dedicated engineering support, and joint go-to-market programs. Participating companies can: 

Get started fast with a Google-funded, pre-configured sandbox. 

Accelerate product design and architecture through access to designated experts from the ISV Center of Excellence who can provide insight into key use cases, architectural patterns, and best practices. 

Amplify success with joint marketing programs to drive awareness, generate demand, and increase adoption.

BigQuery gives ISVs the advantage of a powerful, highly scalable data warehouse that’s integrated with Google Cloud’s open, secure, sustainable platform. And with a huge partner ecosystem and support for multi cloud, open source tools and APIs, Google provides technology companies the portability and extensibility they need to avoid data lock-in. 

Click these links to learn more about Datalaksa and Built with BigQuery.

Related Article

Built with BigQuery: Retailers drive profitable growth with SoundCommerce

SoundCommerce uses Analytics Hub to increase the pace of innovation by sharing datasets with its customers in real-time by using the stre…

Read Article

Source : Data Analytics Read More

Break down data silos with the new cross-cloud transfer feature of BigQuery Omni

Break down data silos with the new cross-cloud transfer feature of BigQuery Omni

To help customers break down data silos, we launched BigQuery Omni in 2021. Organizations globally are using BigQuery Omni to analyze data across cloud environments. Now, we are excited to launch the next big evolution for multi cloud analytics: cross-cloud analytics. Cross-cloud analytics tools help analysts and data scientists easily, securely, and cost effectively distribute data between clouds to leverage the analytics tools they need. In April 2022, we previewed a SQL supported LOAD statement that allowed AWS/Azure blob data to be brought into BigQuery as a managed table for advanced analysis. We’ve learned a lot in this preview period. A few learnings stand out:

Cross-cloud operations need to meet analysts where they are. In order for analysts to work with distributed data, workspaces should not be siloed. As soon as analysts are asked to leave their SQL workspaces to copy data, set up permissions, or grant permission, workflows break down and insights are lost. Same SQL can be used to periodically copy data using BigQuery scheduled queries. The more of the workflow that can be managed by SQL, the better. 

Networking is an implementation detail, latency should be too. The longer an analyst needs to wait for an operation to complete, the less likely a complete workflow is to be completed end-to-end. BigQuery users expect high performance for a single operation, even if those operations are managed across multiple data centers.

Democratizing data shouldn’t come at the cost of security. In order for data admins to empower data analysts and engineers, they need to be assured there isn’t additional risk in doing so. By default, data admins and security teams are increasingly looking for solutions that don’t persist user credentials between cloud boundaries. 

Cost control comes with cost transparency. Data transfer costs can get costly, and we hear frequently this is the number 1 concern for multi-cloud data organizations. Providing transparency into single operations and invoices in a consolidated way is critical to driving success for cross-cloud operations. Allowing administrators to cap costs for budgeting is a must.

This feedback is why we’ve spent much of this year improving our cross-cloud transfer product to optimize releases around these core tenants: 

Usability: The LOAD SQL experience allows for data filtering and loading within the same editor across clouds. LOAD SQL supports data formats like JSON, CSV, AVRO, ORC and PARQUET. With semantics for both appending and truncating tables, LOAD supports both periodic syncs and refreshing the complete table semantics. We’ve also added SQL support for data lake standards like Hive partitioning and JSON data type.  

Security: With a federated identity model, users don’t have to share or store credentials between cloud providers to access and copy their data. We also now support CMEK support for the destination table to help secure data as it’s written in BigQuery and VPC-SC boundaries to mitigate data exfiltration risks. 

Latency: With data movement managed by BigQuery Write API, users can effortlessly move just the relevant data without having to wait for complex pipes. We’ve improved job latency significantly for the most common load jobs and are seeing performance improvements with each passing day. 

Cost auditability: From one invoice, you can see all your compute and transfer costs for LOADs across clouds. Each job comes with statistics to help admins manage budgets.

During our preview period, we saw good proof points on how cross-cloud transfer can be used to accelerate time to insight and deliver value to data teams. 

Getting started with a cross-cloud architecture can be daunting, but cross-cloud transfer has been used to help customers jumpstart proof of concepts because it enables the migration of subsets of data without committing to a full migration. Kargo used cross-cloud transfer to accelerate a performance test of BigQuery. “We tested Cross-Cloud Transfer to assist with a proof of concept on BigQuery earlier this year.  We found the usability and performance useful during the POC,” said Dinesh Anchan, Manager of Engineering at Kargo. 

We also saw this product being used to combine key datasets across clouds. A common challenge for customers is to manage cross-cloud billing data. CCT is being used to tie files together which have evolving schema on delivery for blob storage. “We liked the experience of using Cross-Cloud transfer to help consolidate our billing files across GCP, AWS, and Azure.  CCT was a nice solution because we could use SQL statements to load our billing files into BigQuery,” said the engineering lead of a large research institution. 

We’re excited to release the first of many cross-cloud features through BigQuery Omni. Check out the Google Cloud Next session to learn about more upcoming launches in the multicloud analytics space including support for Omni tables and local transformations to help supercharge these experiences for analysts and data scientists. We’re investing in cross-cloud because cloud boundaries shouldn’t slow innovation. Watch this space.

Availability and pricing

Cross-Cloud Transfer is now available in all BigQuery Omni regions. Check the BigQuery Omni pricing page for data transfer costs.

Getting Started

It has never been easier for analysts to move data between clouds. Check out our getting started (AWS/Azure) page to try out this SQL experience. For a limited trial, BigQuery customers can explore BigQuery Omni at no charge using on-demand byte scans from September 15, 2022 to March 31, 2023 (the “trial period”) for data scans on AWS/Azure. Note: data transfer fees for Cross-Cloud Transfer will still apply.

Source : Data Analytics Read More

Cloud Pub/Sub announces General Availability of exactly-once delivery

Cloud Pub/Sub announces General Availability of exactly-once delivery

Today the Google Cloud Pub/Sub team is excited to announce the GA launch of exactly-once delivery feature. With this availability, Pub/Sub customers can receive exactly-once delivery within a cloud region and the feature provides following guarantees:

No redelivery occurs once the messages has been successfully acknowledged

No redelivery occurs while a message is outstanding. A message is considered outstanding until the acknowledgment deadline expires or the message is acknowledged.

In case of multiple valid deliveries, due to acknowledgment deadline expiration or client-initiated negative acknowledgment, only the latest acknowledgment ID can be used to acknowledge the message. Any requests with a previous acknowledgment ID will fail.

This blog discusses the exactly-once delivery basics, how it works, best practices and feature limitations.

Duplicates 

Without exactly-once delivery, customers have to build their own complex, stateful processing logic to remove duplicate deliveries. With the exactly-once delivery feature, there are now stronger guarantees around not delivering the message while the acknowledgment deadline has not passed. It also makes the acknowledgement status more observable by the subscriber. The result is the capability to process messages exactly once much more easily. Let’s first understand why and where duplicates can be introduced. 

Pub/Sub has the following typical flow of events:

Publishers publish messages to a topic.

Topic can have one or more subscriptions and each subscription will get all the messages published to the topic.

A subscriber application will connect to Pub/Sub for the subscription to start receiving messages (either through a pull or push delivery mechanism).

In this basic messaging flow, there are multiple places where duplicates could be introduced. 

Publisher

Publisher might have a network failure resulting in not receiving the ack from Cloud Pub/Sub. This would cause the publisher to republish the message.

Publisher application might crash before receiving acknowledgement on an already published message.

Subscriber

Subscriber might also experience network failure post-processing the message, resulting in not acknowledging the message. This would result in redelivery of the message when the message has already been processed.

Subscriber application might crash after processing the message, but before acknowledging the message. This would again cause redelivery of an already processed message.

Pub/Sub

Pub/Sub service’s internal operations (e.g. server restarts, crashes, network related issues) resulting in subscribers receiving duplicates.

It should be noted that there are clear differences between a valid redelivery and a duplicate:

A valid redelivery can happen either because of client-initiated negative acknowledgment of a message or when the client doesn’t extend the acknowledgment deadline of the message before the acknowledgment deadline expires. Redeliveries are considered valid and the system is working as intended.

A duplicate is when a message is resent after a successful acknowledgment or before acknowledgment deadline expiration.

Exactly-once side effects

“Side effect” is a term used when the system modifies the state outside of its local environment. In the context of messaging systems, this is equivalent to a service being run by the client that pulls messages from the messaging system and updates an external system (e.g., transactional database, email notification system). It is important to understand that the feature does not provide any guarantees around exactly-once side effects and side effects are strictly outside the scope of this feature.

For instance, let’s say a retailer wants to send push notifications to its customers only once. This feature ensures that the message is sent to the subscriber only once and no redelivery occurs either once the message has been successfully acknowledged or it is outstanding. It is the subscriber’s responsibility to leverage the email notification system’s exactly-once capabilities to ensure that message is pushed to the customer exactly once. Pub/Sub has neither connectivity nor control over the system responsible for delivering the side effect, and hence Pub/Sub’s exactly-once delivery guarantee should not be confused with exactly-once side effects.

How it works

Pub/Sub delivers this capability by taking the delivery state that was previously only maintained in transient memory and moving it to a massively scalable persistence layer. This allows Pub/Sub to provide strong guarantees that no duplicates will be delivered while a delivery is outstanding and no redelivery will occur once the delivery has been acknowledged. Acknowledgement IDs used to acknowledge deliveries have versioning associated with them and only the latest version will be allowed to acknowledge the delivery or change the acknowledge deadline for the delivery. RPCs with any older version of the acknowledgement ID will fail. Due to the introduction of this internal delivery persistence layer, exactly-once delivery subscriptions have higher publish-to-subscribe latency compared to regular subscriptions.

Let’s understand this through an example. Here we have a single publisher, publishing messages to a topic. The topic has one subscription, for which we have three subscribers.

Now let’s say a message (in blue) is sent to subscriber#1. At this point, the message is outstanding, which means that Pub/Sub has sent the message, but subscriber#1 has not acknowledged it yet. This is very common as the best practice is to process the message first before acknowledging it. Since the message is outstanding, this new feature will ensure that no duplicates are sent to any of the subscribers. 

The persistent layer for exactly-once delivery stores a version number with every delivery of a message, which is also encoded in the delivery’s acknowledgement ID. The existence of an unexpired entry indicates there is already an outstanding delivery and that we should not deliver a message (providing the stronger guarantee around the acknowledgement deadline). An attempt to acknowledge a message or modify its acknowledgement deadline with an acknowledgement ID that does not contain the most recent version can be rejected and a useful error message can be returned to the acknowledgement request.

Coming back to the example, a delivery version for the delivery of message M (in blue) to subscriber#1 will be stored internally within Pub/Sub (let’s call it delivery#1). This would track that a delivery of message M is outstanding. Subscriber#1 successfully processes the message and sends back an acknowledgement (ACK#1). The message is then removed eventually from Pub/Sub (pertaining to the topic’s retention policy). 

Now let’s consider a scenario that could potentially generate duplicates and how Pub/Sub’s exactly-once delivery feature guards against such failures.

An example

In this scenario, subscriber#1 gets the message and processes it by locking a row on the database. The message is outstanding at this point and an acknowledgement has not been sent to Pub/Sub. Pub/Sub knows through its delivery versioning mechanism that a delivery (delivery#1) is outstanding with subscriber#1.

Without the stronger guarantees provided by this feature, a message could be redelivered to the same or a different subscriber (subscriber#2) while it is still outstanding. This would cause subscriber#2 trying to get a lock on the database for the update, resulting in multiple subscribers trying to get locks for the same row, causing processing delays.

Exactly-once delivery eliminates this situation. Due to the introduction of the data deduplication layer, Pub/Sub knows that there is an outstanding delivery#1 which is unexpired and it should not deliver the same message to this subscriber (or any other subscriber).

Using exactly-once delivery

Simplicity is a key pillar of Pub/Sub. We have ensured that the feature is really easy to use. You can create a subscription with exactly-once delivery using the Google Cloud console, the Google Cloud CLI, client library, or Pub/Sub API. Please note that only pull subscription type supports exactly-once delivery, including subscribers that use the StreamingPull API. This documentation section provides more details on creating a pull subscription with exactly-once delivery.

Using the feature effectively

Consider using our latest client libraries to get the best feature experience.

You should also use new interfaces in the client libraries that allow you to check the response for acknowledgements. Successful response will guarantee no redelivery. Specific client libraries samples can be found here – C++, C#, Go, Java, Node.js, PHP, Python, Ruby

To reduce network related ack expirations, leverage minimum lease extension setting : Python, Node.js, Go (MinExtensionPeriodin)

Limitations

Exactly-once delivery is a regional feature. That is, the guarantees provided only apply for subscribers running in the same region. If a subscription with exactly-once delivery enabled has subscribers in multiple regions, they might see duplicates.

For other subscription types (push and BigQuery), Pub/Sub initiates the delivery of messages and uses the response from the delivery as an acknowledgement; the message receiver has no way to know if the acknowledgement was actually processed. In contrast, pull subscriber clients initiate acknowledgement requests to Pub/Sub, which respond with whether or not the acknowledgement was successful. This difference in delivery behavior means that exactly-once semantics do not align well with non-pull subscriptions.

To get started, you can read more about exactly-once delivery feature or simply create a new pull subscription for a topic using Cloud Console or the gcloud CLI.

Additional resources

Please check out the additional resources available at to explore this feature further:

Documentation

Client libraries

Samples: Create subscription with exactly-once delivery and Subscribe with exactly-once delivery

Quotas

Source : Data Analytics Read More

Built with BigQuery: Zeotap uses Google BigQuery to build highly customized audiences at scale

Built with BigQuery: Zeotap uses Google BigQuery to build highly customized audiences at scale

Zeotap’s mission is to help brands monetise customer data in a privacy-first Europe. Today, Zeotap owns three data solutions. Zeotap CDP is the next-generation Customer Data Platform that empowers brands to collect, unify, segment and activate customer data. Zeotap CDP puts privacy and security first while empowering marketers to unlock and derive business value in their customer data with a powerful and marketer-friendly user interface. Zeotap Data delivers quality targeting at scale by enabling the activation of 2,500 tried-and-tested Champion Segments across 100+ programmatic advertising and social platforms. ID+ is a universal marketing ID initiative that paves the way for addressability in the cookieless future. Zeotap’s CDP is a SaaS application that is hosted on Google Cloud. A client can use Zeotap CDP SaaS product suite to onboard its first-party data, use the provided tools to create audiences and activate them on marketing channels and advertising platforms. 

Zeotap partnered with Google Cloud to provide a customer data platform that is differentiated in the market with a focus on privacy, security and compliance. Zeotap CDP, built with BigQuery, is empowered with tools and capabilities to democratize AI/ML models to predict customer behavior and personalize the customer experience to enable the next generation digital marketing experts to drive higher conversion rates, return on advertising spend and reduce customer acquisition cost.

The capability to create actionable audiences that are highly customized the first time, improve speed to market to capture demand and drive customer loyalty are differentiating factors. However, as the audiences get more specific it becomes more difficult to estimate and tune the size of the audience segment. Being able to identify the right customer attributes is critical for building audiences at scale. 

Consider the following example, a fast fashion retailer has a broken size run and is at risk of taking a large markdown because of an excess of XXS and XS sizes. What if you are able to instantly build an audience of customers who have a high propensity for this brand or style, tend to purchase at full price, and match the size profile for the remaining inventory to drive full price sales and avoid costly markdowns. 

Most CDPs provide size information only after a segment is created and its data processed. If the segment sizes are not relevant and quantifiable, the target audiences list has to be recreated impacting speed to market and capturing customer demand. Estimating the segment size and tuning the size of the audience segment is often referred to as the segment size estimation problem. The segment size needs to be estimated and segments should be available for exploration and processing with a sub-second latency to provide a near real-time user experience.

Traditional approaches to solve this problem relies on pre-aggregation database models which involve sophisticated data ingestion and failure management, thus wasting a lot of compute hours and requiring extensive pipeline orchestration. There are a number of disadvantages with this traditional approach:

Higher cost and maintenance as multiple Extract, Transform and Load (ETL) processes are involved

Higher failure rate and re-processing required from scratch in case of failures

Takes hours/days to ingest data at large-scale

Zeotap CDP relies on the power of Google Cloud Platform to tackle this segment size estimation problem using BigQuery for processing and estimation, the BI Engine to provide sub-second latency required for online predictions and Vertex AI ecosystem with BigQuery ML to provide a no-code AI segmentation and lookalike audiences. Zeotap CDP’s strength is to offer this estimation at the beginning of segment creation before any kind of data processing using pre-calculated metrics. Any correction in segment parameters can be made near real time, saving a lot of user’s time.

The data cloud, with BigQuery at its core, functions as a data lake at scale and the analytical compute engine that calculates the pre-aggregated metrics. The BI engine is used as a caching and acceleration layer to make these metrics available with near sub-second latency. Compared to the traditional approach this setup does not require a heavy data processing framework like Spark/Hadoop or sophisticated pipeline management. Microservices deployed on the GKE platform are used for orchestration using BigQuery SQL ETL capabilities. This does not require a separate data ingestion in the caching layer as the BI engine works seamlessly in tandem with BigQuery and is enabled using a single setting.

The below diagram depicts how Zeotap manages the first party data and solves for the segment size estimation problem.

The API layer, powered by Apigee provides secure client access to Zeotap’s API infrastructure to read and ingest first party data in real-time. The UI Services Layer, backed by GKE and Firebase provides access to Zeotap’s platform front-ending audience segmentation, real-time workflow orchestration / management, analytics & dashboards. The Stream & Batch processing manages the core data ingestion using PubSub, Dataflow and Cloud Run. Google BigQuery, Cloud SQL, BigTable and Cloud Storage make up all of the Storage layer. 

The Destination Platform allows clients to activate its data across various marketing channels, data management and ad management platforms like Google DDP, TapTap, TheTradeDesk etc (plus more than 150+ such integrations). Google BigQuery is at the heart of the Audience Platform to allow clients to slice and dice its first party assets, enhance it with Zeotap’s universal ID graph or its third-party data assets and push to downstream destinations for activation and funnel analysis. The Predictive Analytics layer allows clients to create and activate machine-learned (e.g. CLV and RFM modeling) based segments with just a few clicks. Cloud IAM, Cloud Operations suite and Collaborations tools deliver the cross-sectional needs of security, logging and collaboration. 

For segment/audience size estimation, the core data that is client’s first party data resides in its own GCP project. First step here is to identify low cardinality columns using BigQuery’s “approx count distinct” capabilities. At this time, Zeotap supports a sub-second estimation on only low cardinality ( represents the number of unique values) dimensions, like Gender with Male/Female/M/N values and Age with limited age buckets. A sample query looks like this,

Once pivoted by columns, the results look like this

Now the cardinality numbers are available for all columns, they are divided into two groups, one below the threshold (low cardinality) and one above the threshold (high cardinality). Next step is to run a reverse ETL query to create aggregates on low cardinality dimensions and corresponding HLL sketches for user count (measure) dimensions.

A sample query looks like this

The resultant data is loaded into a separate estimator Google Cloud project for further processing and analysis. This project contains a metadata store with datasets required for processing client requests and is front ended with BI engine to provide acceleration to estimation queries. With this process, the segment size is calculated using pre-aggregated metrics without processing the entire first party dataset and enables the end user to create and experiment with a number of segments without incurring any delays as in the traditional approach.

This approach obsoletes ETL steps required to realize this use-case which drives a benefit of over 90% time reduction and 66% cost reduction for the segment size estimation. Also, enabling BI engine on top of BigQuery boosts query speeds by more than 60%, optimizes resource utilization and improves query response as compared to native BigQuery queries. The ability to experiment with audience segmentation is one of the many capabilities that Zeotap CDP provides their customers. The cookieless future will drive experimentation with concepts like topics for IBA (Interest-based advertising) and developing models that support a wide range of possibilities in predicting customer behavior.

There is an ever increasing demand for shared data, where customers are requesting access to the finished data in the form of datasets to share both within and across the organization through external channels. These datasets unlock more opportunities where the curated data can be used as-is or coalesced with other datasets to create business centric insights or fuel innovation by enabling ecosystem or develop visualizations. To meet this need, Zeotap is leveraging Google Cloud Analytics Hub to create a rich data ecosystem of analytics-ready datasets. 

Analytics Hub is powered by Google BigQuery, which provides a self-service approach to securely share data by publishing and subscribing to trusted data sets as listings in Private and Public Exchanges. It allows Zeotap to share the data in place having full control while end customers have access to fresh data without the need to move data at large scale. 

Click here to learn more about Zeotap’s CDP capabilities or to request a demo.

The Built with BigQuery advantage for ISVs 

Google is helping tech companies like Zeotap build innovative applications on Google’s data cloud with simplified access to technology, helpful and dedicated engineering support, and joint go-to-market programs through the Built with BigQuery initiative, launched in April as part of the Google Data Cloud Summit. Participating companies can: 

Get started fast with a Google-funded, pre-configured sandbox. 

Accelerate product design and architecture through access to designated experts from the ISV Center of Excellence who can provide insight into key use cases, architectural patterns, and best practices. 

Amplify success with joint marketing programs to drive awareness, generate demand, and increase adoption.

BigQuery gives ISVs the advantage of a powerful, highly scalable data warehouse that’s integrated with Google Cloud’s open, secure, sustainable platform. And with a huge partner ecosystem and support for multi-cloud, open source tools and APIs, Google provides technology companies the portability and extensibility they need to avoid data lock-in. 

Click here to learn more about Built with BigQuery.

We thank the Google Cloud and Zeotap team members who co-authored the blog:
Zeotap: Shubham Patil, Engineering Manager; Google: Bala Desikan, Principal Architect and Sujit Khasnis, Cloud Partner Engineering

Related Article

Built with BigQuery: How True Fit’s data journey unlocks partner growth

True Fit, a data-driven personalization platform built on Google Data Cloud to provide fit personalization for retailers by sharing curat…

Read Article

Source : Data Analytics Read More

BigQuery Geospatial Functions – ST_IsClosed and ST_IsRing

BigQuery Geospatial Functions – ST_IsClosed and ST_IsRing

Geospatial data analytics lets you use location data (latitude and longitude) to get business insights. It’s used for a wide variety of applications in industry, such as package delivery logistics services, ride-sharing services, autonomous control of vehicles, real estate analytics, and weather mapping. 

BigQuery, Google Cloud’s large-scale data warehouse, provides support for analyzing large amounts of geospatial data. This blog post discusses two geography functions we’ve recently added in order to expand the capabilities of geospatial analysis in BigQuery: ST_IsClosed and ST_IsRing.

BigQuery geospatial functions

In BigQuery, you can use the GEOGRAPHY data type to represent geospatial objects like points, lines, and polygons on the Earth’s surface. In BigQuery, geographies are based on the Google S2 Library, which uses Hilbert space-filling curves to perform spatial indexing to make the queries run efficiently. BigQuery comes with a set of geography functions that let you process spatial data using standard ANSI-compliant SQL. (If you’re new to using BigQuery geospatial analytics, start with Get started with geospatial analytics, a tutorial that uses BigQuery to analyze and visualize the popular NYC Bikes Trip dataset.) 

The new ST_IsClosed and ST_IsRing functions are boolean accessor functions that help determine whether a geographical object (a point, a line, a polygon, or a collection of these objects) is closed or is a ring. Both of these functions accept a GEOGRAPHY column as input and return a boolean value. 

The following diagram provides a visual summary of the types of geometric objects.

For more information about these geometric objects, see Well-known text representation of geometry in Wikipedia.

Is the object closed? (ST_IsClosed)

The ST_IsClosed function examines a GEOGRAPHY object and determines whether each of the elements of the object has an empty boundary. The boundary for each element is defined formally in the ST_Boundary function. The following rules are used to determine whether a GEOGRAPHY object is closed:

A point is always closed.

A linestring is closed if the start point and end point of the linestring are the same.

A polygon is closed only if it’s a full polygon.

A collection is closed if every element in the collection is closed. 

An empty GEOGRAPHY object is not closed. 

Is the object a ring? (ST_IsRing)

The other new BigQuery geography function is ST_IsRing. This function determines whether a GEOGRAPHY object is a linestring and whether the linestring is both closed and simple. A linestring is considered closed as defined by the ST_IsClosed function. The linestring is considered simple if it doesn’t pass through the same point twice, with one exception: if the start point and end point are the same, the linestring forms a ring. In that case, the linestring is considered simple.

Seeing the new functions in action

The following query shows you what the ST_IsClosed and ST_IsRing function return for a variety of geometric objects. The query creates a series of ad-hoc geography objects and uses the UNION ALL statement to create a set of inputs. The query then calls the ST_IsClosed and ST_IsRing functions to determine whether each of the inputs are closed or are rings. You can run this query in the BigQuery SQL workspace page in the Google Cloud console.

code_block[StructValue([(u’code’, u”WITH example AS(rn SELECT ST_GeogFromText(‘POINT(1 2)’) AS geographyrn UNION ALLrn SELECT ST_GeogFromText(‘LINESTRING(2 2, 4 2, 4 4, 2 4, 2 2)’) AS geographyrn UNION ALLrn SELECT ST_GeogFromText(‘LINESTRING(1 2, 4 2, 4 4)’) AS geographyrn UNION ALLrn SELECT ST_GeogFromText(‘POLYGON((0 0, 2 2, 4 2, 4 4, 0 0))’) AS geographyrn UNION ALLrn SELECT ST_GeogFromText(‘MULTIPOINT(5 0, 8 8, 9 6)’) AS geographyrn UNION ALLrn SELECT ST_GeogFromText(‘MULTILINESTRING((0 0, 2 0, 2 2, 0 0), (4 4, 7 4, 7 7, 4 4))’) AS geographyrn UNION ALLrn SELECT ST_GeogFromText(‘GEOMETRYCOLLECTION EMPTY’) AS geographyrn UNION ALLrn SELECT ST_GeogFromText(‘GEOMETRYCOLLECTION(POINT(1 2), LINESTRING(2 2, 4 2, 4 4, 2 4, 2 2))’) AS geography)rnSELECTrn geography,rn ST_IsClosed(geography) AS is_closed, rn ST_IsRing(geography) AS is_ring rnFROM example;”), (u’language’, u”), (u’caption’, <wagtail.wagtailcore.rich_text.RichText object at 0x3e1d11501f50>)])]

The console shows the following results. You can see in the is_closed and is_ring columns what each function returns for the various input geography objects.

The new functions with real-world geography objects

In this section, we show queries using linestring objects that represent line segments that connect some of the cities in Europe. We show the various geography objects on maps and then discuss the results that you get when you call ST_IsClosed and ST_IsRing for these geography objects. 

You can run the queries by using the BigQuery Geo Viz tool. The maps are the output of the tool. In the tool you can click the Show results button to see the values that the functions return for the query.

Start point and end point are the same, no intersection

In the first example, the query creates a linestring object that has three segments. The segments are defined by using four sets of coordinates: the longitude and latitude for London, Paris, Amsterdam, and then London again, as shown in the following map created by the Geo Viz tool:

The query looks like the following:

code_block[StructValue([(u’code’, u”WITH example AS (rnSELECT ST_GeogFromText(‘LINESTRING(-0.2420221 51.5287714, 2.2768243 48.8589465, 4.763537 52.3547921, -0.2420221 51.5287714)’) AS geography)rnSELECT rn geography, rn ST_IsClosed(geography) AS is_closed,rn ST_IsRing(geography) AS is_ringrnFROM example;”), (u’language’, u”), (u’caption’, <wagtail.wagtailcore.rich_text.RichText object at 0x3e1d11501ed0>)])]

In the example table that’s created by the query, the columns with the function values show the following:

ST_IsClosed returns true. The start point and end point of the linestring are the same.

ST_IsRing returns true. The geography is closed, and it’s also simple because there are no self-intersections.

Start point and end point are different, no intersection

Another scenario is when the start and end points are different. For example, imagine two segments that connect London to Paris and then Paris to Amsterdam, as in this map:

The following query represents this set of coordinates:

code_block[StructValue([(u’code’, u”WITH example AS (rnSELECT ST_GeogFromText(‘LINESTRING(-0.2420221 51.5287714, 2.2768243 48.8589465, 4.763537 52.3547921)’) AS geography)rnSELECT rn geography, rn ST_IsClosed(geography) AS is_closed,rn ST_IsRing(geography) AS is_ringrnFROM example;”), (u’language’, u”), (u’caption’, <wagtail.wagtailcore.rich_text.RichText object at 0x3e1d112f9610>)])]

This time, the ST_IsClosed and ST_IsRing functions return the following values:

ST_IsClosed returns false. The start point and end point of the linestring are different.

ST_IsRing returns false. The linestring is not closed. It’s simple because there are no self-intersections, but ST_IsRing returns true only when the geometry is both closed and simple.

Start point and end point are the same, with intersection

The third example is a query that creates a more complex geography. In the linestring, the start point and end point are the same. However, unlike the earlier example, the line segments of the linestring intersect. A map of the segments shows connections that go from London to Zürich, then to Paris, then to Amsterdam, and finally back to London:

In the following query, the linestring object has five sets of coordinates that define the four segments:

code_block[StructValue([(u’code’, u”WITH example AS (rnSELECT ST_GeogFromText(‘LINESTRING(-0.2420221 51.5287714, 8.393389 47.3774686, 2.2768243 48.8589465, 4.763537 52.3547921, -0.2420221 51.5287714)’) AS geography)rnSELECT rn geography,rn ST_IsClosed(geography) AS is_closed,rn ST_IsRing(geography) as is_ringrnFROM example;”), (u’language’, u”), (u’caption’, <wagtail.wagtailcore.rich_text.RichText object at 0x3e1d112f97d0>)])]

In the query, ST_IsClosed and ST_IsRing return the following values:

ST_IsClosed returns true. The start point and end point are the same, and the linestring is closed despite the self-intersection.

ST_IsRing returns false. The linestring is closed, but it’s not simple because of the intersection.

Start point and end point are different, with intersection

In the last example, the query creates a linestring that has three segments that connect four points: London, Zürich, Paris, and Amsterdam. On a map, the segments look like the following:

The query is as follows:

code_block[StructValue([(u’code’, u”WITH example AS (rnSELECT ST_GeogFromText(‘LINESTRING(-0.2420221 51.5287714, 8.393389 47.3774686, 2.2768243 48.8589465, 4.763537 52.3547921)’) AS geography)rnSELECT rn geography, rn ST_IsClosed(geography) AS is_closed,rn ST_IsRing(geography) AS is_ringrnFROM example;”), (u’language’, u”), (u’caption’, <wagtail.wagtailcore.rich_text.RichText object at 0x3e1d108378d0>)])]

The new functions return the following values:

ST_IsClosed returns false. The start point and end point are not the same.  

ST_IsRing returns false. The linestring is not closed and it’s not simple.

Try it yourself

Now that you’ve got an idea of what you can do with the new ST_IsClosed and ST_IsRing functions, you can explore more on your own. For details about the individual functions, read the ST_IsClosed and ST_IsRing entries in the BigQuery documentation. To learn more about the rest of the geography functions available in BigQuery Geospatial, take a look at the BigQuery geography functions page.

Thanks to Chad Jennings, Eric Engle and Jing Jing Long for their valuable support to add more functions to BigQuery Geospatial.  Thank you Mike Pope for helping review this article.

Source : Data Analytics Read More

Secure data exchanges with Analytics Hub, now generally available

Secure data exchanges with Analytics Hub, now generally available

In today’s world, organizations view data sharing to be a critical component of their overall data strategy. Businesses are striving to unlock new insights and make more informed decisions by sharing and consuming data from partners, customers, and other sources. There are many organizations also looking to generate new revenue streams by monetizing their data assets. However, existing technologies used to exchange data pose many challenges for customers. Traditional data sharing techniques such as FTP, email, and APIs are expensive to maintain and often result in multiple copies of stale data, especially when sharing in scale. Organizations are looking for ways to make data sharing more reliable and consistent.

We recently announced the general availability of Analytics Hub. This fully-managed service enables organizations to securely exchange data and analytics assets within or across organizational boundaries. Backed by the unique architecture of BigQuery, customers can now share real-time data at scale without moving the data, leading to tremendous cost savings for their data management. As part of this launch, we have added functionality for both data providers and subscribers to realize the full potential of shared data, including:

Regional support: Analytics Hub service is now available in all the supported regions in BigQuery.

Subscription Management: Data providers can now easily view and manage subscriptions for all their shared datasets in a single view.

Governance & Access: Administrators can now monitor the usage of Analytics Hub through Audit Logging and Information Schema, while enforcing VPC Service Controls to securely share data.

Search & Discovery: We have revamped the search experience with filter facets to help subscribers quickly find relevant listings

Data Ecosystem: We added hundreds of new public and commercial listings in Analytics Hub across industries such as finance, geospatial, climate, retail, and more to help organizations consume data from third-party sources. We have also added first-party data from Google including Google Trends, Google’s Diversity Annual Report, Google Cloud Release Notes, Carbon-Free Energy Data for GCP Data Centers, COVID-19 Open Data: Vaccination Search Insights.

Publish-and-Subscribe model to securely share data

Analytics Hub uses a publish-and-subscribe model to distribute data at scale. As a data provider, you can create secure data exchanges and publish listings that contain the datasets you want to share. Exchanges enable you to control the users or groups that can view or subscribe to the listings. By default, exchanges are private in Analytics Hub. However, if you have public or commercial datasets that you want to make available for all Google Cloud customers, you can also request to make an exchange public. Organizations can create hundreds of exchanges to meet their data sharing needs.

Analytics Hub also provides a seamless experience to browse and search listings across all exchanges. As a data subscriber, you can easily find the dataset of interest (1) and request access or subscribe to listings that you have access to (2). By subscribing to a listing, Analytics Hub creates a read-only linked dataset within your project that you can query (3). A linked dataset is not a copy of the data; it is just a symbolic link to the shared dataset that stays in sync with any changes made to the source.

Data sharing use cases for Analytics Hub

Over a one-week period in September 2022, BigQuery saw more than 6,000 organizations sharing over 275 petabytes of data across organizational boundaries. Many of these customers also used Analytics Hub in preview to share data at scale in various scenarios. Some of these use cases include:

Internal data sharing – Customers can create exchanges for various business functions or geographics to share data internally within an organization. For example, an organization can set up a marketing exchange to publish all the latest channel performance, customer profiles, product performance, etc. 

Collaboration across organizations – When sharing data across organizational boundaries, customers can create private exchanges with each partner or business (B2B). A common example is a retailer sharing sales data with each of their suppliers.

Monetizing data assets – Data providers can also monetize their datasets and distribute the data through commercial exchanges. Today, commercial providers use an offline entitlement and billing process and provision access to the data using Analytics Hub.

Enriching insights with third-party data – Customers can discover new insights or gain a competitive advantage by leveraging external or third-party data. Analytics Hub and its rich data ecosystem provide easy access to analytics-ready public and commercial datasets. An example of a popular dataset on the platform has been Google Trends.

Here is what some of our customers and partners had to say:

“Analytics Hub allows data scientists to discover and subscribe to new data assets in the cloud with ease,” said Kimberly Bloomston, SVP of Product at LiveRamp. “With the addition of this offering, LiveRamp now fully supports GCP with a complete suite of native solutions that unlock greater accuracy, partner connectivity and audience activation for marketing and advertising. This expanded partnership provides a must-have analytic infrastructure that excels at unlocking more value from data while respecting strict global privacy regulations.”

“Securely sharing data with partners and clients is always a challenge. The questions of ownership, billing and security are not straightforward for any organization. Analytics Hub, with its publish/subscribe model, provides answers to these questions baked right into the platform.” said Jono MacDougall , Principal Software Engineer at Ravelin.

“One of our key driving factors for BigQuery adoption is availability of Analytics Hub (AH). In a prior model sharing and receiving data as flat files was laborious, inefficient and expensive. We changed that significantly with an early adoption of Analytics Hub, introducing its capabilities to our customers and partners who are also primarily on GCP, enabling multi-way data exchange between these entities and are on our way to monetizing the valuable insights we learn along the way.” said Raj Chandrasekaran, CTO at True Fit.

Next steps

Get started with Analytics Hub today by using this guide, starting a free trial with BigQuery, or contacting the Google Cloud sales team. Stay tuned for updates to our product with features such as usage metrics for providers, approval workflows, privacy-safe queries though data clean rooms, commercialization workflows, and much more.

Source : Data Analytics Read More

BigQuery’s performance powers AutoTrader UK’s real-time analytics

BigQuery’s performance powers AutoTrader UK’s real-time analytics

Editor’s note: We’re hearing today from Auto Trader UK, the UK and Ireland’s largest online automotive marketplace, about how BigQuery’s robust performance has become the data engine powering real-time inventory and pricing information across the entire organization. 

Auto Trader UK has spent nearly 40 years perfecting our craft of connecting buyers and sellers of new and used vehicles. We host the largest pool of sellers, listing more than 430,000 cars every day and attract an average of over 63 million cross platform visits each month. For the more than 13,000 retailers who advertise their cars on our platform, it’s important for them (and their customers) to be able to quickly see the most accurate, up-to-date information about what cars are available and their pricing. 

BigQuery is the engine feeding our data infrastructure 

Like many organizations, we started developing our data analytics environment with an on-premise solution and then migrated to a cloud-based data platform, which we used to build a data lake. But as the volume and variety of data we collected continued to increase, we started to run into challenges that slowed us down. 

We had built a fairly complex pipeline to manage our data ingestion, which relied on Apache Spark to ingest data from a variety of data sources from our online traffic and channels. However, ingesting data from multiple data sources in a consistent, fast, and reliable way is never a straightforward task. 

Our initial interest in BigQuery came after we discovered it integrated with a more robust event management tool for handling data updates. We had also started using Looker for analytics, which already connected to BigQuery and worked well together. As a result, it made sense to replace many parts of our existing cloud-based platform with Google Cloud Storage and BigQuery.

Originally, we had only anticipated using BigQuery for the final stage of our data pipeline, but we quickly discovered that many of our data management jobs could take place entirely within a BigQuery environment. For example, we use the command-line tool DBT, which offers support for BigQuery, to transform our data. It’s much easier for our developers and analysts to work with than Apache Spark since they can work directly in SQL. In addition, BigQuery allowed us to further simplify our data ingestion. Today, we mainly use Kafka Connect to sync data sources with BigQuery.

Looker + BigQuery puts the power of data in the hands of everyone

When our data was in the previous data lake architecture, it wasn’t easy to consume. The complexity of managing the data pipeline and running Spark jobs made it nearly impossible to expose it to users effectively. With BigQuery, ingesting data is not only easier, we also have multiple ways we can consume it through easy-to-use languages and interfaces. Ultimately, this makes our data more useful to a much wider audience.

Now that our BigQuery environment is in place, our analysts can query the warehouse directly using the SQL interface. In addition, Looker provides an even easier way for business users to interact with our data. Today, we have over 500 active users on Looker—more than half the company. Data modeled in BigQuery gets pushed out to our customer-facing applications, so that the dealers can log into a tool and manage stock or see how their inventory is performing. 

Striking a balance between optimization and experimentation

Performance in BigQuery can be almost too robust: It will power through even very unoptimized queries. When we were starting out, we had a number of dashboards running very complex queries against data that was not well-modeled for the purpose, meaning every tile was demanding a lot of resources. Over time, we have learned to model data more appropriately before making it available to end-user analytics. With Looker, we use aggregate awareness, which allows users to run common query patterns across large data sets that have been pre-aggregated. The result is that the number of interactively run queries  are relatively small. 

The overall system comes together to create a very effective analytics environment — we have the flexibility and freedom to experiment with new queries and get them out to end users even before we fully understand the best way to model. For more established use cases, we can continue optimizing to save our resources for the new innovations. BigQuery’s slot reservation system also protects us from unanticipated cost overruns when we are experimenting.

One of the examples where this played out was when we rolled new analytic capabilities out to our sales teams. They wanted to use analytics to drive conversations with customers in real-time to demonstrate how advertisements were performing on our platform and show the customer’s return on their investment. When we initially released those dashboards, we saw a huge jump in usage of the slot pool. However, we were able to reshape the data quickly and make it more efficient to run the needed queries by matching our optimizations to the pattern of usage we were seeing.

Enabling decentralized data management

Another change we experienced with BigQuery is that business units are increasingly empowered to manage their own data and derive value from it. Historically, we had a centralized data team doing everything from ingesting data to modeling it to building out reports. As more people adopt BigQuery across Auto Trader, distributed teams build up their own analytics and create new data products. Recent examples include stock inventory reporting, trade marketing and financial reporting. 

Going forward, we are focused on expanding BigQuery out into a self-service platform that enables analysts within the business to directly  build what they need. Our central data team will then evolve into a shared service, focused on maintaining the data infrastructure and adding abstraction layers where needed so it is easier for those teams to perform their tasks and get the answers they need.

BigQuery kicks our data efforts into overdrive

At Auto Trader UK, we initially planned for BigQuery to play a specific part in our data management solution, but it has become the center of our data ingestion and access ecosystem. The robust performance of BigQuery allows us to get prototypes out to business users rapidly, which we can then optimize once we fully understand what types of queries will be run in the real world. 

The ease of working with BigQuery through a well-established and familiar SQL interface has also enabled analysts across our entire organization to build their own dashboards and find innovative uses for our data without relying on our core team. Instead, they are free to focus on building an even richer toolset and data pipeline for the future.

Related Article

How Telus Insights is using BigQuery to deliver on the potential of real-world big data

BigQuery’s impressive performance reduces processing time from months to hours and delivers on-demand real-world insights for Telus.

Read Article

Source : Data Analytics Read More

Seer Interactive gets the best marketing results for their clients using Looker

Seer Interactive gets the best marketing results for their clients using Looker

Marketing strategies based on complex and dynamic data get results. However, it’s no small task to extract easy-to-act-on insights from increasing volumes and ever-evolving sources of data including search engines, social media platforms, third-party services, and internal systems. That’s why organizations turn to us at Seer Interactive. We provide every client with differentiating analysis and analytics, SEO, paid media, and other channels and services that are based on fresh and reliable data, not stale data or just hunches. 

More data, more ways

As digital commerce and footprints have become foundational for success over the past five years, we’ve experienced exponential growth in clientele. Keeping up with the unique analytics requirements of each client has required a fair amount of IT agility on our part. After outgrowing spreadsheets as our core BI tool, we adopted a well-known data visualization app only to find that it couldn’t scale with our growth and increasingly complex requirements either. We needed a solution that would allow us to pull hundreds of millions of data signals into one centralized system to give our clients as much strategic information as possible, while increasing our efficiency. After outlining our short- and long-term solution goals, we weighed the trade-offs of different designs. It was clear that the data replication required by our existing BI solution design was unsustainable. 

Previously, all our customer-facing teams created their own insights. More than 200 consultants were spending hours each week pulling and compiling data for our clients, and then creating their own custom reports and dashboards. As data sets grew larger and larger, our desktop solutions simply didn’t have the processing power required to keep up, and we had to invest significant money in training any new employees in these complex BI processes. Our ability to best serve our customers was being jeopardized because we were having trouble serving basic needs, let alone advanced use cases.

We selected Looker, Google Cloud’s business intelligence solution, as our BI platform. As the direct query leader, Looker gives us the best available capabilities for real-time analytics and time to value. Instead of lifting and shifting, we designed a new, consolidated data analytics foundation with Looker that uses our existing BigQuery platform, which can scale with any amount and type of data. We then identified and tackled quick-win use cases that delivered immediate business value for our team and clients.  

Meet users where they are in skills, requirements, and preferences

One of our first Looker projects involved redesigning our BI workflows. We built dashboards in Looker that automatically serve up the data our employees need, along with filters they use to customize insights and set up custom alerts. Users can now explore information on their own to answer new questions, knowing insights are reliable because they’re based on consistent data and definitions. More technical staff create ad hoc insights with governed datasets in BigQuery and use their preferred visualization tools like Looker  Studio, Power BI, and Tableau. We’ve also duplicated some of our data lakes to give teams a sandbox that they can experiment in using Looker embedded analytics. This enables them to quickly see more data and uncover new opportunities that provide value to our clients. Our product development team is also able to build and test prototypes more quickly, letting us validate hypotheses for a subsection of clients before making them available across the company. And because Looker is cloud based, all our users can analyze as much data as they want without exceeding the computing power of their laptops.

Seamless security and faster development

We leverage BigQuery’s access and permissioning capabilities. Looker can inherit data permissions directly from BigQuery and multiple third-party CRMs, so we’ve also been able to add granular governance strategies within our Looker user groups. This powerful combination ensures that data is accessed only by users who have the right permissions. And Looker’s unique “in-database” architecture means that we aren’t replicating and storing any data on local devices, which reduces both our time and costs spent on data management while bolstering our security posture. 

Better services and hundreds of thousands of dollars in savings

Time spent on repetitive tasks adds up over months and years. With Looker, we automate reports and alerts that people frequently create. Not only does this free up teams to discover insights that they previously wouldn’t have time to pinpoint, but they have fresh reports whenever they are needed. For instance, we automated the creation of multiple internal dashboards and external client analyses that utilize cross-channel data. In the past, before we had automation capabilities, we used to only generate these analyses up to four times a year. With Looker, we can scale and automate refreshed analyses instantly—and we can add alerts that flag trends as they emerge. We also use Looker dashboards and alerts to improve project management by identifying external issues such as teams who are nearing their allocated client budgets too quickly or internal retention concerns like employees who aren’t taking enough vacation time.

Using back-of-the-napkin math, let’s say every week 50 different people spend at least one hour looking up how team members are tracking their time. By building a dashboard that provides time-tracking insights at a glance, we save our collective team 2,500 hours a year. And if we assume the hourly billable rate is $200 an hour, we’re talking $500,000 in savings—just from one dashboard. Drew Meyer
Director of Product, Seer Interactive

The insights and new offerings to stay ahead of trends 

Looker enables us to deliver better experiences for our team members and clients that weren’t possible even two years ago, including faster development of analytics that improve our services and processes. For example, when off-the-shelf tools could not deliver the keyword-tracking insights and controls we required to deliver differentiating SEO strategies for clients, we created our own keyword rank tracking application using Looker embedded analytics. Our application provides deep-dive SEO data-exploration capabilities and gives teams unique flexibility in analyzing data while ensuring accurate, consistent insights. Going forward, we’ll continue adding new insights, data sources, and automations with Looker to create even better-informed marketing strategies that fuel our clients’ success.

Source : Data Analytics Read More

Migrating your Oracle and SQL Server databases to Google Cloud

Migrating your Oracle and SQL Server databases to Google Cloud

For several decades, before the rise of cloud computing upended the way we think about databases and applications, Oracle and Microsoft SQL Server databases were a mainstay of business application architectures. But today, as you map out your cloud journey, you’re probably reevaluating your technology choices in light of the cloud’s vast possibilities and current industry trends.

In the database realm, these trends include a shift to open source technologies (especially to MySQL, PostgreSQL, and their derivatives), adoption of non-relational databases, and multi-cloud and hybrid-cloud strategies, and the need to support global, always-on applications. Each application may require a different cloud journey, whether it’s a quick lift-and-shift migration, a larger application modernization effort, or a complete transformation with a cloud-first database.

Google Cloud offers a suite of managed database services that support open source, third-party, and cloud-first database engines. At Next 2022, we published five new videos specifically for Oracle and SQL Server customers looking to either lift-and-shift to the cloud or fully free themselves from licensing and other restrictions. We hope you’ll find the videos useful in thinking through your options, whether you’re leaning towards a homogeneous migration (using the same database you have today) or a heterogeneous migration (switching to a different database engine).

Let’s dive into our five new videos.

#1 Running Oracle-based applications on Google Cloud

By Jagdeep Singh & Andy Colvin

Moving to the cloud may be difficult if your business depends on applications running on an Oracle Database. Some applications may have dependencies on Oracle for reasons such as compatibility, licensing, and management. Learn about several solutions from Google Cloud, including Bare Metal Solution for Oracle, a hardware solution certified and optimized for Oracle workloads, and solutions from cloud partners such as VMware and Equinix. See how you can run legacy workloads on Oracle while adopting modern cloud technologies for newer workloads.

#2 Running SQL Server-based applications on Google Cloud

By Isabella Lubin

Microsoft SQL Server remains a popular commercial database engine. Learn how to run SQL Server reliably and securely with Cloud SQL, a fully-managed database service for running MySQL, PostgreSQL and SQL Server workloads. In fact, Cloud SQL is trusted by some of the world’s largest enterprises with more than 90% of the top 100 Google Cloud customers using Cloud SQL. We’ll explore how to select the right database instance, how to migrate your database, how to work with standard SQL Server tools, and how to monitor your database and keep it up to date.

#3 Choosing a PostgreSQL database on Google Cloud

By Mohsin Imam

PostgreSQL is an industry-leading relational database widely admired for its permissive open source licensing, rich functionality, proven track record in the enterprise, and strong community of developers and tools. Google Cloud offers three fully-managed databases for PostgreSQL users: Cloud SQL, an easy-to-use fully-managed database service for open source PostgreSQL; AlloyDB, a PostgreSQL-compatible database service for applications that require an additional level of scalability, availability, and performance; and Cloud Spanner, a cloud-first database with unlimited global scale, 99.999% availability and a PostgreSQL interface. Learn which one is right for your application, how to migrate your database to the cloud, and how to get started.

#4 How to migrate and modernize your applications with Google Cloud databases

By Sandeep Brahmarouthu

Migrating your applications and databases to the cloud isn’t always easy. While simple workloads may just require a simple database lift-and-shift, custom enterprise applications may benefit from more complete modernization and transformation efforts. Learn about the managed database services available from Google Cloud, our approach to phased modernization, the database migration framework and programs that we offer, and how we can help you get started with a risk-free assessment.

#5 Getting started with Database Migration Service

By Shachar Guz & Inna Weiner

Migrating your databases to the cloud becomes very attractive as the cost of maintaining legacy databases increases. Google Cloud can help with your journey whether it’s a simple lift-and-shift, a database modernization to a modern, open source-based alternative, or a complete application transformation. Learn how Database Migration Service simplifies your migration with a serverless, secure platform that utilizes native replication for higher fidelity and greater reliability. See how database migration can be less complex, time-consuming and risky, and how to start your migration often in less than an hour.

We can’t wait to partner with you

Whichever path you take in your cloud journey, you’ll find that Google Cloud databases are scalable, reliable, secure and open. We’re looking forward to creating a new home for your Oracle- and SQL Server-based applications.

Start your journey with a Cloud SQL or Spanner free trial, and accelerate your move to Google Cloud with the Database Migration Program.

Related Article

What’s new in Google Cloud databases: More unified. More open. More intelligent.

Google Cloud databases deliver an integrated experience, support legacy migrations, leverage AI and ML and provide developers world class…

Read Article

Source : Data Analytics Read More

How The FA is moving the goal posts with a data cloud approach in Qatar

How The FA is moving the goal posts with a data cloud approach in Qatar

We’re moments away from the kick-off of another historic tournament. After the England men’s football team reached the Euro 2020 final in last year’s pandemic-delayed competition, there is genuine confidence in a successful run in Qatar.

The Football Association (The FA) is the governing body of association football in England, and has left no stone unturned in its preparations; they have increasingly looked to physical performance data as a way to help support players on the pitch. Maintaining accurate and insightful information on fitness, conditioning, and nutrition also helps ensure player welfare – something that gets more important with every fixture in a tournament environment.

The need for improved understanding of how players are faring was the reason The FA set up the Performance Insights strand of its Physical Performance, Medicine, and Nutrition department during lockdown in 2020. And they used Google Cloud to help them revolutionize the way they capture, store, and process information.

A single 90-minute squad training session can generate millions of rows of data. In football, things change so quickly that this data begins to lose relevance as soon as the players are back in the dressing room. That’s why The FA needed a solution which could turn raw data into valuable, easy-to-understand insights. This led the team to BigQuery, Google Cloud’s data warehouse solution.

BigQuery enables The FA’s Performance Insights team to automate previously labor-intensive tasks, and for all the information to be stored in a single, centralized platform for the first time. By collating different data sources across The FA’s squads, there can be greater clarity and fewer siloes – everyone is working towards the same goals. 

 A unique solution for a unique tournament

Access to insights is vital in any tournament situation, but this year there is a need for speed like never before. 

Unlike previous tournaments, Qatar will start in the middle of domestic league seasons throughout the world. Traditionally, international sides are able to meet up for nearly a month between the end of the league season and the start of the tournament – a critical time to work on all aspects of team preparation, including tactics and conditioning. By contrast, this year the England players will have less than a week to train together before the first kick-off.

BigQuery allows The FA’s data scientists to combine data on many aspects of a player’s physical performance captured during a training camp, from intensity to recovery. This can enable more useful conversations on the ground and can help create more individualized player management. And by using BigQuery’s user-defined customisable functions, the same data can be tweaked and tailored to fit the needs across departments. 

This customizability provides a foundation for a truly ‘interdisciplinary’ team in which doctors, strength and conditioners, physios, psychologists, and nutritionists have a common understanding of the support a player needs.

Every minute will count during such a compressed training window, so automation is key. While BigQuery is the core product The FA uses to store and manipulate data, it’s just one part of a suite of Google Cloud products and APIs that help them easily turn data into insights. 

In-game and training performance data, along with data pertaining to players’ sleep, nutrition, recovery, and mental health can be captured and fed through Python, which links straight into BigQuery using its Pub/Sub functionality. BigQuery’s native connectors then stream insights to visual dashboards that convey them in a meaningful, tangible format.  

Before leveraging the power of Google Cloud, this work could take several hours each day. Now, it can take a minute from data capture to the coaches having access to clear and actionable information. 

Predicting a bright future for the Beautiful Game

We won’t have long to wait to see how England will perform in Qatar. But the benefits of The FA’s cloud-enabled approach to data science will continue long after the final whistle has blown.

The short preparation window has posed challenges for The FA, but it has also given the organization a unique opportunity to discover how predictive analytics and machine learning on Google Cloud could further enhance its player performance strategy. 

The Physical Performance, Medicine, and Nutrition department has collected performance data from players throughout this year’s league season, taking into account fixture density and expected physical demand. They hope to use this to support the players’ physical preparation and recovery during the tournament based on individual physical performance profiles.

This ML work is still in the early stages. But the Performance Insights team is confident that by developing even closer relationships with Google Cloud and even greater familiarity with its technology, they will be able to unlock an even greater level of insight into player performance.

Learn more about how Google Cloud can turn raw data into actionable insights, fast.

Source : Data Analytics Read More