A Knowledge Graph ingests data from multiple sources, extracts entities (e.g., people, organizations, places, or things), and establishes relationships among the entities (e.g., owner of, related to) with the help of common attributes such as surnames, addresses, and IDs.
Entities form the nodes in the graph and the relationships are the edges or connections. This graph building is a valuable step for data analysts and software developers for establishing entity linking and data validation.
The term “Knowledge Graph” was first introduced by Google in 2012 as part of a new Search feature to provide users with answer summaries based on previously collected data from other top results and sources.
Advantages of a Knowledge Graph
Building a Knowledge Graph for your data has multiple benefits:
Clustering text together that is identified as one single entity like “Da Vinci,” “Leonardo Da Vinci,” “L Da Vinci,” “Leonardo di ser Piero da Vinci,” etc.
Attaching attributes and relationships to this particular entity, such as “painter of the Mona Lisa.”
Grouping entities based on similarities, e.g., grouping Da Vinci with Michelangelo because both are famous artists from the late 15th century.
It also provides a single source of truth that helps users discover hidden patterns and connections between entities. These linkages would have been more challenging and computationally intensive to identify using traditional relational databases.
Knowledge Graphs are widely deployed for various use cases, including but not limited to:
Supply chain: mapping out suppliers, product parts, shipping, etc.
Lending: connecting real estate agents, borrowers, insurers, etc.
Know your customer: anti-money laundering, identity verification, etc.
Deploying on Google Cloud
Google Cloud has introduced two new services (both in Preview as of today):
To illustrate the new solutions, let’s explore how to build a private knowledge graph using the Entity Reconciliation API and use the generated ID to query the Google Knowledge Graph Search API. We’ll use the sample data from zoominfo.com for retail companies available on Google Cloud Marketplace (link 1, link 2).
To start, enable the Enterprise Knowledge Graph API and then navigate to the Enterprise Knowledge Graph from the Google Cloud console.
The Entity Reconciliation API can reconcile tabular records of organization, local business, and person entities in just a few clicks.Three simple steps are involved:
Identify the data sources in BigQuery that need to be reconciled and create a schema mapping file for each source.
Configure and kick off a Reconciliation job through our console or API.
Review the results after job completion.
Step 1
For each job and data source, create a schema mapping file to inform how Enterprise Knowledge Graph ingests the data and maps to a common ontology using schema.org. This mapping file will be stored in a bucket in Google Cloud Storage.
For the purposes of this demo, I am choosing the organization entity type and passing in the database schema that I have for my BigQuery table. Note to always use the latest from our documentation.
The console page shows the list of existing entity reconciliation jobs available in the project.
Create a new job by clicking on the “Run A Job” button in the action bar, then select an entity type for entity reconciliation.
Add one or more BigQuery data sources and specify a BigQuery dataset destination where EKG will create new tables with unique names under the destination data set. To keep the generated cluster IDs constant across different runs, advanced settings like “previous BigQuery result table” are available.
Click “DONE” to create the job.
Step 3
After the job completes, navigate to the output BigQuery table, then use a simple join query similar to the one below to review the output:
code_block[StructValue([(u’code’, u’SELECT *rnFROM `<dataset>.clusters_14002307131693260818` as RS join `<dataset>.retail_companies` as SRCrnon RS.source_key = SRC.COMPANY_IDrnorder by cluster_id;’), (u’language’, u”), (u’caption’, <wagtail.wagtailcore.rich_text.RichText object at 0x3ec31d77fdd0>)])]
This query joins the output table with the input table(s) of our Entity Reconciliation API and orders by cluster ID. Upon investigation, we can see that two entities are grouped into one cluster.
The confidence score indicates how likely it is that these entities belong to this group. Last but not least, the cloud_kg_mid column returns the linked Google Cloud Knowledge Graph machine ID, which can be used for our Google Knowledge Graph Search API.
Running the above cURL command will return response that contains a list of entities, presented in JSON-LD format and compatible with schema.org schemas with limited external extensions.
For more information, kindly visit our documentation.
Special thanks to Lewis Liu, Product Manager and Holt Skinner, Developer Advocate for the valuable feedback on this content.
We are increasingly seeing one question arise in virtually every customer conversation: How can the organization save costs and drive new revenue streams?
Everyone would love a crystal ball, but what you may not realize is that you already have one. It’s in your data. By leveraging Data Cloud and AI solutions, you can put your data to work to achieve your financial objectives. Combining your data and AI reveals opportunities for your business to reduce expenses and increase profitability, which is especially valuable in an uncertain economy.
Google Cloud customers globally are succeeding in this effort, across industries and geographies. They are improving efficiency and ROI by saving money and creating new revenue streams. We have distilled the strategies and actions they are implementing—along with customer examples and tips—in our eBook, “Make Data Work for You.” In it, you’ll find ways you can pare costs, increase profitability, and monetize your data.
Find money in your data
Our Google Cloud teams have identified eight strategies that successful organizations are pursuing to trim expenses and uncover new sources of revenue through intelligent use of data and AI. These use cases range from scaling small efficiencies in logistics to accelerating document-based workflows, monetizing data, and optimizing marketing spend.
The results are impressive. They include massive cost savings and additional revenue. On-time deliveries have increased sharply at one company, and procure-to-pay processing costs have fallen by more than half at another. Other organizations have reaped big gains in ecommerce upselling and customer satisfaction.
We’ve found that businesses across every industry and around the globe are able to take action on at least one of these eight strategies. Contrary to common misperceptions, implementation does not require massive technology changes, crippling disruption to your business, or burdensome new investments.
What success looks like
If you worry your business is not ready or you need to gain buy-in from leadership, the success stories of the 15 companies in this report are helpful examples. Learning how organizations big and small, in different industries and parts of the world, have implemented these data and AI strategies makes the opportunities more tangible.
Carrefour Among the world’s largest retailers, Carrefour operates supermarkets, ecommerce, and other store formats in more than 30 countries. To retain leadership in its markets, the company wanted to strengthen its omnichannel experience.
Carrefour moved to Google Data Cloud and developed a platform that gives its data scientists secure, structured access to a massive volume of data in minutes. This paved the way for smarter models of customer behavior and enabled a personalized recommendation engine for ecommerce services.
The company saw a 60% increase in ecommerce revenue during the pandemic, which it partly attributes to this personalization.
ATB Financial ATB Financial, a bank in the Canadian province of Alberta, uses its data and AI to provide real-time personalized customer service, generating more than 20,000 AI-assisted conversations monthly. Machine learning models enable agents to offer clients real-time tailored advice and product suggestions.
Moreover, marketing campaigns and month-end processes that used to take five to eight hours now run in seconds, saving over CA$2.24 million a year.
Bank BRI Bank BRI, which is owned by the Indonesian government, has 75.5 million clients. Through its use of digital technologies, the institution amasses a lot of valuable data about this large customer base.
Using Google Cloud, the bank packages this data through more than 50 monetized open APIs for more than 70 ecosystem partners who use it for credit scoring, risk management, and other applications. Fintechs, insurance companies, and financial institutions don’t have the talent or the financial resources to do quality credit scoring and fraud detection on their own, so they are turning to Bank BRI.
Early in the effort, the project generated an additional $50 million in revenue, showing how data can drive new sources of income.
How to get going now
“Make Data Work for You” will help you launch your financial resiliency initiatives by outlining the steps to get going. The process lays the groundwork for realizing your own cost savings and new revenue streams by leveraging data and AI.
Among these steps include building frameworks to operate cost efficiently, make informed decisions related to spending and optimize your data and AI budgets.
Operate: Billing that’s specific to your use-case Control your costs by choosing data and analytics vendors who offer industry-leading data storage solutions and flexible pricing options. For example, multiple pricing options such as flat rate and pay-as-you-go allow you to optimize your spend for best price-performance.
Inform: make informed decisions based on usage Use your cloud vendor’s dashboards or build a billing data report to gain insights on your spending over time. Make use of cost recommendations and other forecasting tools to predict what your future expenses are going to be.
Optimize: Never pay more than you use While planning data analytics capacity, organizations often overprovision and overpay than what they actually use. Consider migrating your workloads that have unpredictable demand to a data warehousing solution that offers granular level autoscaling features so that you never have to pay for more than what you use.
There are other key moves that will set your initiative up for success including how to shorten time to value in building AI models and measuring impact. You can find details in the report.
A brighter future
The teams at Google Cloud helped the companies in “Make Data Work for You,” along with many more organizations, use their data and AI to achieve meaningful results. Download the full report to see how you can too.
E-commerce transformation has moved at an astounding pace over the last decade. Retailers of all sizes have grappled with immense changes, as new technologies reinvent what’s possible and what consumers have come to expect from the shopping experience.
Retailers that embrace evolving shopper expectations by putting customers at the center of everything they do are finding countless opportunities to thrive.
At Quantum Metric, we help businesses solve many problems, but virtually all of them involve understanding customers through better data visibility and analytics, and then acting on those insights.
Canadian Tire Corporation (CTC), one of Canada’s oldest and largest retailers, is an exciting example of what we have been able to accomplish through our independent software vendor (ISV) partnership with Google Cloud. Since 2018, we have worked with Google Cloud to help CTC build and optimize the digital journey of its Triangle loyalty program, which boasts 11 million active members across the country.
Now, we would like to share how our partnership with Google Cloud helped CTC achieve a 15% omnichannel sales increase by tailoring digital customer experiences.
Why Canadian Tire is a retail leader in Canada
CTC is one of Canada’s biggest retailers, with over 1,700 retail and gas outlets, alongside 13 businesses and brands, including Canadian Tire Retail, Mark’s, Sport Chek, FGL Sports, and Partsource. In 2022, Canadian Tire celebrated 100 years in business and continued to offer a wide assortment of goods that appeal to Canadians, 90% of whom live within 15 minutes of a retail location.
Even with such an extensive catalog of brands and products, Canadian Tire has always been extremely focused on customers, tailoring many of its business processes to fit the needs, demands, and preferences of the people and communities it serves.
This is why the company recognized the need to leverage the cloud to harmonize increasing digital customer and offline data sources in real-time and offer customers the e-commerce experience they expect.
Around this time, we began to work with CTC to enable the retailer to more efficiently identify customer pain points, quantify their impact and prioritize action.
CTC was facing common problems in their digital properties, such as difficulties with adding items to the cart, API failures during checkout, and scripts conflicting with each other on certain device and browser combinations, resulting in lower conversion rates and NPS scores.
However, with the implementation of BigQuery and Quantum Metric’s advanced data capture technology, CTC was able to automate and expedite identification and resolution of issues affecting customer experience. This allowed for quicker resolution of problems, resulting in improved conversion rates and NPS scores.
To stay ahead of ongoing digital challenges, we now analyze insights fromover 65 million sessions a month across all of CTC’s brands. That’s over 1 terabyte of data every month! This data from customer interactions is then reformatted into behavioral dashboards or individual session replays of the customer’s experience to help CTC teams easily understand the information. We accomplish this by using our patented DOM reconstruction technology to take data and translate it with a focus on security and performance. The result is a 360-view into customer digital activities that enable the Canadian Tire team to fully understand what customers experience on the digital path.
Through the Quantum Metric platform, CTC can quickly identify and address issues impacting customers, ranging from shopping cart checkout problems and promo code issues to slow-loading pages.
Leveraging the power of Google Cloud in retail
Quantum Metric is proud to be built on, and partner with, Google Cloud. By capturing 100% of digital customer interactions even on the busiest days, massive brands like Canadian Tire have complete visibility year-round. This is incredibly important because it allows us to not just fix problems, but also use the full breadth of data to make decisions.
Our use of BigQuery and integration with Google Cloud lets us move away from vague details about customers, engagement averages, and overly broad analytics to uncover exact figures that highlight individual interactions. This was especially beneficial for CTC when the COVID-19 pandemic struck.
When stores shut down, Canadian Tire saw a drop off in its loyalty program engagement because people were not going to stores and did not have an intuitive way to add their loyalty information on websites and apps. Thanks to the power of BigQuery and Quantum Metric’s platform, we helped CTC understand the issue on a granular level.
Responding to what the data told us, we delivered a new feature that gave customers the flexibility to add their loyalty information at any touchpoint. Once the initial feature was released, Canadian Tire used our session replays and UX analytics to understand customers better and quickly tweak them for greater engagement.
CTC took an iterative approach to improve the feature and, before long, saw a 72% increase in the number of people adding their loyalty information. Rather than seeing engagement drop during an extremely difficult time, Canadian Tire was able to expand its loyalty program with the help of personalization and a customer-centric design approach.
At the end of the day, Quantum Metric’s integration with BigQuery enables Canadian Tire to respond to customer needs, demands, and preferences faster and smarter. Canadian Tire also takes advantage of our unique ability to offer ungated access to all its data in Google BigQuery, as it merges data sets from Google Analytics, transactional information, and Quantum Metric itself.
Quantum Metric got started through the Google Cloud for Startups program and ultimately ended up building highly integrated tools that work seamlessly with BigQuery. We’re capturing petabyte-scale data and allowing companies of all sizes to quickly manage and understand their data, take action, and ultimately drive better experiences and higher sales.
Learn more about how Google Cloud partners can help your business solve its challenges here.
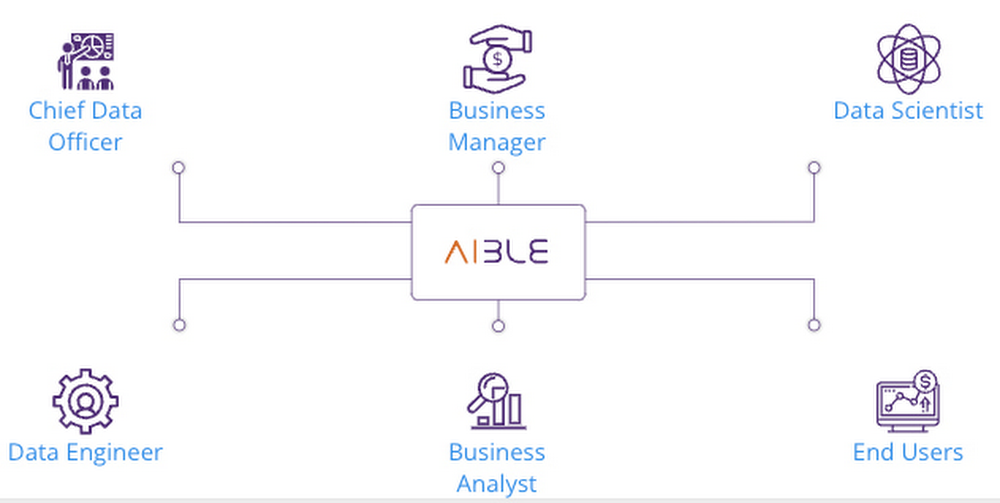
Aible is the leader in generating business impact from AI in less than 30 days by helping teams go from raw data to business value with solutions for customer acquisition, churn prevention, demand prediction, preventative maintenance, and more. These solutions help IT and data teams identify valuable data through automated data validation, enabling collaborative open-world exploration of data, and deliver AI recommendations in enterprise applications to help teams achieve business goals while considering unique business circumstances such as marketing budgets and changing market conditions.
For example, if a sales optimization model would require a 10% increase in sales resources for optimal revenue/profit outcome, the user can specify whether or not such a resource shift is possible, and Aible would choose the best predictive model and threshold level across thousands of model-hyperparameter combinations of models autotrained by Aible to satisfy the business needs. Thus, Aible combines business optimization and machine learning by saving off the hyperparameter-model search space and then searching for the optimal model settings given the users business goals and constraints.
As economic conditions change, many companies shift their data warehouse use cases away from standard subscription models that procure static/fixed-size infrastructure configurations, regardless of the actual utilization or demand rate. However, the paradigm breaks down for most organizations the moment they want to analyze or build predictive models based on the data in the data warehouse – all of a sudden, data scientists start bringing up server clusters that they keep running for six to nine months during the duration of the analytics or data science project because most data science and analytics platforms are not serverless today and accrue expenses if they are “always on.”
Aible’s Value Proposition (Ease of use, automation and faster ROI) powered by BigQuery’s serverless architecture
Serverless architectures overcome unnecessary server uptime and allow for significant cost efficiencies. Instead of needing to keep servers running for the duration of analytics and data science & machine learning projects, serverless approaches let the users interact with the system in a highly responsive manner using metadata and browsers while ramping up compute resources for short lengths of time – when absolutely necessary. A serverless, fully managed enterprise data warehouse like BigQuery can save state until the next invocation or access is required and also provides beneficial security and scalability characteristics.
Aible leverages Google Cloud to bring serverless architecture and a unique augmented approach to most analytics and data science use cases across user types while realizing significant cost efficiencies. Aible realized a simple fact – in the time a human can ask a handful of questions, an AI can ask millions of questions and save off the answers as metadata. Then, if you had a truly serverless end-to-end system, users could get their questions answered without hitting the server with the raw data again.
For example, one user may create a dashboard focused on sales channels, while another user may analyze geographical patterns of sales, and a third user might benchmark different salespeople’s performance; but all of these could be done based on manipulating the metadata. Aible’s end-to-end serverless user interface runs directly in the user’s browser and accesses saved off metadata in the customer’s cloud account.
The big question was whether the cost was indeed lower if the AI asked a million questions all at once? In January 2023, Google and Aible worked with a joint Fortune 500 customer to test out this architecture. The test was run using Aible on BigQuery without any special optimizations. The customer had sole discretion over what datasets they used. The results were outstanding. Over two weeks, more than 75 datasets of various sizes were evaluated. The total number of rows exceeded 100 million, and the total number of questions answered and then saved off was over 150 million. The total cost across all that evaluation was just $80.
At this customer, traditional analytics and data science projects typically take about four months to complete. Based on their typical completion time, they estimated that it would have cost more than $200,000 in server and associated costs to conduct these 75 projects. As shown in the table above, the AI-first end-to-end serverless approach was more than 1,000 times efficient compared to traditional servers.
The following diagram shows exactly why the combined Aible and Google, AI-first end-to-end serverless environment was so efficient. Note that because Aible could run the actual queries serverless on BigQuery, it was able to analyze any size data on a truly end-to-end serverless environment. Aible, supports AWS and Azure as well. The architecture would work exactly the same way using Lambdas and Function Apps for small and medium sized datasets. But, for larger datasets on AWS and Azure, Aible today brings up Spark and at that point the efficiency of the system drops significantly compared to the end-to-end serverless capabilities offered on Google Cloud.
As shown in the example below, a typical data analysis project may run for six months, requiring 4,320 hours of server time, Aible may actively conduct ‘analysis’ activities for just six hours during the entire project. That translates to a 720-times reduction in server time. But, Aible’s serverless analysis is also three times more cost-effective than the same analysis on comparable servers, according to this benchmark by Intel and Aible.
When Aible needs to evaluate, transform, analyze data, or create predictive models, it pushes the relevant queries to the customer-owned BigQuery datasets or BigQueryML models, as appropriate. It then saves the relevant metadata (including analysis results and models) in the customer’s own private Google Cloud project in Cloud Storage or BigQuery as appropriate. Whenever a user interacts with the analysis results or models, all of the work is done in their browsers, and the metadata is securely accessed as necessary. Aible never gets access to the customer’s data, which remains securely in the customer’s own private Google Cloud project.
Aible built on Google Cloud Platform services
1. Aible Sense
Aible Sense starts you on the data journey and helps you go from overwhelming data to valuable data. With no upfront effort, Aible Sense completely automates the data engineering and data science tasks to ensure a dataset is of sufficient quality (running tests like outlier detection, inclusion probabilities, SHAP values, etc.) to generate statistically valid insights, high-impact predictive models, and high-value data warehouses.
The image below depicts the Aible Sense architecture deployed on Google Cloud. Aible is pushing the analysis workload to BigQuery, BigQueryML, and Vertex AI as appropriate to do the feature creation and tests described above:
2. Aible Explore
Aible Explore enables your team to brainstorm with their data. Open world exploration reveals new paths for discovery and helps to identify patterns and relationships among variables. With guided data exploration and augmented analytics, Aible Explore helps business users visually understand business drivers, uncover root causes, and identify contextual insights in minutes. Aible exports dynamic Looker dashboards with a single click, creates the necessary LookML, which is the language needed to build the semantic model, and points to the underlying data in BigQuery. Aible enables rapid deployment of Looker dashboards on BQ data by generating the necessary LookML code without the need for further user intervention thus drastically reducing the cycle time.
The image below depicts the Aible Explore architecture deployed on Google Cloud. Because BigQuery scales exceptionally well for large and complex data, by pushing the queries to BQ, Aible was finally able to enable analysis on any size data without resorting to bringing up spark clusters:
3. Aible Optimize
Aible Optimize considers your unique benefit of correct predictions and cost of incorrect predictions, and business constraints such as marketing budget limits that may prevent you from acting upon every AI recommendation. It then shows you exactly how the AI recommendations would impact your business given such business realities. The optimal predictive model is automatically deployed as a serverless (CloudRun) restful endpoint that can be consumed from enterprise applications or systems such as Looker and Salesforce.
The image below depicts the Aible Optimize architecture deployed on Google Cloud. With regard to training models, because BigQueryML and VertexAI scale exceptionally well for large and complex datasets, by leveraging this underlying technology Aible was finally able to enable the training of predictive models on any size data without having to resort to bringing up spark clusters and at the same time adding extra levels of resilience beyond the ones provided by the spark framework.
The proof is in the pudding – Overstock’s customer journey:
Overstock.com used Aible to improve speed to data-quality evaluation from weeks to minutes per dataset. The entire Aible project took just 5 days, including installation and integration with Overstock’s BigQuery to Executive review and acceptance of results.
Joel Weight, Overstock.com’s CTO wrote, “We extensively use Google BigQuery. Aible’s seamless integration with BigQuery allowed us to analyze datasets with a single click, and in a matter of minutes automatically get to a dynamic dashboard showing us the key insights we need to see. This would have taken weeks of work using our current best practices. When we can analyze data in minutes, we can get fresh insights instantly as market conditions and customer behavior changes.”
Joel’s comment points to a far more valuable reason to use Aible – beyond massive analysis cost reduction. In rapidly changing markets, the most actionable patterns will be the ‘unknown unknowns.’ Of course, dashboards can be quickly refreshed with new data, but they still ask the same data questions as they always have. What about new insights hidden in the data? The questions we have yet to think to ask? The traditional manual analysis would take weeks or months to detect such insights, and even then, they can’t ask all possible questions. Aible on BigQuery can ask millions of questions and present the key insights in the order of how the insights affect business KPI such as revenue, costs, etc. And it can do so in minutes. This completely changes the art of the possible of who can conduct analysis and how quickly it can generate results.
Aible natively leverages Google BigQuery, part of Google’s data cloud, to parallelize these data evaluations, data transformations, explorations, and model training, across virtually unlimited resources. Aible seamlessly analyzes data from various sources by securely replicating the data in the customer’s own BigQuery dataset. Aible also seamlessly generates native Looker dashboards on top of data staged in BigQuery (including data from other sources that Aible automatically stages in BigQuery), automatically taking care of all necessary steps, including custom LookML generation.
Conclusion
Google’s data cloud provides a complete platform for building data-driven applications from simplified data ingestion, processing, and storage to powerful analytics, AI, ML, and data sharing capabilities — all integrated with the open, secure, and sustainable Google Cloud platform. With a diverse partner ecosystem, open-source tools, and APIs, Google Cloud can provide technology companies the portability and differentiators they need.
To learn more about Aible on Google Cloud, visit Aible.com.
Click here to learn more about Google Cloud’s Built with BigQuery initiative.
We thank the Google Cloud team member who contributed to the blog: Christian Williams, Principal Architect, Cloud Partner Engineering
Editor’s note: This is the second blog in Meet the Google Cloud Data Champions, a series celebrating the people behind data and AI-driven transformations. Each blog features a champion’s career journey, lessons learned, advice they would give other leaders, and more. This story features Emily Bobis, Co-Founder of Compass IoT, an award-winning Australian road intelligence company that uses connected vehicle data to improve road safety, infrastructure and city planning. Read more about Compass IoT’s work.
Tell us about yourself. Where did you grow up? What did your journey into tech look like?
My journey into tech was unintentional — I always had a perception about the type of people that worked in tech, and I wasn’t “it.” I was in the last year of my undergrad degree at the University of Sydney and I applied for a scholarship for a short-term exchange in Singapore. Turns out, there were four scholarships available and I was one of only four people who applied so I got the scholarship entirely based on luck. On that trip is where I met my co-founder, Angus McDonald.
I worked with Angus on his first startup, a bike sharing service called Airbike. This was my first experience in tech-enabled mobility. Airbike exposed a big data gap in smart cities — how could we design better and safer cities that reflect the way people actually move around them? This problem became the foundation of why we started Compass IoT.
Which leaders and/or companies have inspired you along your career journey?
We’re very fortunate in Sydney to have a startup ecosystem that is full of founders that genuinely want to help each other succeed. Alex Carpenter who runs the Guild of Entrepreneurs online community and Murray Hurps who spearheads University of Technology Sydney startups are two of the most generous and kind people you could ask for to represent the space.
It might sound odd, but my Taekwondo instructor, Alan Lau, also deserves some recognition. The skills I’ve learnt during my training with Alan — resilience, perseverance, and integrating constant feedback to improve — are skills that directly translate into me being a better entrepreneur. Something people don’t know about me is that I’m a black belt in Taekwondo! 2023 will be my 13th year of training.
Why was having a data/AI strategy important in developing your company, Compass IoT?
Managing data on a large scale can become very expensive and messy. A long-term strategy helps to build products that scale, without huge increases in complexity, cost, or compromising the quality of the product you’re delivering. In the case of Compass, having a strategy and using globally scalable tools from Google Cloud such as BigQuery, Pub/Sub, Cloud Run, and Google Kubernetes Engine enabled us to grow without impacting our data latency and end-user experience.
What’s the coolest thing you and/or your team has accomplished by leveraging data/AI?
We’re incredibly lucky that our customers are great people that jump at opportunities to apply data-driven problem-solving, so it’s difficult to narrow down to a single project. The coolest thing is seeing all the different applications of connected vehicle data across everything from understanding freight routes, improving road safety, to helping local governments prioritize road maintenance and repair after severe flooding.
One of the coolest things was seeing our data used to halve crashes on one of Sydney’s busiest roads, and reduce rear-end crashes on a highway offramp simply by changing how long drivers had to wait at the traffic lights — read the full case study. We ingest billions of data points across Australia every day; Pub/Sub is critical to our ability to deliver near real-time results to our customers with incredibly low latency. Google Cloud’s data processing capabilities makes it possible to monitor changes on a road network where the lives and safety of drivers could be at stake. Road accidents are one of the biggest killers of young Australians under the age of 24, so it’s awesome to know that our technology is being used to proactively save the lives of some of the most vulnerable road users.
What was the best advice you received as you were starting your data/AI journey?
I always refer to one piece of advice that we received from a mentor and friend Brad Deveson: When in doubt, do something. It’s so easy to become overwhelmed and hyper focused on making the ‘right’ decision and avoiding failure, that you don’t make any decision at all. If you’re not sure what decision to make, doing something is better than doing nothing. And if you make a mistake? Take a page out of Ross Geller’s book and pivot.
What’s an important lesson you learned along the way to becoming more data/AI driven? Were there challenges you had to overcome?
The most important lesson I’ve learned, particularly in a data-driven and relatively new industry, is that innovation does not equal acceptance. There is no guarantee your intended customers will be chasing you down for your product or service, or even know that you exist. It is incredibly important to invest a lot of time, patience, and empathy into education and upskilling your customers. Your customers are the main character of your brand story and you are the guide that helps them succeed, not the other way around.
One of the biggest challenges for non-technical founders of a tech company to overcome is to understand realistic timeframes for development tasks and then managing the expectations of your customers accordingly. Being able to communicate why timelines need to be certain lengths is crucial for delivering high-quality results while keeping both your team and your customers happy. Having a development team who you can trust is essential here.
Want to learn more about the latest innovations in Google Data Cloud for databases, data analytics, business intelligence, and AI? Join us at the Google Data Cloud & AI Summit to gain expert insights and data strategies.
Leverege is a software company that enables market leaders around the globe to quickly and cost effectively build enterprise IoT applications to provide data-centric decision capability, optimize operations, improve customer experience, deliver customer value, and increase revenue. Leverege’s premier SaaS product, the Leverege IoT Stack, runs natively on Google Cloud and seamlessly integrates with Google’s vast array of AI/ML products.
Leverege uses BigQuery as a key component of its data and analytics pipeline to deliver innovative IoT solutions at scale. BigQuery provides an ideal foundation for IoT systems with its data warehousing capabilities, out-of-the-box data management features, real-time analytics, cross cloud data integration, and security and compliance standards. These features enable customers to easily integrate data processes and use the resulting datasets to identify trends and apply insights into operations.
Context and IoT industry background
The Internet of Things (IoT) connects sensors, machines, and devices to the internet, allowing businesses in every industry to move data from the physical world to the digital world, on the edge and in the cloud. The adoption of large-scale IoT solutions gives businesses the data they need to improve efficiency, reduce costs, increase revenue, and drive innovation.
The power of IoT solutions, and their impact on the global economy, are driving demand for robust and secure enterprise data warehouse capabilities. IoT presents a particular challenge on the infrastructure level because many technical requirements at scale cannot be predicted in advance. Some customers need to manage massive IoT datasets while others require real-time data streaming or fine-grained access controls.
The breadth of infrastructure requirements in the IoT space means Leverege depends on partnering with a best-in-class cloud computing provider. On the technical side, a full-featured data warehouse is required to meet customer needs and bring them to scale. On the financial side, the end-to-end solution must be designed to manage and reduce overall costs, accounting for each of the solution’s components (hardware, connectivity, infrastructure, and software).
By leveraging the scalability and flexibility of Google Cloud Platform and BigQuery, Leverege’s customers can affordably store, process, and analyze data from millions of connected devices and extract the value they need from sensor data.
Introduction to Leverege using Google Cloud
Leverege offers a customizable multi-layer IoT stack to help organizations quickly and easily build and deploy IoT solutions that provide measurable business value. The Leverege IoT Stack consists of three components:
Leverege Connect is focused on device management, enabling the secure provisioning, connection and management of distributed IoT devices. Leverege Connect serves as a replacement for Google IoT Core which will be retired in August 2023 and supports protocols such as MQTT, HTTP, UDP, and CoAP.
Leverege Architect is focused on data management, enabling the ingestion, organization, and contextualization of device and business data with the ability to apply AI/ML for powerful insights and/or expose via APIs to external services.
Leverege Build optimizes application development, enabling the generation, configuration, and branding of end-user applications with tailored experiences on a per-role basis; all with no-code tooling.
Leverege IoT Stack is deployed with Google Kubernetes Engine (GKE), a fully managed kubernetes service for managing collections of microservices. Leverege uses Google Cloud Pub/Sub, a fully managed service, as the primary means of message routing for data ingestion, and Google Firebase for real-time data and user interface hosting. For long-term data storage, historical querying and analysis, and real-time insights , Leverege relies on BigQuery.
Leveraging BigQuery to deliver and manage IoT solutions at scale
Use case #1: Automating vehicle auctions for the world’s largest automobile wholesaler
The world’s leading used vehicle marketplace faced the costly challenge of efficiently orchestrating and executing simultaneous in-person and online car auctions on parking lots up to 600 acres in size. Before the IoT solution was deployed, manually staging thousands of vehicles each day involved hundreds of people finding specific vehicles based on hard-to-discover information and attempting to arrange them in precise order. This manual process was highly inefficient, unreliable, and negatively impacted the customer experience since vehicles routinely missed the auction or were out of sequence.
To solve the problem, the customer built low-cost, long battery life GPS trackers and placed them inside all of the vehicles on the lot. Leverege integrated the devices into a holistic end-to-end solution, providing full awareness and visibility into precise car location, diagnostics, automated querying, analysis reports, and movement with walking directions to vehicles of interest. This digital transformation saved the customer millions of dollars a year while simultaneously increasing customer satisfaction by a significant amount.
After the solution scaled nationwide, monitoring the health of the devices and system was paramount for operational success. BigQuery data partitioning and autonomous analysis jobs allowed for a cost effective way to manage and segment system alerts and reports of overall system health using very large datasets.
Use case #2: Analyzing the state and readiness of boats anywhere in the world in real-time
Working with the largest boat engine manufacturer in the world, Leverege delivered an IoT solution providing boat owners and fleet managers with real-time, 24/7 access to the state, readiness, and location of their boats around the globe.
Seamlessly and reliably providing real-time marine data to boat owners requires technical integration across hardware, software, and connectivity, a problem uniquely suited for an IoT solution. The customer’s “Connected Boat” product reports a high volume of disparate data including the status of every electrical, mechanical, and engine subsystem. Some of this data is only important historically when incidents and issues arise and boat owners need to investigate.
BigQuery allows Leverege to record the full volume of historical data at a low storage cost, while only paying to access small segments of data on-demand using table partitioning.
For each of these examples, historical analysis using BigQuery can help identify pain points and improve operational efficiencies. They can also do so with both public datasets and private datasets. This means an auto wholesaler can expose data for specific vehicles, but not the entire dataset (i.e., no API queries). Likewise, a boat engine manufacturer can make subsets of data available to different end users.
Leverege IoT Stack reference architecture: Integrating components to deliver robust, scalable, and secure solutions
The Leverege IoT Stack is built on top of Google Cloud’s infrastructure, making use of several core components that work together to deliver a robust, scalable, and secure solution. These components include:
GKE: Leverege uses GKE to deploy a collection of microservices and easily scale end-to-end IoT solutions. These microservices handle tasks such as device management, data ingestion, and real-time data processing. In addition, GKE secures high degree of business continuity, enables self-healing and fault tolerance, which allow Leverege to provide enterprise-grade availability and uptime. These capabilities are crucial for Leverege to meet requirements specified by Service-Level Agreements.
Pub/Sub: Leverege uses Pub/Sub to orchestrate the routing of messages for data ingestion, allowing customers to process data in near real-time. This provides a highly auto scalable, fault-tolerant message queuing system.
Firebase: Leverege uses Firebase for real-time data and UI hosting, providing customers with a responsive and interactive user experience. With Firebase, customers can easily access and visualize IoT data, as well as build and scale applications with minimal effort.
BigQuery: BigQuery is a fundamental part of the Leverege solution. It enables customers to run long-term data storage and complex, historical SQL-like queries. These queries can be run on large amounts of data in real-time, providing customers actionable insights that can help improve operational efficiencies.
Solution: Leveraging core BigQuery features for IoT use cases
Many technology companies make extensive use of specific BigQuery features to deliver business-critical outcomes. Some use cases demand sub-second latency; others require adaptable ML models. By contrast, enterprise IoT use cases typically include a broad set of requirements necessitating the use of the full breadth of BigQuery’s core features. For example, Leverege uses an array of BigQuery features, including:
Data Storage: BigQuery serves as a limitless storage platform allowing Leverege customers to store and manage large-scale IoT data with high availability, including real-time and historical data. Some of Leverege’s integrated devices can report thousands of times a day. At a scale of millions of devices, Leverege’s customers need a scalable data warehouse.
Real-Time Streaming: BigQuery also provides a powerful streaming capability, which allows the Leverege IoT Stack to ingest and process large amounts of data in near real-time. This is crucial to components of Leverege Build, which offers out-of-the-box charts and graphs using historical data. These tools are more valuable with the integration and use of real-time data. Streaming capabilities ensure customers easily access full-scope data without searching Google Firebase.
Data Partitioning: BigQuery enables cost-effective, fast queries by providing customizable data partitioning. The Leverege IoT stack partitions nearly all historical tables by ingestion time. Because most internal history queries are time-based, this results in significant cost savings.
Data Encryption: BigQuery provides built-in encryption at rest by default, allows customers to securely store sensitive data and protect it against unauthorized access.
Access Control: BigQuery provides numerous secure data sharing capabilities. Leverege uses linked data sets and authorized views with row level policies to enforce strict access control. These policies are critical because many IoT projects allow for multi-tenancy and data siloing.
Data Governance: BigQuery provides a robust set of data governance and security features, including fine-grained access controls, which Leverege uses to enforce intricate access control policies down to the row level.
In addition to BigQuery’s core features, Leverege uses BigQuery Analytics Hub private data exchanges and Authorized Views on Datasets provides distinct advantages over old methods (e.g. CSV exports and FTP drops). Authorized Views on Leverege’s BigQuery datasets allow for intricate access policies to be enforced, while also providing Leverege’s customers the ability to analyze data using tools like Looker. Using these BigQuery features, Leverege can give customers controlled and metered access to source data without providing direct access. This feature is fundamental to meeting governance requirements across the enterprise.
BigQuery’s built-in machine learning capabilities also allow for advanced analysis and prediction of trends and patterns within the data, providing valuable insights for our customers without moving the data to external systems. Furthermore, the ability to set up automatic data refresh and materialized views in BigQuery ensures that our customers are always working with the most up-to-date and accurate data by getting better performance and reducing unnecessary costs.
Benefits and outcomes
Google Cloud infrastructure and BigQuery features enable Leverege to provide a highly scalable IoT stack. In IoT, the central challenge isn’t deploying small-scale solutions; it’s deploying and managing large-scale, performative solutions and applications by scaling in a short span of time without rearchitecting.
BigQuery table partitioning splits data into mini tables divided by an arbitrary time range. For many Leverege customers, data is divided by day, and enforced when querying data through the Leverege IoT Stack. Partitioning data tables by time range guarantees queries are restricted to a small subset of data falling within the targeted time range. By using partitioning, Leverege can deliver a performant solution at minimal cost.
BigQuery clustering further enhances performance by splitting data into designated fields. To make queries more efficient, Leverege uses clustering to query data that meet pre-designated filter criteria. In a large-scale solution with 100,000 devices, Leverege can cluster data tables and query the history of single devices, greatly accelerating searches and making the system much more performant. In addition, the reclustering happens seamlessly in the background without any extra costs.
The integration of the Leverege IoT Stack and Google Cloud, including BigQuery, today power business-critical enterprise IoT solutions at scale. The continued rapid pace of development on the infrastructure and application levels will be essential in delivering the next generation of IoT solutions.
Click here to learn more about Leverege’s capabilities or to request a demo.
The Built with BigQuery advantage for ISVs
Google is helping tech companies like Leverege build innovative applications on Google’s data cloud with simplified access to technology, helpful and dedicated engineering support, and joint go-to-market programs through the Built with BigQuery initiative, launched in April as part of the Google Data Cloud Summit. Participating companies can:
Get started fast with a Google-funded, pre-configured sandbox.
Accelerate product design and architecture through access to designated experts from the ISV Center of Excellence who can provide insight into key use cases, architectural patterns, and best practices.
Amplify success with joint marketing programs to drive awareness, generate demand, and increase adoption.
BigQuery gives ISVs the advantage of a powerful, highly scalable data warehouse that’s integrated with Google Cloud’s open, secure, sustainable platform. And with a huge partner ecosystem and support for multi-cloud, open source tools and APIs, Google provides technology companies the portability and extensibility they need to avoid data lock-in.
We thank the Google Cloud and Leverege team members who co-authored the blog: Leverege: Tony Lioon, Director, DevOps. Google: Sujit Khasnis, Solutions Architect & Adnan Fida, Transformation Technical Lead
Modern organizations make decisions and act based on trusted data. But to fully empower their users, it isn’t enough to simply make trusted data available. Organizations need to enable users to access that data through tools they use every day, like the ubiquitous spreadsheet. Today, we are announcing general availability of Connected Sheets for Looker, allowing you to access centrally defined metrics and data relationships from Looker’s semantic layer through the familiar Google Sheets interface.
Looker + Google Sheets: Better together
With Looker’s unified semantic layer, data professionals can simplify complex data for end users by codifying business logic and metrics within centralized data models. To truly build a data-driven organization, the capacity to make data-driven decisions must both be accessible to the full range of employees and simple enough to apply to day-to-day decisions. Connected Sheets for Looker provides that simplified data access experience.
Carbon Health, an early user of this integration, is working to improve healthcare access by combining the best of virtual care, in-person visits, and technology to support patients. Connected Sheets for Looker is helping them do it by providing easy-to-access reporting that has already driven greater transparency and accountability around key metrics, resulting in improved operating results. Says Product Manager, Chris Prompovitch, “Between Looker and its integration with Google Sheets, we can meet the data needs of all our stakeholders at Carbon Health.”
Looker and Sheets: Row by row
Through Connected Sheets for Looker, Google Sheets users are able to access and explore trusted, modeled data from 50+ different databases supported by Looker. Looker views, dimensions, and measures are presented through a pivot table, enabling users to flexibly explore the data set by creating pivots, building charts, and adding new formulas. The live connection between Looker and Google Sheets means data is always up to date, and user access is secured based on Looker permissions.
Pivoting to get started
To take advantage of Connected Sheets for Looker, the only thing admins need to do is enable the Looker BI Connectors or the Connected Sheets toggle within the BI Connectors panel in the Platform section of Looker’s Admin menu. The Looker instance must be on version 22.20 or later and hosted on Google Cloud.
Once Connected Sheets for Looker has been enabled, users can begin exploring Looker data in Google Sheets by following these steps:
Open a Google Sheets and navigate to the Data menu
Within the Data menu, hover over Data connectors and then click on Connect to Looker
Enter the URL of a Looker instance (for example: https://example.looker.com)
Authorize Google Sheets to access your Looker data
Select the Looker model and Explore that you want to connect to
Create a pivot table and begin to explore your data
To learn more about Looker and this new offering, contact our team.
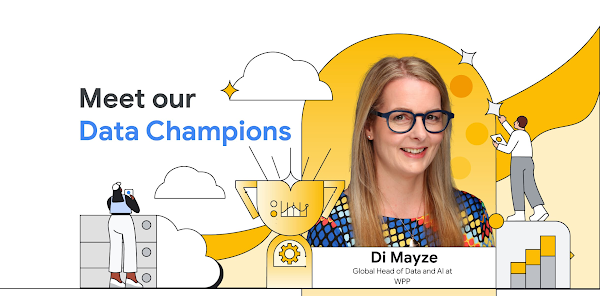
Editor’s note: This is the first blog in a series called Meet the Google Cloud Data Champions, a series celebrating the people behind data and AI-driven transformations. Each blog features a champion’s career journey, lessons learned, advice they would give other leaders, and more. This story features Di Mayze, Global Head of Data and AI at WPP, the creative transformation company that uses the power of creativity to build better futures for our people, planet, clients, and communities. Read more about WPP’s work and listen to Di speak at this fireside chat with Google Cloud’s VP of Marketing, Alison Wagonfeld, and this Forrester webcast with Bruno Aziza and Noel Yuhanna.
Tell us about yourself. Where did you grow up? What did your journey into tech look like?
I grew up in Essex and was there for 16 years until my dad, who I lived with, got remarried and moved to Somerset, and I tagged along with him. Apart from several years in Nottingham, I’ve lived in London since I went to Kingston University. I now live in Barnes in Southwest London with my husband and 13 year old son. Our house is ridiculously techie, which is fun until we have a power cut and realize we have no light switches and we can’t function without our Google Home.
From a tech point of view, I was always a bit nerdy. In 1996, I wrote my dissertation on the internet as an advertising medium. I figured so little was known about it that I stood a good chance of getting a good grade, but in reality, I was hooked on the opportunity brought by new tech, particularly in marketing. Roll forward to 1999, I became the first Head of Digital (or Online Manager as it was called then) at Hearst UK, a glossy magazine company that at the time didn’t think the internet was any kind of threat to traditional publishing because you couldn’t take your computer on the train or in the bath!
As the second chapter of my career, I left work to do a full time MBA. As a part of my course, I developed a project for dunnhumby in 2006, which is when my love for data started. I subsequently went to work there. What an amazing company to start a data career! I’ve worked in data and tech roles since then, at Boots and then at WPP, where I’ve been since 2014.
Which leaders and/or companies have inspired you along your career journey?
Clive Humby at dunnhumby was my first data inspiration. He is unbelievably smart, always a step ahead of any other data people I know and he made data accessible to all. The culture that he and Edwina Dunn created at dunnhumby was incredible; many companies try to foster a culture of curiosity and collaboration but dunnhumby really had it!
Now, I get inspiration from the 3,000 members of the WPP Data & AI Community in so many ways. It’s incredible working for a creative transformation company, as the opportunities to be creative with data are limitless and the agencies have created brilliant client work.
What’s the coolest thing you and/or your team has accomplished by leveraging data and AI?
The WPP Data & AI Community Data Challenges are really exciting to me. We release a data set in the Data Catalog and set a challenge to the community members to bring the data to life. I love how different all the entries always are. It reinforces to me that the power is never with the data, it is with the creative brain that extracts stories and insights from it. We have just launched our fifth challenge and the quality (and volume) of the entrants just keeps getting better and better. My boss, WPP Global Chief Technology Officer, Stephan Pretorius, is the lead judge and we both love watching the finalists present their work to us. I’m enormously proud of the data talent at WPP.
Technology is one part of data-driven transformation. People and processes are others. How were you able to bring the three together? Were there adoption challenges within the organization, and if so, how did you overcome them?
The WPP Open Platform brings together technology, people, and processes. Everyone across WPP can join a community, participate in training, learn more about our valued partnerships (such as our partnership with Google Cloud), and understand what products and data are available. It’s the people side that’s the hardest but fortunately, employees are always keen to discover what exists across WPP. When we created the Data & AI team in 2020, we inevitably had some cynicism around our mission and worked round this by focusing on building partnerships with the teams that could see the benefits of collaborating with us. After three years, everyone recognizes that we are here to ensure they have the data they need to deliver extraordinary client work!
What advice would you give people who want to start data initiatives in their company? OR What was the best advice you received as you were starting your data/AI journey?
Get reading, listening, and thinking about data stories. Find a blog or podcast or something that gets you thinking about the role of data in society. My go-to data podcast is BBC Radio 4 More or Less (one of my favorite episodes is Numbers of the Year 2022), which highlights the role of data in society. I’m also a voracious reader; a few of my recommendations are the book Invisible Women by Caroline Criado Perez, and The Week in Data and Quantum of Sollazzo newsletters. I always say to anyone who has an interview coming up to have some opinions or stories ready to show that you think differently about data and can make the subject come to life.
What’s an important lesson you learned along the way to becoming more data and AI driven? Were there challenges you had to overcome?
I’m not a data scientist and I was stressed in my early data career on whether that would limit me. I absolutely obsess about data but I had no interest in coding. After a few years, I realized that I could use my skills to champion data practitioners and that the data world had as much need for data storytellers, evangelists, strategists, and creative thinkers as it did scientists, and I could play a role there.
Thinking ahead 5-10 years, what possibilities with data and AI are you most excited about?
I love where no/low code is heading, which should make data accessible to so many more people. I’m hoping this accelerates interesting ways to visualize data, making it more immersive and motivating.
Want to learn more about the latest innovations in Google Data Cloud for databases, data analytics, business intelligence, and AI? Join us at the Google Data Cloud & AI Summit to gain expert insights and data strategies.
Data is essential to any application and is used in the design of an efficient pipeline for delivery and management of information throughout an organization. Generally, define a data pipeline when you need to process data during its life cycle. The pipeline can start where data is generated and stored in any format. The pipeline can end with data being analyzed, used as business information, stored in a data warehouse, or processed in a machine learning model.
Data is extracted, processed, and transformed in multiple steps depending on the downstream system requirements. Any processing and transformational steps are defined in a data pipeline. Depending on the requirements, the pipelines can be as simple as one step or as complex as multiple transformational and processing steps.
How to choose a design pattern?
When selecting a data pipeline design pattern, there are different design elements that must be considered. These design elements include the following:
Select data source formats.
Select which stacks to use.
Select data transformation tools.
Choose between Extract Transform Load (ETL), Extract Load Transform (ELT), or Extract Transform Load Transform (ETLT).
Determine how changed data is managed.
Determine how changes are captured.
Data sources can have a variety of data types. Knowing the technology stack and tool sets that we use is also a key element of the pipeline build process. Enterprise environments come with the challenges that require using multiple and complicated techniques to capture the changed data and to merge with the target data.
I mentioned that most of the time the downstream systems define the requirements for a pipeline and how these processes can be interconnected. The processing steps and sequences of the data flow are the major factors affecting pipeline design. Each step might include one or more data inputs, and the outputs might include one or more stages. The processing between input and output might include simple or complex transformational steps. I highly recommend keeping the design simple and modular to ensure that you clearly understand the steps and transformation taking place. Also, keeping your pipeline design simple and modular makes it easier for a team of developers to implement development and deployment cycles. It also makes debugging and troubleshooting the pipeline easier when issues occur.
The major components of a pipeline Include:
Source data
Processing
Target storage
Source data can be the transaction application, the files collected from users, and data extracted from an external API. Processing of the source data can be as simple as one step copying or as complex as multiple transformations and joining with other data sources. The target data warehousing system might require the processed data that is the result of the transformation (such as a data type change or data extraction), and lookup and updates from other systems. A simple data pipeline might be created by copying data from source to target without any changes. A complex data pipeline might include multiple transformation steps, lookup, updates, KPI calculations, and data storage into several targets for different reasons.
Source data can be presented in multiple formats. Each will need a proper architecture and tools to process and transform. There can be multiple data types required in a typical data pipeline that might be in any of the following formats:
Batch Data: A file with tabular information (CSV, JSON, AVRO, PARQUET and …) where the data is collected according to a defined threshold or frequency with conventional batch processing or micro-batch processing. Modern applications tend to generate continuous data. For this reason, micro-batch processing is a preferred design to collect the data from sources.
Transactions Data: Application data such as RDBMS (relational data), NoSQL, Big Data.
Stream Data: Real-time applications that use Kafka, Google Pub/Sub, Azure Stream Analytics, or Amazon Stream Data. Streaming data applications can communicate in real time and exchange messages to meet the requirements. In Enterprise architecture design, the real time and stream processing is a very important component of design.
Flat file – PDFs or other non-tabular formats that contain data for processing. For example, medical or legal documents that can be used to extract information.
Target data is defined based on the requirements and the downstream processing needs. It’s common to build target data to satisfy the need for multiple systems. In the Data Lake concept, the data is processed and stored in a way that Analytics systems can get insight while the AI/ML process can use the data to build predictive models.
Architectures and examples
Multiple architecture designs are covered that show how the source data is extracted and transformed to the target. The goal is to clever the general approaches, and it’s important to remember that each use case can be very different and unique to the customer and need special consideration.
The data pipeline architecture can be broken down into Logical and Platform levels. The logical design describes how the data is processed and transformed from the source into the target. The platform design focuses on implementation and tooling that each environment needs, and this depends on the provider and tooling available in the platform. Google Cloud, Azure, or Amazon have different toolsets for the transformation while the goal of the logical design remains the same (data transform) no matter which provider is used.
Here is a logical design of a Data Warehousing pipeline:
Here is the logical design for a Data Lake pipeline:
Depending on the downstream requirements, the generic architecture designs can be implemented with more details to address several use cases.
The Platform implementations can vary depending on the toolset selection and development skills. What follows are a few examples of Google Cloud implementations for the common data pipeline architectures.
A Batch ETL Pipeline in Google Cloud – The Source might be files that need to be ingested into the analytics Business Intelligence (BI) engine. The Cloud Storage is the data transfer medium inside Google Cloud and then Dataflow is used to load the data into the target BigQuery storage. The simplicity of this approach makes this pattern reusable and effective in simple transformational processes. On the other hand, if we need to build a complex pipeline, then this approach isn’t going to be efficient and effective.
A Data Analytics Pipeline is a complex process that has both batch and stream data ingestion pipelines. The processing is complex and multiple tools and services are used to transform the data into warehousing and an AL/ML access point for further processing. Enterprise solutions for data analytics are complex and require multiple steps to process the data. The complexity of the design can add to the project timeline and cost but in order to achieve the business objectives, carefully review and build each component.
Machine learning data pipeline in Google Cloud is a comprehensive design that allows customers to utilize all Google Cloud native services to build and process a machine learning process. For more information, see Creating a machine learning pipeline.
There are multiple approaches to designing and implementing data pipelines. The key is to choose the design that meets your requirements. There are new technologies emerging that are providing more robust and faster implementations for data pipelines. Google Big Lake is a new service that introduces a new approach on data ingestion. BigLake is a storage engine that unifies data warehouses by enabling BigQuery and open source frameworks such as Spark to access data with fine-grained access control. BigLake provides accelerated query performance across multi-cloud storage and open formats such as Apache Iceberg.
The other major factor in deciding the proper data pipeline architecture is the cost. Building a cost-effective solution is a major factor in deciding the design. Usually, streaming and real-time data processing pipelines are more expensive to build and run compared to using batch models. There are times that the budget runs the decision on which design to choose and how to build the platform. Knowing the details on each component and being able to do cost analysis of the solution ahead of time is important in choosing the right architecture design for your solution. Google Cloud provides a cost calculator that can be used in these cases.
Do you really need real-time analytics or will a near real-time system be sufficient? This can resolve the design decision for the streaming pipeline. Are you building cloud native solutions or migrating an existing one from on-premises? All of these questions are important in designing a proper architecture for our data pipeline.
Don’t ignore the data volume when designing a data pipeline. The scalability of the design and services used in the platform is another very important factor to consider when designing and implementing a solution. Big Data is growing more and building capacity for processing. Storing the data is a key element to data pipeline architecture. In reality, there are many variables that can help with proper platform design. The data volume and velocity or data flow rates can be very important factors.
If you are planning to build a data pipeline for a data science project, then you might consider all data sources that the ML Model requires for future engineering. The data cleansing process is mostly a big part of the data engineering team which must have adequate and sufficient transformational toolsets. Data science projects are dealing with large data sets, which will require planning for storage. Depending on how the ML Model is utilized, either real-time or batch processing must serve the users.
What Next?
Big Data and the growth of the data in general are posing new challenges for data architects and always challenging the requirements for data architecture. A constant increase of data variety, data formats, and data sources is a challenge as well. Businesses are realizing the value of the data and are automating more processes and demanding real-time access to the analytics and decision making information. This is becoming a challenge to take into consideration all variables for a scalable performance system. The data pipeline must be strong, flexible, and reliable. The data quality must be trusted by all users. Data privacy is one of the most important factors in any design consideration. I’ll cover these concepts in my next article.
I highly recommend following Google Cloud quickstart and tutorials as the next steps to learn more about the Google Cloud and experience hands-on practice.
Developing in SQL poses significant problems when compared to other languages and frameworks. It’s not easy to reuse statements across different scripts, there’s no way to write tests to ensure data consistency, and dependency management requires external software solutions. Developers will typically write thousands of lines of SQL to ensure data processing occurs in the correct order. Additionally, documentation and metadata are afterthoughts because they need to be managed in an external catalog.
Google Cloud offers Dataform and SQLX to solve these challenges.
Dataform is a service for data analysts to test, develop, and deploy complex SQL workflows for data transformation in BigQuery. Dataform lets you manage data transformation in the Extraction, Loading, and Transformation (ELT) process for data integration. After extracting raw data from source systems and loading into BigQuery, Dataform helps you transform it into a well-defined, tested, and documented suite of data tables.
SQLX is an open source extension of SQL and the primary tool used in Dataform. As it is an extension, every SQL file is also a valid SQLX file. SQLX brings additional features to SQL to make development faster, more reliable, and scalable. It includes functions including dependencies management, automated data quality testing, and data documentation
Teams should quickly transform their SQL into SQLX to gain the full suite of benefits that Dataform provides. This blog contains a high-level, introductory guide demonstrating this process.
The steps in this guide use the Dataform on Google Cloud console. You can follow along or implement these steps with your own SQL scripts!
Getting Started
Here is an example SQL script we will transform into SQLX. This script takes a source table containing reddit data. The script cleans, deduplicates, and inserts the data into a new table with a partition.
code_block[StructValue([(u’code’, u’CREATE OR REPLACE TABLE reddit_stream.comments_partitionedrnPARTITION BYrn comment_daternASrnrnWITH t1 as (rnSELECTrn comment_id,rn subreddit,rn author,rn comment_text,rn CAST(total_words AS INT64) total_words,rn CAST(reading_ease_score AS FLOAT64) reading_ease_score,rn reading_ease,rn reading_grade_level,rn CAST(sentiment_score AS FLOAT64) sentiment_score,rn CAST(censored AS INT64) censored,rn CAST(positive AS INT64) positive,rn CAST(neutral AS INT64) neutral,rn CAST(negative AS INT64) negative,rn CAST(subjectivity_score AS FLOAT64) subjectivity_score,rn CAST(subjective AS INT64) subjective,rn url,rn DATE(comment_date) comment_date,rn CAST(comment_hour AS INT64) comment_hour,rn CAST(comment_year AS INT64) comment_year,rn CAST(comment_day AS INT64) comment_dayrnFROM reddit_stream.comments_streamrn)rnSELECT k.*rnFROM (rn SELECT ARRAY_AGG(row LIMIT 1)[OFFSET(0)] krn FROM t1 rowrn GROUP BY comment_idrn)’), (u’language’, u”), (u’caption’, <wagtail.wagtailcore.rich_text.RichText object at 0x3e3968e07750>)])]
1. Create a new SQLX file and add your SQL
In this guide we’ll title our file as comments_partitioned.sqlx.
As you can see below, our dependency graph does not provide much information.
2. Refactor SQL to remove DDL and use only SELECT
In SQLX, you only write SELECT statements. You specify what you want the output of the script to be in the config block, like a view or a table as well as other types available. Dataform takes care of adding CREATE OR REPLACE or INSERT boilerplate statements.
3. Add a config object containing metadata
The config object will contain the output type, description, schema (dataset), tags, columns and their descriptions, and the BigQuery-related configuration. Check out the example below.
code_block[StructValue([(u’code’, u’config {rn type: “table”,rn description: “cleaned comments data and partitioned by date for faster performance”,rn schema: “demo_optimized_staging”,rn tags: [“reddit”],rn columns: {rn comment_id: “unique id for each comment”,rn subreddit: “which reddit community the comment occurred”,rn author: “which reddit user commented”,rn comment_text: “the body of text for the comment”,rn total_words: “total number of words in the comment”,rn reading_ease_score: “a float value for comment readability score”,rn reading_ease: “a plain-text english categorization of readability”,rn reading_grade_level: “a plain-text english categorization of readability by school grade level”,rn sentiment_score: “float value for sentiment of comment between -1 and 1”,rn censored: “whether the comment needed to censoring by some process upstream”,rn positive: “one-hot encoding 1 or 0 for positive”,rn neutral: “one-hot encoding 1 or 0 for neutral”,rn negative: “one-hot encoding 1 or 0 for negative”,rn subjectivity_score: “float value for comment subjectivity score”,rn subjective: “one-hot encoding 1 or 0 for subjective”,rn url: “link to the comment on reddit”,rn comment_date: “date timestamp for when the comment occurred”,rn comment_hour: “integer for hour of comment post time”,rn comment_year: “integer for year of comment post time”,rn comment_month: “integer for month of comment post time”,rn comment_day: “integer for day of comment post time”rn },rn bigquery: {rn partitionBy: “comment_date”,rn labels: {rn cost_center: “123456”rn }rn }rn}’), (u’language’, u”), (u’caption’, <wagtail.wagtailcore.rich_text.RichText object at 0x3e3968e02fd0>)])]
4. Create declarations for any source tables
In our SQL script, we directly write reddit_stream.comments_stream. In SQLX, we’ll want to utilize a declaration to create relationships between source data and tables created by Dataform. Add a new comments_stream.sqlx file to your project for this declaration:
code_block[StructValue([(u’code’, u’config {rn type: “declaration”,rn database: “my-project”,rn schema: “reddit_stream”,rn name: “comments_stream”,rn description: “A BigQuery table acting as a data sink for comments streaming in real-time.”rn}’), (u’language’, u”), (u’caption’, <wagtail.wagtailcore.rich_text.RichText object at 0x3e3968e02b50>)])]
We’ll utilize this declaration in the next step.
5. Add references to declarations, tables, and views.
This will help build the dependency graph. In our SQL script, there is a single reference to the declaration. Simply replace reddit_stream.comments_stream with ${ref(“comments_stream”)}.
Managing dependencies with the ref function has numerous advantages.
The dependency tree complexity is abstracted away. Developers simply need to use the ref function and list dependencies.
It enables us to write smaller, more reusable and more modular queries instead of thousand-line-long queries. That makes pipelines easier to debug.
You get alerted in real time about issues like missing or circular dependencies
6. Add assertions for data validation
You can define data quality tests, called assertions, directly from the config block of your SQLX file. Use assertions to check for uniqueness, null values or any custom row condition. The dependency tree adds assertions for visibility.
These assertions will pass if comment_id is a unique key, if comment_text is non-null, and if all rows have total_words greater than zero.
7. Utilize JavaScript for repeatable SQL and parameterization
Our example has a deduplication SQL block. This is a perfect opportunity to create a JavaScript function to reference this functionality in other SQLX files. For this scenario, we’ll create the includes folder and add a common.js file with the following contents:
code_block[StructValue([(u’code’, u’function dedupe(table, group_by_cols) {rn return `rnSELECT k.*rnFROM (rn SELECT ARRAY_AGG(row LIMIT 1)[OFFSET(0)] krn FROM ${table} rowrn GROUP BY ${group_by_cols}rn)rn `rn}rnrnmodule.exports = { dedupe };’), (u’language’, u”), (u’caption’, <wagtail.wagtailcore.rich_text.RichText object at 0x3e396a289910>)])]
Now, we can replace that code block with this function call in our SQLX file as such:
${common.dedupe(“t1”, “comment_id”)}
In certain scenarios, you may want to use constants in your SQLX files. Let’s add a constants.js file to our includes folder and create a cost center dictionary.
8. Validate the final SQLX file and compiled dependency graph
After completing the above steps, let’s have a look at the final SQLX files:
comments_stream.sqlx
code_block[StructValue([(u’code’, u’config {rn type: “declaration”,rn database: “my-project”,rn schema: “reddit_stream”,rn name: “comments_stream”,rn description: “A BigQuery table acting as a data sink for comments streaming in real-time.”rn}’), (u’language’, u”), (u’caption’, <wagtail.wagtailcore.rich_text.RichText object at 0x3e3969628310>)])]
comments_partitioned.sqlx
code_block[StructValue([(u’code’, u’config {rn type: “table”,rn description: “cleaned comments data and partitioned by date for faster performance”,rn schema: “demo_optimized_staging”,rn tags: [“reddit”],rn columns: {rn comment_id: “unique id for each comment”,rn subreddit: “which reddit community the comment occurred”,rn author: “which reddit user commented”,rn comment_text: “the body of text for the comment”,rn total_words: “total number of words in the comment”,rn reading_ease_score: “a float value for comment readability score”,rn reading_ease: “a plain-text english categorization of readability”,rn reading_grade_level: “a plain-text english categorization of readability by school grade level”,rn sentiment_score: “float value for sentiment of comment between -1 and 1”,rn censored: “whether the comment needed to censoring by some process upstream”,rn positive: “one-hot encoding 1 or 0 for positive”,rn neutral: “one-hot encoding 1 or 0 for neutral”,rn negative: “one-hot encoding 1 or 0 for negative”,rn subjectivity_score: “float value for comment subjectivity score”,rn subjective: “one-hot encoding 1 or 0 for subjective”,rn url: “link to the comment on reddit”,rn comment_date: “date timestamp for when the comment occurred”,rn comment_hour: “integer for hour of comment post time”,rn comment_year: “integer for year of comment post time”,rn comment_month: “integer for month of comment post time”,rn comment_day: “integer for day of comment post time”rn },rn bigquery: {rn partitionBy: “comment_date”,rn labels: {rn cost_center: constants.COST_CENTERS.devrn }rn },rn assertions: {rn uniqueKey: [“comment_id”],rn nonNull: [“comment_text”],rn rowConditions: [rn “total_words > 0″rn ]rn }rn}rnrnWITH t1 as (rnSELECTrn comment_id,rn subreddit,rn author,rn comment_text,rn CAST(total_words AS INT64) total_words,rn CAST(reading_ease_score AS FLOAT64) reading_ease_score,rn reading_ease,rn reading_grade_level,rn CAST(sentiment_score AS FLOAT64) sentiment_score,rn CAST(censored AS INT64) censored,rn CAST(positive AS INT64) positive,rn CAST(neutral AS INT64) neutral,rn CAST(negative AS INT64) negative,rn CAST(subjectivity_score AS FLOAT64) subjectivity_score,rn CAST(subjective AS INT64) subjective,rn url,rn DATE(comment_date) comment_date,rn CAST(comment_hour AS INT64) comment_hour,rn CAST(comment_year AS INT64) comment_year,rn CAST(comment_month AS INT64) comment_month,rn CAST(comment_day AS INT64) comment_dayrnFROM ${ref(‘comments_stream’)}rnWHERE CAST(total_words AS INT64) > 0)rnrnrn${common.dedupe(“t1”, “comment_id”)}’), (u’language’, u”), (u’caption’, <wagtail.wagtailcore.rich_text.RichText object at 0x3e394ba4f7d0>)])]
Let’s validate the dependency graph and ensure the order of operations looks correct.
Now it’s easy to visualize where the source data is coming from, what output type comments_partitioned is, and what data quality tests will occur!
Next Steps
This guide outlines the first steps of transitioning legacy SQL solutions to SQLX and Dataform for improved metadata management, comprehensive data quality testing, and efficient development. Adopting Dataform streamlines the management of your cloud data warehouse processes allowing you to focus more on analytics and less on infrastructure management. For more information, check out Google Cloud’s Overview of Dataform. Explore our official Dataform guides and Dataform sample script library for even more hands-on experiences.