Your data is faster together: Your unified data platform for building modern apps

Your data is faster together: Your unified data platform for building modern apps

97 zettabytes was the estimated volume of data generated worldwide in 20221. This sort of explosion in data volume is happening in every enterprise. Now imagine being able to access all this data you own from anywhere, at any time, analyze it, and leverage its insights to innovate your products and services? One of the biggest barriers to fulfilling this vision is the complexity inherent in dealing with data trapped across silos in an enterprise. Google Data Cloud offers a unified, open, and intelligent platform for innovation, allowing you to integrate your data on a common architectural platform. Across industries, organizations are able to reimagine their data possibilities in entirely new ways and quickly build applications that delight their customers.

Siloed data: The barrier to speed and innovation

Digital technologies ranging from transaction processing to analytics and AI/ML use data to help enterprises understand their customers better. And the pace of innovation has naturally accelerated as organizations learn, adapt, and race to build the next generation of applications and services to compete for customers and meet their needs. At Next 2022, we made a prediction that the barriers between transactional and analytical workloads will mostly disappear.

Traditionally, data architectures have separated transactional and analytical systems—and that’s for good reason. Transactional databases are optimized for fast reads and writes, and analytical databases are optimized for analyzing and aggregating large data sets. This has siloed enterprise data systems, leaving many IT teams struggling to piece together solutions. The result has been time consuming, expensive, and complicated fixes to support intelligent, data-driven applications. 

But, with the introduction of new technologies, a more time-efficient and cost-effective approach is possible. Customers now expect to see personalized recommendations and tailored experiences from their applications. With hybrid systems that support both transactional and analytical processing on the same data, without impacting performance, these systems now work together to generate timely, actionable insights that can be used to create better experiences and accelerate business outcomes.   

According to a 2022 research paper from IDC, unifying data across silos via a data cloud is the foundational capability enterprises need to gain new insights on rapidly changing conditions and to enable operational intelligence. The modern data cloud provides unified, connected, scalable, secure, extensible, and open data, analytics, and AI/ML services. In this platform, everything is connected to everything else.

Google Data Cloud

Why reducing data barriers delivers more value 

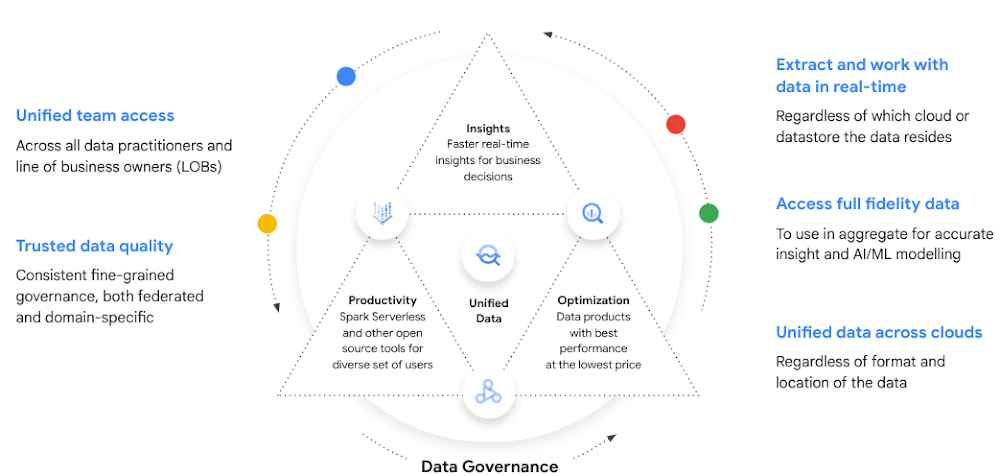
The primary benefit of a unified data cloud is that it provides an intuitive and timely way to represent data and allows easy access to related data points. By unifying their data, enterprises are able to: 

Ingest data faster – for operational intelligence

Unify data across silos – for new insights

Share data with partners – for collaborative problem solving

Change forecasting models – to understand and prepare for shifting markets

Iterate with decision-making scenarios – to ensure agile responses

Train models on historical data – to build smarter applications

As generative AI applications akin to Bard, an early experiment by Google, become available in the workplace, it will be more important than ever for organizations to have a unified data landscape to holistically train and validate their proprietary large language models. 

With these benefits enterprises can accelerate their digital transformation in order to thrive in our increasingly complex digital environment. A survey of more than 800 IT leaders indicated that using a data cloud enabled them to significantly improve employee productivity, operational efficiency, innovation, and customer experience, among others. 

Build modern apps with a unified and integrated data cloud

Google Cloud technologies and capabilities reduce the friction between transactional and analytical workloads and make it easier for developers to build applications, and to glean real-time insights. Here are a few examples. 

AlloyDB for PostgreSQL, a fully managed PostgreSQL-compatible database, and AlloyDB Omni, the recently launched downloadable edition of AlloyDB, can analyze transactional data in real time. AlloyDB is more than four times faster for transactional workloads and up to a 100 times faster for analytical queries compared to standard PostgreSQL, according to our performance tests. This kind of performance makes AlloyDB the ideal database for hybrid transactional and analytical processing (HTAP) workloads.

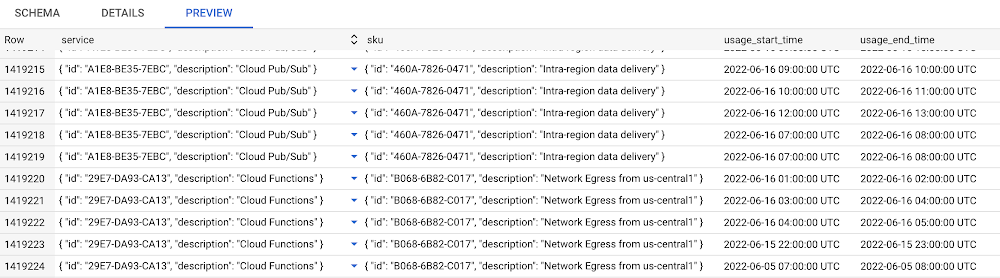
Datastream for BigQuery, a serverless change data capture and replication service, provides simple and easy real time data replication from transactional databases like AlloyDB, PostgreSQL, MySQL and Oracle directly into BigQuery, Google Cloud’s enterprise data warehouse.

And, query federation with Cloud Spanner, Cloud SQL, and Cloud Bigtable, make data available right from the BigQuery console allowing customers to analyze data in real-time in transactional databases. 

Speed up deployments and lower costs

By reducing data barriers, we’re taking a fundamentally different approach that allows organizations to be more innovative, efficient, and customer-focused by providing: 

Built-in industry leading AI and ML that helps organizations not only build improved insights, but also automate core business processes and enable deep ML-driven product innovation. 

Best-in-class flexibility. Integration with open source standards and APIs ensures portability and extensibility to prevent lock-in. Plus, choice of deployment options means easy interoperability with existing solutions and investments.  

The most unified data platform with the ability to manage every stage of the data lifecycle, from running operational databases to managing analytics applications across data warehouses and lakes to rich data-driven experiences. 

Fully managed database services that free up DBA/DevOps time to focus on high-value work that is more profitable to the business. Organizations that switch from self-managed databases eliminate manual work, realize significant cost savings, reduce risk from security breaches and downtime and increase productivity and innovation. In an IDC survey, for example, Cloud SQL customers achieve an average three-year ROI of 246% because of the value and efficiencies this fully managed service delivers. 

Google Data Cloud improves the efficiency and productivity of your teams, resulting in increased innovation across your organization. This is the unified, open approach to data-driven transformation bringing unmatched speed, scale, security, and with AI built in. 

In case you missed it: Check out our Data Cloud and AI Summit that happened on March 29th, to learn more about the latest innovations across databases, data analytics, BI and AI. In addition, learn more about the value of managed database services like Cloud SQL in this IDC study.

1. How Big is Big? – Statista

Source : Data Analytics Read More

Introducing BigQuery Partner Center — a new way to discover and leverage integrated partner solutions

Introducing BigQuery Partner Center — a new way to discover and leverage integrated partner solutions

At Google, we are committed to building the most open and extensible Data Cloud. We want to provide our customers with more flexibility, interoperability and agility when building analytics solutions using BigQuery and tightly integrated partner products. We have therefore significantly expanded our Data Cloud partner ecosystem, and are increasing our investment in technology partners in a number of new areas.

At the Google Data Cloud & AI Summit in March, we introduced BigQuery Partner Center, a new user interface in the Google Cloud console that enables our customers to easily discover, try, purchase and use a diverse range of partner products that have been validated through the Google Cloud Ready – BigQuery program. 

Google Cloud Ready – BigQuery is a program whereby Google Cloud engineering teams evaluate and validate BigQuery partner integrations and connectors using a series of tests and benchmarks based on standards set by Google. Customers can be assured of the quality of the integrations when using these partner products with BigQuery. These validated partners and solutions are now accessible directly from BigQuery Partner Center.

Navigating in BigQuery Partner Center

Customers can start exploring BigQuery Partner Center by launching the BigQuery Cloud Console.

A video demo of how to discover and install a free trial of Confluent Cloud from the BigQuery Partner Center.

Discover: In the Partner Center, you can find a list of validated partners organized in the following categories:

BI, ML, and Advanced Analytics

Connectors & Development Tools

Data Governance, Master Data Management

Data Quality & Observability

ETL & Data Integration

Try: You will have the option to try out the product by signing up for a free trial version offered by the partner.

Buy: If you choose to purchase any of the partner products, you can do it directly from Google Cloud Marketplace by clicking on the Marketplace hyperlink tag.

Here’s an overview of how you can discover and use some of BigQuery’s partner solutions.

Confluent Cloud is now available in BigQuery Partner Center to help customers easily connect and create Confluent streaming data pipelines into BigQuery, and extract real-time insights to support proactive decision-making while offloading operational burdens associated with managing open source Kafka..

Fivetran offers a trial experience through the BigQuery Partner Center, which allows customers to replicate data from key applications, event streams, and file stores to BigQuery continuously. Moreover, customers can actively monitor their connector’s performance and health using logs and metrics provided through Google Cloud Monitoring.

Neo4j provides an integration through BigQuery Partner Center that allows users to extend SQL analysis with graph-native data science and machine learning by working seamlessly between BigQuery and Neo4j Graph Data Science; whether using BigQuery SQL or notebooks. Data science teams can now improve and enrich existing analysis and ML using the graph-native data science capabilities within Neo4j by running in-memory graph analysis directly from BigQuery.

Expanding partner ecosystem through Google Cloud Ready – BigQuery 

We are also excited to share that, since we introduced the Google Cloud Ready – BigQuery initiative last year, we have recognized over 50 technology partners that have successfully met a core set of integration requirements with BigQuery. 

To unlock more use cases that are critical to customers’ data-driven transformation journey, 

Google Cloud engineering teams closely worked with partners across many categories to test compatibility, tune functionality, and optimize integrations to ensure our customers have the best experience when using these partner products with BigQuery.

For example, in the Data Quality & Observability category, we have most recently validated products from Anomalo, Datadog, Dynatrace, Monte Carlo and New Relic to enable better detection and remediation of data quality issues.

In the Reverse ETL & Master Data Management category, we worked with Hightouch and Tamr to expand data management use cases for data cleansing, preparation, enrichment and data synchronization from BigQuery back to SaaS based applications.

Data Governance and Security partners like Immuta and Privacera can provide enhanced data access controls and management capabilities for BigQuery, while Carto offers advanced geospatial and location intelligence capabilities that are well integrated with BigQuery.

We also continue to expand partnerships in key categories such as Advanced Analytics and Data Integration with industry leading partners like Starburst, Sisense, Hex, and Hevo Data to ensure our customers have flexibility and options in choosing the right partner products to meet their business needs.

With the general availability of BigQuery Partner Center, customers can now conveniently discover, try out and install a growing list of Google Cloud Ready – BigQuery validated partners from the BigQuery Cloud Console directly.

Getting started

To explore in the new Partner Center, launch the BigQuery Cloud Console.

To see a full list of partner solutions and connectors that have been validated to work well with BigQuery, visit here

To learn more about the Google Cloud Ready – BigQuery validation program, visit our documentation page

If you are a partner interested in becoming “Google Cloud Ready” for BigQuery, please fill out this intake form

If you have any questions, feel free to contact us.

Source : Data Analytics Read More

Track your cloud costs with BigQuery for easy analysis

Track your cloud costs with BigQuery for easy analysis

TL;DR – Regular file export for Google Cloud billing is going away on May 15th! Try out this interactive tutorial to set up exporting and explore your billing data with BigQuery

You may have seen an email from Google Cloud reminding you to set up billing data export to BigQuery, and letting you know that file export options are going away. More specifically:

Starting May 15, 2023, your daily usage and cost estimates won’t be automatically exported to a Cloud Storage bucket. Your existing Cloud Storage buckets will continue to exist, but no new files will be added on an ongoing basis.

In fact, I even received one of these notifications since I had an old billing account (or two) that still had file export enabled. Even though the file export is going away, exporting your billing data to BigQuery gives you more detail and more capabilities to analyze, so it’s a big upgrade.

Start from the start

While Google Cloud does offer a free trial and free tier of services, it shouldn’t come as a surprise that most cloud services cost money to use. With the unique properties of the cloud, it’s much easier to bill for exact usage of various services, like pay-per-second for virtual machines. However, this can also become an overwhelming amount of information when a large number of services are being used across multiple teams. In order to make sure you understand your billing data, Google Cloud offers that data through direct reporting in the Cloud console, file exports, and exporting to BigQuery.

Most importantly, the file export for Cloud Billing data is going away on May 15th (the file exports for specific reports, like the cost table, aren’t going away). This was an option for billing accounts to generate daily CSV or JSON files into a Cloud Storage bucket so you could download the files and analyze them as needed. While these exports were definitely helpful for looking at your billing data, over time they couldn’t keep up with the complexity and volume of data that comes out of a billing account.

The most important thing to note here is simple: this export option is being deprecated entirely, so if you’re currently using it (and even if you’re not), you should make sure exporting to BigQuery is enabled.

Large data, large queries

Exporting from your billing account into BigQuery has been an option for the past few years, and now more than ever it’s the central option for managing your billing data. Of course, BigQuery is a natural home for large datasets with the scale and granularity of your billing data. In addition to that, exporting to BigQuery also happens more frequently than a daily file export, so you can do cost anomaly detection much faster.

As teams and organizations become larger, it can be increasingly difficult to figure out which groups are responsible for different costs. If your organization is using a chargeback model (where one group pays for all resources and then breaks down cost details for individual teams/groups to be responsible for their usage), then using BigQuery is the best way for you to accurately collect and analyze costs. On top of being able to query directly against your data, BigQuery also makes it much easier to integrate with other tools, like Looker or Looker Studio for visualization.

The actual data being exported to BigQuery are hourly records of every service your billing account is responsible for, along with detailed information like the SKU, what type of unit is being measured, and how many of that unit you’re paying for.

A small snapshot of billing data exported to BigQuery

I suspect most folks using the file export (and probably most folks overall) will be fine with the standard export for BigQuery, and can use the detailed cost and pricing options if they need even more details. You can find some more details on all the exports in this blog post.

With the file export going away, it’s also important to mention: exporting your Cloud Billing data to BigQuery starts when you enable it, and doesn’t include older data. So make sure you set yourself up for future success by enabling billing export as soon as possible. Try using our built-in walkthrough to help you enable the export and to get started analyzing the data! You can also read more in the documentation.

Source : Data Analytics Read More

How a green energy provider used Dataplex for its data governance and quality

How a green energy provider used Dataplex for its data governance and quality

Brazil is one of the world’s most promising renewables markets, in which Casa Dos Ventos is a leading pioneer and investor. With our innovation and investments we are leading the transition into a more competitive and sustainable future.

At Casa Dos Ventos, we lean into ‘big data’ to support critical decisions for our business. Most of our data is stored in BigQuery, a serverless enterprise data warehouse. We constantly use innovative tools and services from Google Cloud to speed up our business more efficiently, promoting decarbonization at scale in real-life.

For example, in wind farm operations, the data is used to quantify energy production, losses and efficiency. For meteorological masts (also known as metmasts), the sensor data and configurations are constantly ingested and analyzed for their health. In newer and green field projects, we use data to make decisions on our investments. 

We need trusted data to make these decisions to avoid going wrong with our goals around uptime, efficiency, and investment returns! However, controlling data quality has been a challenge for us, frequently leading us to data firefighting. 

Previously, we built homegrown solutions that could have worked for us better — like setting rules and alerts in BI tools,or writing custom Python scripts. These approaches were hard to scale, standardize, and often costly. 

To solve these problems, we turned to Dataplex, an intelligent data fabric that unifies distributed data, to achieve better data governance in our organization and build trust in the data. With Dataplex, we now have a very streamlined way of organizing our data, securing, and monitoring data for data quality.

We started Dataplex implementation with three key goals:

Define a data governance framework for the organization.

Create reports that routinely measure adherence to the framework. 

Create reports that routinely measure the quality of the data. 

Let’s take a tour of how we do that today.

Define a data governance framework for the organization

We started by organizing the data in alignment with the business and then using Dataplex to set policies for this organization. 

Dataplex abstracts away the underlying data storage systems by using the constructs like lake, data zone, and assets. We decided to map these constructs to our business with the following framework: 

Lake – One lake per department in the company 

Data Zone – Separate data in subareas using the zone 

Raw zone – Contains datasets used for raw tables or tables with few modifications / aggregations

Curated zone – Contains datasets with aggregate tables or prediction tables (used by ML models) 

For example:

This allowed us to set data permissions at a Lake or a Zone level. Dataplex then propagates permissions to the Assets in a zone continuously.

Create reports for data assets and govern data assets 

To monitor our data’s governance stature, we have two reports that capture the current state.

The first report tracks the entire data estate. We used BigQuery APIs and developed Python scripts (scheduled by Composer) to extract the metadata of all BigQuery tables in the organization. It also measures critical aspects like # of documented tables and views. 

Secondly, we also track our progress in continuously bringing our data estate into Dataplex governance. We followed the same process (API + Python code) to build the following dashboard. Currently, the datasets under Dataplex stand at 71.6% per this dashboard. Our goal is to get to 100% and then maintain that.

Dashboard Dataplex Analysis

Create data quality scans and reports 

Once data is under management in Dataplex, we build data quality reports and a dashboard in Dataplex with a few simple clicks. 

Multiple data quality scans run within Dataplex, one for each critical table.

To create rules we used the built-in rules but also created our own using custom SQL statements. For example, to make sure we do not ever have any rows that match a particular condition, we created a SQL rule that returns FALSE when we have even a single row matching the condition. 

code_block[StructValue([(u’code’, u'(SELECT COUNT(<columnX>) as count_valuesrn FROM `metmastDB.TableX`rn WHERE `columnX` IS NULL and columnY<>”some string”rn ) =0′), (u’language’, u”), (u’caption’, <wagtail.wagtailcore.rich_text.RichText object at 0x3ec12a0e4d90>)])]

E.g., SQL rules

When these checks fail, we rely on the query shown by Dataplex AutoDQ to find the rows that failed.

To build a dashboard for data quality, we use the logs in Cloud Logging and set up a sink to BigQuery. Once the data lands in BigQuery, we create a view with following query: 

code_block[StructValue([(u’code’, u”SELECT rn timestamp,rn resource.type,rn resource.labels.datascan_id,rn resource.labels.location,rn jsonpayload_v1_datascanevent.scope,rn jsonpayload_v1_datascanevent.type as type_scan_event,rn jsonpayload_v1_datascanevent.trigger,rn SPLIT(jsonpayload_v1_datascanevent.datasource, ‘/’)[offset(1)] datasource_project,rn SPLIT(jsonpayload_v1_datascanevent.datasource, ‘/’)[offset(3)] datasource_location,rn SPLIT(jsonpayload_v1_datascanevent.datasource, ‘/’)[offset(5)] datasource_lake,rn SPLIT(jsonpayload_v1_datascanevent.datasource, ‘/’)[offset(7)] datasource_zone,rn jsonpayload_v1_datascanevent.dataquality.dimensionpassed.uniqueness,rn jsonpayload_v1_datascanevent.dataquality.dimensionpassed.completeness,rn jsonpayload_v1_datascanevent.dataquality.dimensionpassed.validity,rn jsonpayload_v1_datascanevent.dataquality.rowcount,rn jsonpayload_v1_datascanevent.dataquality.passedrnFROM `datalake-cver.Analytics_Data_Quality_cdv.dataplex_googleapis_com_data_scan` DATA_SCAN”), (u’language’, u”), (u’caption’, <wagtail.wagtailcore.rich_text.RichText object at 0x3ec12a10d310>)])]

Creating this view enables separating data quality scan results by lake and zones. 

We then use Tableau to:

Create a dashboard and 

Send notifications by email for responsible users using alerts in Tableau

Here is our Tableau dashboard:

Looking ahead 

While we have achieved a much better governance posture, we also look forward to expanding our usage of Dataplex further. We are starting to use the Lineage feature for BigQuery tables and learning how to integrate Data Quality with Lineage. This will enable us to check the dashboard and views impacted by data quality issues easily. We are also planning to manage SQL scripts in our Github account.

To get access to the scripts we referred to in this blog , visit: https://github.com/Casa-dos-Ventos/project_data_governance_casa_dos_ventos_google

Source : Data Analytics Read More

Built with BigQuery: How Mercari US turned BigQuery into an ML-powered customer-growth machine

Built with BigQuery: How Mercari US turned BigQuery into an ML-powered customer-growth machine

When peer-to-peer marketplace Mercari came to the US in 2014, it had its work cut out for it. Surrounded by market giants like eBay, Craigslist, and Wish, Mercari needed to carve out an approach to compete for new users. Furthermore, Mercari wanted to build a network for buyers and sellers to return to, rather than a site for individual specialty purchases. 

As an online marketplace that connects millions of people across the U.S. to shop and sell items of value no longer being used, Mercari is built for the everyday shopper and casual seller. Two teams, Machine Learning (ML) team and Marketing Technology specialists, both led by Masumi Nakamura, Mercari VP of Engineering, saw an opportunity to supercharge Mercari’s growth in the US by leveraging their first-party data in BigQuery and connecting predictive models built in Google Cloud directly to marketing channels, such as churn predictions and item recommendations for email campaigns, and LTV predictions to optimize paid media. Churn predictions could be used to target marketing communications, and item recommendations could be used to personalize the content of those communications at the user level. By fully utilizing cloud computing services, they could grow sustainably and flexibly, focusing their team’s efforts where they belonged — user understanding and personalized marketing.

In 2018, the Mercari US team engaged Flywheel Software, experts in leveraging first-party customer data for business growth. Working exclusively in Google Cloud and BigQuery, Flywheel helped Masumi transform Marketing Technology at Mercari in the US.

Use cases: challenges

Masumi and the ML team’s primary goal aimed to reduce churn across buyers and sellers. Customers would make an initial purchase, but repurchase and resale rates were lower than the team hoped for. The ML team, led by Masumi, was confident that if they could get customers to make a second and third purchase, they could drive strong lifetime value (LTV). 

Despite the team’s robust data science capabilities and investments in a data warehouse (BigQuery), they were missing the ability to streamline efforts for efficient audience segmentation and targeting. Like most companies looking to utilize data for marketing, the team at Mercari had to engage with engineering in order to build out customer segments for campaign launches and testing. From start to finish, launching a single campaign could take three months. 

In short, Mercari needed a way to speed up the process across the teams at Mercari. How could they turn the team’s predictions into active marketing experiments with greater velocity and agility?

Solution: BigQuery and Flywheel Software supercharge growth across the customer lifecycle

With their strong data engineering foundation and BigQuery already in place, the Mercari team began addressing their needs step-by-step. First, they used predictions to identify retention features, then built out initial segment definitions based on those features. From there, the team designed and launched experiments and measured their performance, refining as they went. By providing Mercari’s marketing team with the ability to build their own customer lists that leveraged predictive models without requiring continuous support from other teams’ data engineers and business intelligence analysts, Flywheel enabled them to address churn and acquisition with a single, self-serve solution.

Mercari architecture diagram on Google Cloud with Flywheel

The dynamic duo: Flywheel Software and BigQuery

Customer 360: Flywheel enabled Mercari to combine their data sources into a single view of their customers in BigQuery, then connected them to marketing and sales channels via Flywheel’s platform. Notably, Mercari is able to leverage its own complex data model, which was ideal for a two-sided marketplace. This is shown in the “Collect & Transform” stage in the architecture diagram above.

Predictive models: Flywheel activated predictions that had been snapshotted by Mercari’s team in BigQuery. The Mercari ML team used Jupyter notebooks offering part of Google Vertex AI Workbench to build user churn and customer lifetime value (CLTV) prediction models, then productionized them using Cloud Composer to deploy Airflow DAGs, which wrote the predictions back to BigQuery for targeting, and triggered exports to destination channels using Pub/Sub. This is shown in the “Intelligence” stage of the architecture diagram above.

Extensible measurement and data visualization: Since Flywheel writes all audience data back to BigQuery, the Mercari analytics team can conduct performance analysis on metrics from revenue to retention. They are able to use Flywheel’s performance visualization in-app, but they are also able to create custom data visualizations with Looker Studio. This is also shown in the “Intelligence” stage of the architecture diagram.

Seamless routing and activation: With Flywheel’s audience platform connected directly to Customer 360 and the predictive model’s results in BigQuery, the marketing team is able to launch and sync audiences and their personalization attributes across all of Mercari’s major marketing, sales and product channels, such as Braze, Google Ads and other destinations. This is shown in the “Routing” and “Activate” stage of the architecture diagram.

“Being able to measure what you’re doing — that results-based orientation — is key. The thing that I like most about Flywheel is that you brought a really fundamental way of thinking which was very feedback-based and open to experimenting but within reason. With other products, that feedback loop isn’t so built in that it’s very easy to get lost.” – Masumi Nakamura, VP of Engineering at Mercari

Predictive modeling puts the burn on churn

Machine Learning model visualization as a decision tree to predict customer churn

In collaboration with Flywheel, Mercari began analyzing user data in BigQuery via Vertex AI Workbench to identify patterns across churned customers. The teams evaluated a range of attributes like the customer acquisition channel, categories browsed or purchased from, and whether or not they had any saved searches while shopping. Comparing various models and performance metrics, the teams selected the best model for accurately predicting when a buyer or seller was at risk to churn. For sellers, they evaluated audience members by the time elapsed since their last sale – for buyers, the time since their last purchase. 

These churn prediction scores could then be applied to data pipelines that would feed into Flywheel’s audience builder. Audience members with a high likelihood to churn would be segmented into their own group and from there, Mercari could target those users with relevant paid media and email campaigns. 

By partnering with Flywheel, Mercari was able to simultaneously bridge the gap between the data and marketing teams – and reduce the time between segmentation and campaign launch from months to just a few days. 

A view of the user-friendly the Flywheel first-party data platform to build an audience

“One of the big areas of benefit of working with Flywheel was the increased integration of marketing channels such as the CRM, user acquisition, as well as more traditional marketing channels.” – Masumi Nakamura, VP of Engineering at Mercari

Creating the audience within the audience

Once the team had successfully created a model to predict churn across buyers and sellers, Mercari needed to launch retargeting campaigns to measure their ability to reduce churn. Each of their ongoing experiments features tailored segments along with automatic A/B testing. With analytics and activation all under one roof, the marketing team at Mercari could craft audiences and begin measuring the impact of their targeted campaigns. Since starting their work with Flywheel, the Mercari team has created over 120 audiences.

“Our marketing teams are more sophisticated with in-house knowledge, but Flywheel provides a more user-friendly way to build audiences for campaigns.” – Masumi Nakamura, VP of Engineering, Mercari

A summary view of the central “Audience Hub” on the Flywheel first-party data platform

“Flywheel brings a very fundamental way of thinking about problems, including experimentation…. The ability to organize experiments and results was key. The number of variables is too high for most people without good organization.” – Masumi Nakamura, VP of Engineering at Mercari 

Making segmentation smarter

Mercari’s first audiences leveraging Flywheel were sent to Braze to supercharge email campaigns and coupons with churn predictions and automated campaign performance evaluations. Then, Mercari shifted its focus to Facebook for paid media retargeting, using Flywheel’s lifecycle segmentation framework to target customers at the right step in their user journey. Lastly, Mercari moved its focus to Google Ads, where they used Flywheel to implement new segmentation models based on product category propensity. Mercari had long used Google Ads for product listing ads, and with Flywheel, Mercari was able to define more powerful product propensity segments and measure custom incremental lift metrics.

Finding new users in the haystack

Finally, in addition to preventing churn and driving retention, the Mercari team also wanted to boost user acquisition. They were having trouble measuring performance of UA campaigns due to new iOS and Facebook data privacy restrictions that made measuring campaign attribution impossible for many users. Using the familiar stack of Vertex AI Workbench for analysis, performance analysis on campaign data in BigQuery, and Airflow DAGs deployed via Cloud Composer to productionize the data pipelines, Flywheel enabled the team to activate targeted campaigns based on a user’s geographical location. In this way, Mercari could make decisions about their UA campaigns using incrementality analysis between geographic regions rather than attribution data, thus preserving user privacy. 

The Mercari approach to customer data activation and acquisition

Other marketplace retailers can learn from Mercari’s successes activating data from BigQuery with Flywheel. Here are a few best practices to apply:

Identify your team’s needs and existing strengths

Mercari knew that their team had built out a strong foundation for data analysis within BigQuery. They also knew that their process was missing a key component that would allow them to activate that data. In order to achieve similar results, work to evaluate the strength of your team and your data – and define exactly what you aim to achieve with customer segmentation.

Partner with the right providers

With BigQuery, the Mercari team had all of their data centralized in one single location, simplifying the process for predictive modeling, segmentation, and activation. By partnering with Flywheel, this centralized data could be activated with ease across Mercari’s marketing teams. When evaluating providers for data warehousing, segmentation, and activation, be sure to partner with a provider that ensures you can get the most out of your data.

Know your audience

With a deeper understanding of their customers, Mercari was able to see nearly immediate value. By investing in the proper tools to accurately predict customer behavior, Mercari delivered impact in exactly the right areas. Using the data you’ve already compiled on your customers, consider partnering with a customer segmentation platform provider like Flywheel. In fact, Masumi went so far as to organize his Machine Learning team around these concepts: “We split the ML team into two areas – one to augment and work with Flywheel, the other team was to augment and orient around item data.”

Incremental lift in sales on Mercari’s platform by audience. (Scale has been modified to intentionally obfuscate actual results.)

How to boost growth like Mercari in three steps

Today, many leading brands leverage Flywheel Software and BigQuery to drive marketing and sales wins. Whether your company is in retail, financial services, travel, software, or another industry entirely, you can join the growing number of companies driving sustainable growth through real-time analytics by connecting BigQuery from Google Cloud to Flywheel Software. Here’s how:

If you have customer data in BigQuery…

Book a Flywheel Software + BigQuery demo customized to your use cases.

Link your BigQuery tables and marketing and sales destinations to the Flywheel Software platform.

Launch your first Flywheel Software audience in less than one week.

If you are getting started with BigQuery…

Get a Data Strategy Session with a Flywheel Solutions Architect at no cost.

Use our Quick Start Program to get started with BigQuery in 4 to 8 weeks.

Launch your first Flywheel Software audience in less than one week thereafter.

Flywheel and Google: Better together

The key question for many marketers today is, “How do you best leverage all you know about your customers to drive more intelligent and effective marketing engagement?” When Mercari set out to answer this question in 2019, they applied an innovative BigQuery data strategy that leveraged machine learning models. However, they achieved remarkable marketing results because they were among the first companies to discover and apply Flywheel Software to enable the marketing team to launch audiences with a first party data platform directly connected to their datasets and predictions in BigQuery. This greatly accelerated the design-launch-measure feedback loop to generate repeatable growth in customer lifetime value.

The Built with BigQuery advantage for ISVs

Google is helping tech companies like Flywheel Software build innovative applications on Google’s data cloud with simplified access to technology, helpful and dedicated engineering support, and joint go-to-market programs through the Built with BigQuery initiative. Participating companies can: 

Accelerate product design and architecture through access to designated experts from the ISV Center of Excellence, who can provide insight into key use cases, architectural patterns, and best practices. 

Amplify success with joint marketing programs to drive awareness, generate demand, and increase adoption.

BigQuery gives ISVs the advantage of a powerful, highly scalable data warehouse that’s integrated with Google Cloud’s open, secure, sustainable platform. And with a huge partner ecosystem and support for multi-cloud, open source tools and APIs, Google provides technology companies the portability and extensibility they need to avoid data lock-in. 

Click here to learn more about Built with BigQuery.

We want to thank the Google Cloud and Flywheel Software team members who collaborated on the blog:

Mercari: Masumi Nakamura, VP of EngineeringFlywheel Software: Julia Parker, Product Marketing Manager; Alex Cuevas, Head of AnalyticsGoogle: Sujit Khasnis, Solutions Architect

Source : Data Analytics Read More

Best practices of orchestrating Notebooks on Serverless Spark

Best practices of orchestrating Notebooks on Serverless Spark

Data Scientists process data and run machine learning workflows via various distributed processing frameworks and interactive collaborative computing platforms, such as Project Jupyter and Apache Spark. Orchestrating all these workflows is usually done via Apache Airflow.

However, some challenges exist when running enterprise-grade Data Science and Machine Learning workloads in Public Cloud and at scale.

Performance: When it comes to an enterprise application, the size and scale of data and models are complex and tend to grow over time impacting the performance. 

Scalability: The more complex an application gets, the more difficult it is to address capacity limits, bandwidth issues, and traffic spikes. 

Infrastructure and Pricing: For typical enterprise ML deployment, planning and configuring appropriate cluster size, machine type, performance tuning, and maintenance costs are complex. There is a need for more flexible, cost-effective, and manageable solutions that let you focus on the core business logic of ML that matters the most to your business. 

In Google Cloud, Data Engineers and Data Scientists can run Hadoop and Spark workloads on Dataproc and develop Jupyter-based Notebooks on Vertex AI Managed Notebooks. 

With Serverless Spark, you can run any Spark batch workloads including Notebooks without provisioning and managing your own cluster. You can specify your workload parameters or rely on sensible defaults and autoscaling. The service will run the workload on managed compute infrastructure, autoscaling resources as needed. 

With Vertex AI Managed notebook instances, you can develop interactive Notebooks. These instances are prepackaged with JupyterLab and have a preinstalled suite of deep learning packages, including support for the TensorFlow and PyTorch frameworks. Managed notebooks instances support GPU accelerators and the ability to sync with a source repository. Your managed notebooks instances are protected by Google Cloud authentication and authorization. Optionally, idle shutdown can be used to shut down your environment for cost savings while persisting all work and data to Cloud Storage. 

Lastly, Cloud Composer can be used to orchestrate, schedule, and monitor these workflows. 

In this blog, we’ll focus on running any Jupyter-based Notebooks as batch jobs on Serverless Spark.

Scenario: Notebooks lift and shift to Google Cloud

Typically the customers migrate and run their existing Notebooks from on-prem or other cloud providers to Serverless Spark. A Fortune 10 retailer migrated all of their data science workloads from on-premises to Serverless Spark and Vertex AI Managed Notebooks to run retail assortment analysis of 500M+ items daily. 

Notebook migration is a two-step process: 

1. Migrating Notebooks from legacy data lake and staging in Google Cloud Storage (GCS) bucket. 

2. Orchestrating and deploying the staged Notebooks on Serverless Spark. We will primarily focus on JupyterLab-based Notebooks utilizing Spark for ELT/ETL in this blog.

The following diagram depicts the flow of Notebook operations:

Figure 1. Solution Architecture for Running Spark Notebooks on Serverless Spark

Cloud components

Here are some of the typical services used for Notebook development and orchestration:

Vertex AI Workbench comes with the Jupyter Notebook interface, enabling developers to analyze and visualize data interactively. It has integrated capabilities like BigQuery, GCS, and Git integration, all within the Notebook interface that lets users perform various tasks on the UI without leaving the Notebook. For example, when running unit tests, multiple developers can interactively and collaboratively invoke the entire testing workflows and share results and real-time feedback.

The following screenshot shows a sample Spark Notebook that we modified on Vertex AI workbench and orchestrated on Serverless Spark: (vehicle_analytics.ipynb)

Figure 2. Sample Spark lab for vehicle analytics (vehicle_analytics.ipynb)

Serverless Spark uses its own Dynamic Resource Allocation to determine its resource requirements, including autoscaling. 

Cloud Composer is a managed Airflow with Google Cloud Operators, sensors, and probes for orchestrating workloads. Its features ensure seamless orchestration of your Dataproc workloads as well:

Fully Managed: Cloud Composer can automate the entire process of creating, deleting, and managing Dataproc workflow which minimizes the chance of human error.

Integrability with other Google Cloud services: Cloud Composer offers built-in integration for a range of Google products, from BigQuery, Dataflow, Dataproc, Cloud Storage, Pub/Sub, and more.

Scalability: Cloud Composer autoscaling uses the Scaling Factor Target metric to adjust the number of workers, responding to the demands of the scheduled tasks.

Best Practices of Running Notebooks on Serverless Spark

1. Orchestrating Spark Notebooks on Serverless Spark

Instead of manually creating Dataproc jobs from GUI or CLI, you can configure and orchestrate the operations with Google Cloud Dataproc Operators from the open-source Apache Airflow. 

When writing Airflow DAGs, follow these best practices to optimize Cloud Composer process for optimal performance and scalability.

To orchestrate using Cloud Composer, use Dataproc Batch Operator:
DataprocCreateBatchOperator(): This operator runs your workloads on Serverless Spark. 

https://cloud.google.com/composer/docs/composer-2/run-dataproc-workloads#custom-container

This Python script can be submitted to Serverless Spark using the DataprocCreateBatchOperator():

code_block[StructValue([(u’code’, u’with models.DAG(rn ‘composer_pyspark_dags’,rnrn create_batch = DataprocCreateBatchOperator(rn task_id=”notebook_serverless”,rn batch={rn “pyspark_batch”: {rn “main_python_file_uri”: f”gs://{gcs_bucket}/{app_name}/composer_input/jobs/vehicle_analytics_executor.py”,rn “args”: [gcspath_input_notebook, gcspath_output_notebook]rn },rn “environment_config”: {rn “peripherals_config”: {rn “spark_history_server_config”: {rn “dataproc_cluster”: PHS_CLUSTER_PATH,rn },rn },rn },rn },rn batch_id=”batch-create-phs”,rn )rnrn # Define DAG dependencies.rn create_batch’), (u’language’, u”), (u’caption’, <wagtail.wagtailcore.rich_text.RichText object at 0x3ed77154c610>)])]

We suggest you leverage Papermill utility wrapped in a Python script to pass parameters, execute Notebooks and return output to another Notebook like below:

code_block[StructValue([(u’code’, u”import papermill as pmrnrnpm.execute_notebook(rn gcspath_input_notebook, gcspath_output_notebook, kernel_name=’python3′,log_output=True, progress_bar=False, stdout_file=sys.stdout, parameters=params, **kwargs)”), (u’language’, u”), (u’caption’, <wagtail.wagtailcore.rich_text.RichText object at 0x3ed772f49ad0>)])]

2. Installing dependencies and uploading files

If your Notebook requires additional Python packages, you can pass the requirements.txt file path when submitting the batch job to Serverless Spark. For our testing, we added pendulum==2.1.2 in the requirements.txt

You can also add additional Python files, JARs or any other reference files that are in GCS when submitting to Serverless Spark as shown below:

Figure 5. Adding [1] requirement.txt to install Python packages and [2] vehicle_reference.py to run on Notebook (vehicle_analytics.ipynb)

Figure 6. Installing the Python packages in requirement.txt on Notebook (vehicle_analytics.ipynb)

Figure 7. Successful installation of the listed Python packages on Notebook (vehicle_analytics.ipynb)

Figure 8. Successful %run command to execute the vehicel_reference.py on Notebook (vehicle_analytics.ipynb)

3. Spark logging and monitoring using a Persistent History Server

Serverless Spark Batch sessions are ephemeral so any application logs will be lost when the application completes.

Persistent History Server (PHS) enables access to completed Spark application details for the jobs executed on different ephemeral clusters or Serverless Spark. It can list running and completed applications. The application event logs and the YARN container logs of the ephemeral clusters and Serverless Spark are collected in a GCS bucket. These log files are essential for monitoring and troubleshooting. 

Here are the best practices for setting up a PHS:

https://cloud.google.com/blog/products/data-analytics/running-persistent-history-servers

4. Performance tuning

When you submit a Batch job to Serverless Spark, sensible Spark defaults and autoscaling is provided or enabled by default resulting in optimal performance by scaling executors as needed.

If you decide to tune the Spark config and scope based on the job, you can benchmark by customizing the number of executors, executor memory, executor cores and tweak spark.dynamicAllocation to control autoscaling. Please refer to the spark tuning tips.

5. Run multiple Notebooks concurrently

You can submit multiple Notebooks to Serverless Spark concurrently. You can run up to 200 concurrent batch jobs per minute per Google Cloud project per region. For every batch job, you can run with job-scoped Spark configurations for optimal performance.  

Since each Notebook gets separate ephemeral clusters, the performance of one Notebook job does not impact the other Notebook jobs. Configure the PHS cluster when you submit a Spark batch workload to monitor the Spark event logs of all the jobs. 

6. Source control & CI/CD

Notebooks are code, so be sure to maintain them in source control and manage their lifecycle via robust CI/CD processes. Google Cloud Source for version control and Cloud Build can be used for CI/CD (Continuous Integration/Continuous Delivery). 

For source control, it’s common to have a prod (master), dev, and feature branch.

Figure 8. CI/CD Implementation on Production and Development projects

Follow CI best practices, include the build process as the first step in the CI/CD cycle to package the software in a clean environment. 

Stage the artifacts required for the workflow like Notebooks, Python scripts, Cloud Composer DAGs, and the dependencies in a GCS bucket. Code repository branches could be attached to Google Cloud environments, it means for example when commits are made to the master branch, a CI/CD pipeline will trigger a set of pre configured tasks like read the latest code from repo, compile, run the automated unit test validations and deploy the code. 

This helps maintain consistency between code repositories and what is deployed in Google Cloud projects.

We suggest keeping a dedicated bucket to stage the artifacts using CI/CD pipelines and a separate bucket for services like Cloud Composer and Dataproc to access the files so that it doesn’t impact the running Data Science workflows. 

Next steps

If you are interested in running data science batch workloads on Serverless Spark, please see the following labs and resources to get started:

Serverless Spark 

Apache Spark and Jupyter Notebooks on Dataproc

Serverless Spark Workshop

If you are interested in orchestrating Notebooks on Ephemeral Dataproc Cluster using Cloud Composer, check out this example.

Further resources

Explore pricing information on the services mentioned in this solution tutorial:

Serverless Spark

Cloud Composer

Cloud Storage

Vertex AI Workbench

Be sure to stay up-to-date with the latest feature news by following product release notes:

Dataproc

Cloud Composer

Cloud Storage

Vertex AI

Credits: Blake DuBois, Kate Ting, Oscar Pulido, Narasimha Sadineni

Source : Data Analytics Read More

Google named a Leader in the 2023 Forrester Wave: Data Management for Analytics

Google named a Leader in the 2023 Forrester Wave: Data Management for Analytics

We’re excited to announce that Forrester Research has recognized Google as a Leader in The Forrester Wave™: Data Management for Analytics Q1 2023. We believe this is a testimony to Google’s vision and strong track record of delivering continuous product innovation in open data ecosystems, unified data cloud offerings, and built-in intelligence. 

Organizations looking to stay ahead of competitive and economic pressures want to leverage the vast amount of data available today to make informed decisions, improve business process efficiency, and drive innovation. However, with the exponential growth in the amount and types of data, workloads, and users, harnessing the data’s full potential is incredibly complex, while still critical for customers’ success. We take this challenge seriously and are honored by the Forrester Wave recognition. 

Download the complimentary report: The Forrester Wave: Data Management for Analytics, Q1 2023. 

Forrester evaluated 14 data management for analytics (DMA) providers in this report against pre-defined criteria, evaluating them on their current offerings and strategy. In addition to being named a Leader, Google received the highest possible score in 11 different evaluation criteria, including roadmap execution, performance, scalability, data security and visualization.

Google offers a fully managed, serverless [data management for analytics] solution that can scale to hundreds of petabytes using standard SQL. The Forrester Wave™: Data Management for Analytics, Q1 2023

Customers like British Telecom, Vodafone, Carrefour, and tens of thousands of others around the world, have partnered with Google Cloud to drive innovation with a unified, open, and intelligent data ecosystem. 

Unified data management

Google provides a unified data platform that allows organizations to manage every stage of the data lifecycle — from running operational databases for applications to managing analytical workloads across data warehouses and data lakes, to data-driven decision-making, to AI and Machine Learning. How we’ve architected our platform is unique and enables customers to bring together their data, people, and workloads. Our databases are built on highly scalable distributed storage with fully disaggregated resources and high-performance Google-owned global networking. This combination allows us to provide tightly integrated data cloud services across our data cloud products, including Cloud Spanner, Cloud Bigtable, AlloyDB for PostgreSQL, BigQuery, Dataproc, and Dataflow

In the past year, we launched several capabilities that further strengthen these integrations, making it easier for customers to accelerate innovation:

Unified transactional and analytics platform. With change streams, customers can track writes, updates, and deletes to Spanner and Bigtable databases and replicate them to downstream systems such as BigQuery, Pub/Sub, and Cloud Storage. Datastream for BigQuery is now generally available and provides easy replication of data from operational database sources, such as AlloyDB, PostgreSQL, MySQL, and Oracle, directly into BigQuery, allowing you to easily set up an ELT (Extract, Load, Transform) pipeline for low-latency data replication that enables real-time insights.

Unified data of all types. BigLake enables customers to work with data of any type, in any location. This allowed us to deliver object tables, a new table type that provides a structured interface for unstructured data. Object tables let customers natively run analytics and ML on images, audio, and documents, changing the game for data teams worldwide, who can now innovate without limits with all their data in one unified environment.

Unified workloads. We introduced new developer extensions for workloads that require programming beyond SQL. With BigQuery stored procedures for Apache Spark, customers can run Spark programs directly from within BigQuery, unifying transformation, and ingestion and enabling Spark procedures to run as a step in a set of SQL statements. This unification increases productivity and brings costs and billing benefits, as customers only pay for the Spark job duration and resources consumed. 

To help customers further manage data cloud costs, we announced BigQuery editions with three pricing tiers — Standard, Enterprise and Enterprise Plus — for you to choose from, with the ability to mix and match for the right price-performance based on your individual workload needs. 

BigQuery editions come with two innovations. First, compute capacity autoscaling adds fine-grained compute resources in real-time to match the needs of your workload demands, and ensure you only pay for the compute capacity you use. Second, physical bytes billing pricing allows you to only pay for data storage after it’s been highly compressed. With compressed storage pricing, you can reduce your storage costs while increasing your data footprint at the same time.

Open data ecosystem 

Google Cloud provides industry-leading integration with open source and open APIs, which ensures portability, flexibility, and reduces the risk of vendor lock-in. We see customers like PayPal, HSBC, Vodafone, Walmart, and hundreds of others increasingly leverage our suite of migration services to power their data cloud transformation journeys. For example, BigQuery Migration Service has helped hundreds of customers automatically translate over 9 million statements of code from traditional data warehouses to BigQuery, and the comprehensive Database Migration Program accelerates migrations to the cloud with the right expertise, assessments, and financial support. Customers can also take advantage of our managed services that are fully compatible with the most popular open-source engines, such as PostgreSQL, MySQL, and Redis.

And we don’t stop there. We also offer BigQuery Omni, which enables insights to data in other cloud environments, while providing a single pane of glass for analysis, governance, and security.

We continue to focus on making Google Cloud the most open data cloud that can unlock the full potential of your data and remove the barriers to digital transformation. Some recent launches in this area allow you to:

Modernize your PostgreSQL environment. We announced the technology preview of AlloyDB Omni, a downloadable edition of AlloyDB designed to run on-premises, at the edge, across clouds, or even on developer laptops. We also announced a new Database Migration Assessment (DMA) tool, as part of the Database Migration Program. This new tool provides easy-to-understand reports that demonstrate the effort required to move to one of our PostgreSQL databases — whether it’s AlloyDB or Cloud SQL.

Build an open-format data lake. To support data openness, we announced the general availability of BigLake, to help you break down data silos by unifying lakes and warehouses. BigLake innovations add support for Apache Iceberg, which is becoming the standard for open-source table format for data lakes. And soon, we’ll add support for formats including Delta Lake and Hudi.

Bring analytics to your data. To help you analyze data irrespective of where it resides, we launched BigQuery Omni. Recently, we added new capabilities such as cross-cloud transfer and cross-cloud larger query results, which will make it easier to combine and analyze data across cloud environments.

At the same time, we significantly expanded our data cloud partner ecosystem and are increasing partner investments across many new areas. Today, more than 900 software partners are building their products using Google’s Data Cloud, and more than 50 data platform partners offer validated integrations through our Google Cloud Ready – BigQuery initiative. Partners like Starburst are deepening their integration with BigQuery and Dataplex so that customers can bring analytics to their data no matter where it resides, including data lakes, multi and hybrid cloud sources. 

Built-in intelligence

At Google, AI is in our DNA. For two decades, we’ve leveraged the power of AI to organize the world’s information and make it useful to people and businesses everywhere. From enhancing the performance of our Search algorithm with ML, to sharpening content recommendations on YouTube with unsupervised learning, we have constantly leveraged AI to solve some of the toughest challenges in the market.

BigQuery ML, which empowers data analysts to use machine learning through existing SQL tools and skills, saw over 200% growth in usage in 2022. Since BigQuery ML became generally available in 2019, customers have run hundreds of millions of prediction and training queries.

We continue to bring the latest advancements in AI technology to make our data cloud services even more intelligent. Here are a few recent examples:

BigQuery inference engine. We announced BigQuery ML inference engine, which allows you to run predictions not only with popular models formats directly in BigQuery, but also using remotely hosted models and Google’s state-of-the-art pretrained models.

Database system optimizations. Capabilities such as Cloud SQL recommenders and AlloyDB autopilot make it easier for database administrators and DevOps teams to manage performance and cost for large fleets of databases. 

Databases and AI integration. In addition to infusing AI and ML into our products, we have tightly integrated Spanner, AlloyDB, and BigQuery with Vertex AI to simplify the ML experience. With these integrations, AlloyDB and Spanner users can now enable model inferencing directly within the database transaction using SQL. 

Simplified ML Ops. Models created in BigQuery using BigQuery ML are now instantly visible in Vertex AI model registry. You can then directly deploy these models to Vertex AI endpoints for real-time serving, use Vertex AI pipelines to monitor and train models, and view detailed explanations for your predictions through BigQuery ML and Vertex AI integration. 

And of course, we deliver all this on infrastructure built for some of the world’s most demanding workloads. Google Cloud databases and analytics solutions are proven to operate at scale. For example, Spanner consistently processes 2 billion requests per second, and BigQuery customers analyze over 100 terabytes of data per second. 

We look forward to continuing to innovate and partner with you on your digital transformation journey and are honored to be a Leader in the 2023 Forrester Wave™: Data Management for Analytics.

Download the complimentary Forrester Wave™: Data Management for Analytics, Q1 2023 report.

Learn more about how organizations are building their data clouds with Google Cloud solutions. 

Source : Data Analytics Read More

Announcing the public preview of BigQuery change data capture (CDC)

Announcing the public preview of BigQuery change data capture (CDC)

As a famous Greek philosopher once said, “the only constant in life is change,” whether that’s the passing of the seasons, pop culture trends, or your business and the data you use within it. Today, we’re announcing the public preview of BigQuery change data capture (CDC) to meet the evolving demands of your business. This capability joins our existing Datastream for BigQuery solution, which helps you to seamlessly replicate data from relational databases such as MySQL, PostgreSQL, AlloyDB, and Oracle, directly into BigQuery.

Overview

BigQuery first supported data mutations back in 2016 with the introduction of DML statements. Since then, we’ve introduced a host of new DML enhancements, such as increased scalability, improved performance, multi-statement transactions, support of procedural language scripting, etc. Through DML statements, you can orchestrate everything from ELT event post-processing, ensure compliance under GDPR’s right to be forgotten, data wrangling, or even the replication of classically transactional systems into BigQuery. While it’s functionally possible to orchestrate these complex DML pipelines within BigQuery, more often than not, it involves multi-step data replication via temporary tables, periodically running complex DML statements, and/or highly customized application monitoring. While viable, this method isn’t the most user-friendly or aligned with BigQuery’s mission to be a fully-managed enterprise data warehouse. 

To solve these problems, BigQuery now supports Change Data Capture (CDC) natively inside the data warehouse.

Thanks to BigQuery’s native CDC support, customers can directly replicate insert, update, and/or delete changes from source systems into BigQuery without complex DML MERGE-based ETL pipelines. Customers like DaVita, a leader in kidney care, sees value in leveraging this new capability as it provides accelerated access to transactional data within their BigQuery data warehouse. 

“From our testing, BigQuery CDC will enable upserts and efficient query execution without a significant increase in data ingestion time. The low latency helps us effectively manage BQ resources and keep associated costs low. It’s been a big step forward as we work to achieve our goal of near real-time data visualization in our dashboards and reports.” – Alan Cullop, Chief Information Officer, DaVita, Inc.

BigQuery CDC support is available through the BigQuery Storage Write API, BigQuery’s massively scalable and unified real-time data ingestion API. Using this API, you can stream UPSERTs and DELETEs directly into your BigQuery tables. This new end-to-end BigQuery change management functionality is made possible by combining new BigQuery capabilities of non-enforceable primary keys to keep track of unique records, a table’s allowable maximum staleness to tune performance/cost requirements, and _CHANGE_TYPEs to dictate the type of operation performed in order into one easy to use feature.

To natively support CDC, BigQuery accepts a stream of mutations from a source system and continuously applies them to the underlying table. A customizable interval called “max_staleness” allows you to control the rate of applying these changes. max_staleness is a table setting, varying from 0 minutes to 24 hours, and can be thought of as the tolerance for how stale data can be when queried.

When querying a CDC table, BigQuery returns the result based on the value of max_staleness and the time at which the last apply job occurred. For applications with a low tolerance for staleness (i.e., order management systems), the max_staleness setting can be configured so that UPSERTs are applied at a more frequent basis to get the freshest query results. While this means data is more up to date, it can also mean higher costs as apply operations are completed more frequently and consume more compute resources. For other applications that may be more tolerant of staler data (i.e. dashboards), UPSERTs can be applied at a more intermittent frequency, thereby reducing background computational processing and consistently achieving high query performance.

Example

The best way to learn is often by doing, so let’s see BigQuery CDC in action. Suppose we have a media subscription business which maintains a customer dimension table containing important customer information such as the customer name, enrollment date, address, customer tier, and a list of their active subscriptions. As our customers’ engagement and behaviors change over time, we want to ensure this data is available to our sales and support teams to ensure our customers receive the best level of service possible. 

To get started, we’ll first create a table named “customer_records” through the below DDL statement. The DDL also specifies the table’s max_staleness to be 15 minutes, sets the primary key of our table to be the customer_ID field, and clusters the table by the same customer_ID.

code_block[StructValue([(u’code’, u’#Replace CDC_Demo_Dataset with your preferred dataset namernCREATE TABLE `CDC_Demo_Dataset.Customer_Records` (rn Customer_ID INT64 PRIMARY KEY NOT ENFORCED,rn Customer_Enrollment_Date DATE,rn Customer_Name STRING,rn Customer_Address STRING,rn Customer_Tier STRING,rn Active_Subscriptions JSON)rnCLUSTER BYrn Customer_IDrnOPTIONS(max_staleness = INTERVAL 15 MINUTE);’), (u’language’, u”), (u’caption’, <wagtail.wagtailcore.rich_text.RichText object at 0x3e5799d93a50>)])]

Now, we’ll ingest some data via the Storage Write API. In this example, we’ll use Python, so we’ll stream data as protocol buffers. For a quick refresher on working with protocol buffers, here’s a great tutorial

Using Python, we’ll first align our protobuf messages to the table we created using a .proto file in proto2 format. To follow along, download this sample_data.proto file to your developer environment, then run the following command within to update your protocol buffer definition:

code_block[StructValue([(u’code’, u’protoc –python_out=. sample_data.proto’), (u’language’, u”), (u’caption’, <wagtail.wagtailcore.rich_text.RichText object at 0x3e5799d6ac10>)])]

Within your developer environment, use this sample CDC Python script to insert some new example customer records by reading from this new_customers.json file and writing into the customer_records table. This code uses the BigQuery Storage Write API to stream a batch of row data by appending proto2 serialized bytes to the serialzed_rows repeated field like the example below:

code_block[StructValue([(u’code’, u’row = cdc_sample_data_pb2.SampleData()rn row.Customer_ID = 1rn row.Customer_Enrollment_Date = u201c2022-11-05u201drn row.Customer_Name = “Nick”rn row.Customer_Address = “1600 Amphitheatre Pkwy, Mountain View, CA”rn row.Customer_Tier = “Commercial”rn row.Active_Subscriptions = u2018{“Internet_Subscription”:”Trial”, “Music_Subscription”:”Free”}u2019rnproto_rows.serialized_rows.append(row.SerializeToString())’), (u’language’, u”), (u’caption’, <wagtail.wagtailcore.rich_text.RichText object at 0x3e578bcbef90>)])]

BigQuery applies UPSERTs at least once within the interval defined by the `max_staleness` value. So if you immediately query the table after the Python script executes, the table may appear empty because you are querying within the same 15 minute max_staleness window we configured our table for earlier. You could wait for your table’s data to be refreshed in the background or you can modify your table’s max_staleness setting. For demonstration purposes, we’ll update our table’s max_staleness with the following DDL:

code_block[StructValue([(u’code’, u’#Replace CDC_Demo_Dataset with your preferred dataset namernALTER TABLE `CDC_Demo_Dataset.Customer_Records`rnSET OPTIONS (rn max_staleness = INTERVAL 0 MINUTE);’), (u’language’, u”), (u’caption’, <wagtail.wagtailcore.rich_text.RichText object at 0x3e5777288750>)])]

We can now query our table and see it has ingested a few rows from the Storage Write API.

Now that we have some existing data, let’s assume our customers start changing their subscription accounts. Some customers move up from the Commercial to Enterprise tier, some change their address, new customers join, while others close their accounts. We’ll stream these UPSERTs to BigQuery by reading from this modified_customers.json file. To stream this new modified_customers file, simply comment out line 119 from the Python script and uncomment line 120, then re-run the script. 

We can now query our table again and see the modifications have taken effect.

Monitoring and management

Since BigQuery CDC handles applying changes behind the scenes, monitoring and management of BigQuery CDC is significantly easier than a built-it-yourself DML approach. To monitor your table’s UPSERT operational progress, you can query the BigQuery `INFORMATION_SCHEMA.TABLES` view to get the `upsert_stream_apply_watermark` timestamp, which is the timestamp at which your table’s UPSERTs have last been applied.

code_block[StructValue([(u’code’, u’#Replace CDC_Demo_Dataset with your preferred dataset namernSELECTrn upsert_stream_apply_watermarkrnFROM `CDC_Demo_Dataset`.INFORMATION_SCHEMA.TABLESrnWHERErn table_name = “Customer_Records”‘), (u’language’, u”), (u’caption’, <wagtail.wagtailcore.rich_text.RichText object at 0x3e578b1f2d10>)])]

Because CDC apply operations are charged under BigQuery’s analysis pricing model, it may also be beneficial to monitor compute costs. BigQuery’s reservation pricing model may be better suited for tables with frequent CDC operations and/or tables configured with low max_staleness settings. Further details on this can be found within the BigQuery CDC documentation.

Conclusion

As enterprises grow and adopt exciting analytical use cases, your data warehouse must also adapt to your business needs and support the ever-increasing velocity, variety, volume, veracity, and value of data in the modern era. So if you have a requirement for Change Data Capture, give BigQuery CDC a try and embrace change.

Also, if your CDC use case involves replicating transactional databases into BigQuery, be sure to check out Cloud Datastream. We’ve integrated BigQuery CDC within Datastream for BigQuery to seamlessly replicate relational databases directly to BigQuery, so you can get near real-time insights on operational data in a fully managed and serverless manner.

Related Article

Datastream’s PostgreSQL source and BigQuery destination now generally available

Seamless and low-latency replication from operational databases, including PostgreSQL, directly to BigQuery, enabling near real-time insi…

Read Article

Source : Data Analytics Read More

How Dataplex can improve data auditing, security, and access management

How Dataplex can improve data auditing, security, and access management

Data is one of the most important assets of any enterprise. It is essential for making informed decisions, improving efficiency, and providing a competitive edge. However, managing data comes with the responsibility of preventing data misuse. Especially in regulated industries, mishandling data can lead to significant financial and reputational damage. Negative outcomes such as data exfiltration, data access by unauthorized personnel, and inadvertent data deletion can arise if data is mis-managed.

There are multiple ways to help protect data in enterprises. These include encryption, controlling access, and data backup. Encryption is the process of encoding data into ciphertext. If done right, this makes it impossible for unauthorized users to decode the data without the correct key. Access control is the process of limiting access to data to authorized users only. Lastly, being able to audit your data management actions can help in proving that you are following the current regulations that affect your company while protecting one of your core competitive advantages.

It is important to choose the right security solutions for your enterprise. The potential cost of a data breach needs to be considered against the cost of protecting your data. Data security is an ongoing process. It is important to regularly review and update your security processes and tools. 

In this blog post, we discuss how you can discover, classify, and protect your most sensitive data using Cloud DLP, Dataplex, and the Dataplex Catalog and Attribute Store. This solution automates complex and costly data practices so you can focus on empowering your customers with data.

In most organizations, data is gathered regularly and this data can fall into one of two categories:

1. Sensitive data for which a specific policy needs to be attached to it according to the contents of the data (e.g. bank account numbers, personal email addresses). These data classifications are generally defined based upon:

a) Applicable regulatory or legal requirements
b) Critical security or resilience requirements
c) Business specific requirements (e.g., IP)

2. Non-sensitive data

In order to protect sensitive data and be able to follow the compliance requirements of your industry, at Google Cloud we recommend the usage of the following tools:

Data Loss Prevention (Cloud DLP) helps developers and security teams discover, classify and inventory the data they have stored in a Google Cloud service. This allows you to gain insights about your data in order to better protect against threats like unauthorized exfiltration or access. Google Cloud DLP provides a unified data protection solution that applies consistent policies to data in a hybrid multi-cloud environment. It can also de-identify, redact or tokenize your data in order to make it shareable or usable across products and services.

Dataplex is a fully managed data lake service that helps you manage and govern your data in Google Cloud. It is a scalable metadata management service that empowers you to quickly discover, manage, understand and govern all your data in Google Cloud.

Cloud DLP integrates natively with Dataplex. When you use a Cloud DLP action to scan your BigQuery tables for sensitive data, it can send results directly to Data Catalog in the form of a tag template.

This guide outlines the process of sending Cloud DLP results to Dataplex Catalog.

Furthermore, to define how certain data should be treated we are also providing the ability to associate data with attributes through Dataplex’s Attribute Store. This functionality represents a major shift in the approach to governing data as, previously, governance policies could only be defined at the domain level. Now, customers can support compliance with regulations, such as GDPR, by defining data classes, such as Personal Identifiable Information ‘PII data’, mapping the relevant PII attributes, and then defining the associated governance policies.

With Google Cloud, customers can govern distributed data at scale. Dataplex drastically increases the efficiency of policy propagation by mapping access control policies to tables and columns, and applying them to data in Cloud Storage and BigQuery. 

Further guidance on how to set up attributes can be found here.

Since Attribute Store, currently in Preview, supports tables published by Dataplex (in a Cloud Storage bucket, mounted as an asset in Dataplex). Soon, we expect Attribute Store will be able to attach attributes to any table. 

A reference architecture is shown below, outlining the best practice for securing data using Attribute Store, in conjunction with Data Catalog tags which provide an explanation of the data.

In the above diagram, we see that Table columns are both informationally tagged (using Data Catalog) and associated with an attribute (using Attribute Store). Attribution tagging helps facilitate data protection at scale while the Data Catalog uses tags to describe the data and enhance searchability. 

It is important to note that Data Catalog tags are indexed. Therefore, we begin the process by creating this matching DLP infoType for the relevant Data Catalog Tag and Attribute. Then, when DLP matches the infoType, a Data Catalog Tag is created and an Attribute is associated with the data.

Implementing this approach to discovering, classifying, and protecting your organization’s data can help to ensure that you handle this incredibly valuable asset accordingly.

Next steps

To learn more, please refer to the Dataplex technical documentation or contact the Google Cloud sales team.

Source : Data Analytics Read More

Unify your data assets with an open analytics lakehouse

Unify your data assets with an open analytics lakehouse

For over a decade, the technology industry has searched for ways to store and analyze vast amounts of data that can handle an organization’s volume, latency, resilience, and varying data access requirements. Companies have been making the best of existing technology stacks to tackle these issues, which typically involves trying to either make a data lake behave like an interactive data warehouse or make a data warehouse act like a data lake — processing and storing vast amounts of semi-structured data. Both approaches have resulted in unhappy users, high costs, and data duplication across the enterprise. 

The need for architecture designed to address complex data needs for all users including data analysts, data engineers, and data scientists. 

Historically for analytics, organizations have implemented different solutions for different data use cases: data warehouses for storing and analyzing structured aggregate data primarily used for business intelligence (BI) and reporting, and data lakes for unstructured and semi-structured data, in large volumes, primarily used for data exploration and machine learning (ML) workloads. This approach often resulted in extensive data movement, processing, and duplication, requiring complex extract, transform, and load (ETL) pipelines. Operationalizing and governing this architecture took time and effort and reduced agility. As organizations move to the cloud, they want to break these silos.

Moving to the cloud brings otherwise disparate data sources together and paves the way for everyone to become part of the data and AI ecosystem. It is undeniable that organizations want to leverage data science capabilities at scale, but many still need to realize their return on investments. According to a recent study, 91% of organizations increase investments in data and AI. Yet only 20% see their models go into production deployment. Business Users, Data Analysts, Data Engineers, and Data Scientists want to become part of the Data and AI ecosystem.

The rise of the analytics lakehouse

Google Cloud’s analytics lakehouse combines the key benefits of data lakes and data warehouses without the overhead of each.  We discuss the architecture in detail throughout the “Build an analytics lakehouse on Google Cloud” technical whitepaper. However, in a nutshell, this end-to-end architecture enables organizations to extract data in real-time regardless of which cloud or datastore the data resides in and use it in aggregate for greater insight and artificial intelligence (AI), with governance and unified access across teams.

By breaking the barriers between data sources and providing serverless architectures, the game becomes choosing the optimal processing framework that suits your skills and business requirements. Here are the building blocks of the analytics lakehouse architecture to simplify the experience, while removing silos, risk, and cost:

What makes Google’s analytics lakehouse approach unique?

Google’s analytics lakehouse is not a completely new product but is built on Google’s trusted services such as Cloud Storage, BigQuery, Dataproc, Dataflow, Looker, Dataplex, Vertex AI and others. Leveraging Google Cloud’s resiliency, durability, and scalability, Google enables customers to innovate faster with an open, unified, intelligent data platform. This data platform is the foundation for Google’s analytics lakehouse, which blurs the lines between traditional data warehouses and data lakes to provide customers with both benefits. Bring your analytics to your data wherever it resides with the
the analytics lakehouse architecture. These architecture components include: 

Ingestion: Users can ingest data from various sources, including but not limited to real-time streams, change logs directly from transactional systems, and structured, semi-structured, and unstructured data on files.

Data processing: Data is then processed and moved onto a series of zones. First, data is stored as is within the raw zone. The next layer can handle typical ETL/ELT operations such as data cleansing, enrichment, filtering, and other transformations within the enriched zone. Finally, business-level aggregates are stored in the curated layer for consumption.

Flexible storage options: An analytics lakehouse approach which allows users to leverage open-source Apache Parquet, Iceberg, and BigQuery managed storage, Providing users with the storage options and meeting them where they are based on their requirements.

Data consumption: At any stage, data can be accessed directly from BigQuery, Serverless Spark, Apache Beam, BI tools, or Machine Learning (ML) applications. Providing the choice of compute platforms with unified serverless applications, organizations can leverage any framework that meets their needs. Data consumption does not impact processing due to the complete separation of compute and storage. Users are free to choose serverless applications and run queries within seconds. In addition, the lakehouse provides the dynamic platform to scale advanced new use cases with data-science use cases. With built-in ML inside the lakehouse, you can accelerate time to value.

Data governance: A unified data governance layer provides a centralized place to manage, monitor, and govern your data in the lakehouse and make this data securely accessible to various analytics and data science tools.

FinOps: Google’s Data Cloud can auto adjust fluctuations in demand and can intelligently manage capacity, so you don’t pay for more than you use. Capabilities include dynamic autoscaling, in combination with right-fitting, which saves up to 40% in committed compute capacity for query analysis.

“BigQuery’s flexible support for pricing allows PayPal to consolidate data as a lakehouse. Compressed storage along with autoscale options in BigQuery help us provide scalable data processing pipelines and data usage in a cost-effective manner to our user community.”  — Bala Natarajan, VP Enterprise Data Platforms at PayPal 

Freedom of ‘data architecture’ choice without more data silos

Every organization has its own data culture and capabilities. Yet each is expected to use popular technology and solutions like everyone else. Your organization may be built on years of legacy applications, and you may have developed a considerable amount of expertise and knowledge, yet you may be asked to adopt a new approach based on the latest technology trend. On the other end of the spectrum, you may come from a digital-native organization with no legacy systems at all, but be expected to follow the same principles as process-driven, established organizations. The question is, should you use data processing technology that doesn’t match your organization style, or should you focus on leveraging your culture and skills?

At Google Cloud, we believe in providing choice to our customers — the option of an open platform that minimizes dependencies on a specific framework, vendor, or file format. Not only organizations, but also the teams in each organization, should be able to leverage their skills and do what’s right for them. Let’s go against the school of thought, how about we decouple storage and compute and we do this physically rather than just logically unlike most of the solutions. At the same time, we remove the computational needs with fully managed serverless applications as mentioned earlier. Then the game becomes leveraging the optimal application framework to solve your data challenges to meet your business requirements. In this way, you can capitalize on your team’s skill sets and improve time to market.  

Organizations that want to build their analytics lakehouse using open-source technologies can easily do so by using low-cost object storage provided by Cloud Storage or from other clouds — storing data in open formats like Parquet and Iceberg, for example. Processing engines and frameworks like Spark and Hadoop use these and many other file types, and can be run on Dataproc or regular virtual machines (VMs) to enable transactions. This open-source-based solution has the benefits of portability, community support, and flexibility (though it requires extra effort in terms of  configuration, tuning, and scaling). Alternatively, Dataproc is a managed version of Hadoop, which minimizes the management overhead of Hadoop systems, while still being able to access non-proprietary, open-source data types.

Bring ML to your data

There are many users within an organization who have a part to play in the end-to-end data lifecycle. Consider a data analyst, who can simply write SQL queries to create data pipelines and analyze insights from BigQuery. Or a data scientist who dabbles with different aspects of building and validating models. Or an ML engineer who is responsible for the model to work without issues to end users in production systems. Users like data engineers, data analysts, and data scientists all have different needs, and we have intentionally built a comprehensive platform for them in mind.

Google Cloud also offers cloud-native tools to build an analytics lakehouse with the cost and performance benefits of the cloud. These include a few key pieces that we will discuss throughout the whitepaper:

Different storage options and optimizations depending on the data sources and end users consuming the data.

Several serverless and stateful compute engines, balancing the benefits of speed and costs as required by each use case for processing and analytics.

Democratized and self-service BI and ML tools, to maximize the value of data stored in the lakehouse.

Governance, ensuring productive and accountable use of data so that bureaucracy does not inhibit innovation and enablement.

Advanced analytics and AI

BigQuery supports predictive analytics through BigQuery ML, an in-database ML capability for ML training and predictions using SQL. It helps users with classification, regression, time-series forecasting, anomaly detection, and recommendation use cases. Users can also do predictive analytics with unstructured data for vision and text, leveraging Google’s state-of-the-art pre-trained model services like Vertex Vision, Natural Language Processing (Text) and Translate. This can be extended to video and text, with BigQuery’s built-in batch ML inference engine, which enables users to bring their own models to BigQuery, thereby simplifying data pipeline creation. Users can also leverage Vertex AI and third-party frameworks. 

Generative AI is a powerful and emerging technology but organizations are lacking a way to easily activate AI and move from experimentation into production. Integration with Cloud AI for Generative AIwill embed advanced text analysis with your analytics lakehouse. This opens up new possibilities for your data teams to use AI for sentiment analysis, data classification, enrichment, and language translations. 

Automate orchestration of repeatable tasks

Underpinning these architectural components is resilient automation and orchestration of repeatable tasks. With automation, as data moves through the system, improved accuracy instills confidence in end users to trust it, making them more likely to interact with and evangelize the analytics lakehouse. 

To learn more about the analytics lakehouse on Google Cloud, download the complimentary white paper. 

Further resources

Learn how Squarespace reduces the number of escalations by 87% with the analytics lakehouse.

Learn how Dun & Bradstreet improved performance by 5X with the analytics lakehouse.

Source : Data Analytics Read More