It’s undeniable: Live service games (“live games”) are the future of the games industry. In 2022, the top 10 most played games were all live, continuously delighting players with new content, features, and gameplay. Today, the live service model is prevalent across all console, PC and mobile platforms and genres. And with a projected 3.6 billion players by 2024, the opportunity for live games has never been larger.
Google is no stranger to this model, operating some of the world’s largest live services like Google Search and YouTube to billions of users around the world. Likewise, Google Cloud is committed to bringing the best of Google to game developers who are delivering live game experiences to players everywhere.
We already work with most of the top-grossing game companies. In our journey with them, we’ve learned we need to help developers unite performance and understanding via three critical undertakings:
Serve players everywhere.
Collect and organize game data.
Unlock player and game insights.
Here’s how.
Serve players everywhere
Live games just have to work. Google Cloud helps developers connect players with game servers built on the world’s largest, most secure network.
Take, for example, game launches. It’s a hard problem because it requires developers to effectively bet on how successful their game will be before launch. “Will I attract a thousand players? A million? More? At the same time?” Ironically, the nightmare scenario is often extraordinary success: being unable to serve players who would have played your game had they been able.
Success shouldn’t worry a game developer. To that end, one of the most important capabilities Google Cloud can provide is scale. Kubernetes is recognized as one of the best ways to handle computing at massive scale and no one knows it better than us — we founded the project and continue to be its most prolific contributor.
With our deep knowledge of Kubernetes, we built Google Kubernetes Engine (GKE), which gives game developers the capability and confidence to serve even the largest player audiences. It’s the most scalable and automated managed Kubernetes service, capable of running 15,000+ node clusters, outscaling other cloud providers by as much as 10x.
While GKE works for a range of compute tasks, we know workloads for live games are unique. That’s why we partnered with Ubisoft to create Agones, an open-source game server orchestrator for Kubernetes. Using Agones with GKE enables developers to focus on player experience instead of infrastructure.
At Ubisoft we needed a centralized, standard solution for game servers. We partnered with Google Cloud to develop Agones as a result, maximizing players’ engagement and trust over time. Pierre Romagné VP Engineering and Platform, Ubisoft
Collect and organize game data
Live games can’t forget player progress. Google Cloud helps developers secure player experiences without having to worry about scale or performance.
Live service games are persistent. Players earn levels, add friends, buy skins. Even the smallest bits of data can be prized by players, down to every shot they made (“How accurate am I getting?”). Multiply this desire with the potential for a live game to have millions of concurrent players all over the world. The challenge seems daunting.
Leveraging our vast experience with our own live services, we created Cloud Spanner to fully address data scalability. Spanner provides a single, logical, horizontally scalable database that can process 2+ billion requests per second. This means game developers don’t have to compromise between performance, manageability, and scale (no more sharding!). They can have a single database that scales to handle the largest player audiences.
At any given time, we have about 5,000 Spanner nodes handling traffic… All of them work together to support millions of players playing all across the world at a given moment. James Prompanya Sr. Engineering Manager, Pokémon GO, Niantic
Beyond scale, Spanner can also reduce costs (up to 50%) while improving player experience through latency reduction (up to 25%). That way, for example, when a player unlocks a new skin, they can equip it immediately.
Unlock player and game insights
Live games need to continuously evolve in the right direction. Google Cloud helps developers understand what’s working to find and retain players with Google’s analytics and AI.
There are over 3 billion players in the world, and they come in all shapes and sizes. To delight them, developers need to understand what works and segment players accordingly. Take, for example, Square Enix, a global games publisher. They’re using data and analytics to build a “single gamer view” to understand and engage their players, resulting in increased playtime. That means more opportunities to monetize.
BigQuery is a catalyst for generating insights and is a killer app among large game developers. It’s used by nearly all of Google Cloud’s top game companies. When it comes to data analytics BQ is OP, helping developers analyze and unite huge amounts of player and game data. From predicting the success of a new feature to personalizing offers based on player behavior, BigQuery helps game companies find answers to questions they may not even have thought to ask. Or thought who to ask. BigQuery is designed for approachability, so employees across the business can generate insights using data previously locked in silos. BigQuery goes further with built-in ML and Vertex AI to unlock insights across the organization.
Powering an everlasting love for the game
At Google Cloud, we believe that a live game’s success should depend on the strength of the game’s enjoyment, not limited to the strength of its infrastructure. That’s why we’re building an ecosystem for live games that unifies understanding and performance.
Google Cloud for Games is an ecosystem that includes not just Google Cloud, but also solutions from enablers like Ubitus, Incredibuild, HeroicCloud, and Unity.
We are excited to work with Google to offer developers our suite of Unity Gaming Services which provides the most robust tools and infrastructure to build, launch, and grow games seamlessly at a global scale Jeff Collins SVP & GM of Unity Gaming Services, Unity
Solutions across this ecosystem work best when they work together as a cohesive whole. While there are standouts, the winningest MVP is backed by a well oiled team; just like a squad, clan, or raid group.
Knowledge graphs are inevitably built with incomplete information, complete knowledge being somewhat hard to come by. Knowledge graphs stored in Neo4j Graph Database can be enriched with data from Google Enterprise Knowledge Graph to provide more complete information.
Knowledge graphs enriched in this way contain more information, enabling the systems that use them to answer more questions. Those downstream systems can then make more accurate business decisions and provide better customer experiences.
In this blog post, we’ll demonstrate how to use Neo4j in conjunction with Google Enterprise Knowledge Graph to enrich a knowledge graph.
Neo4j
Neo4j Aura is the leading graph database. It is available on Google Cloud Marketplace. Neo4j Aura is the only graph database embedded in the Google Cloud Console. Neo4j AuraDS (Data Science) includes three components:
Neo4j Graph Database (GDB) – Graph database for storing, retrieving and managing data natively as graphs
The Entity Reconciliation API lets customers build their own private Knowledge Graph with data stored in BigQuery.
Google Knowledge Graph Search API lets customers search for more information about their entities, such as official name, types, description, etc.
Architecture
The easiest way to enrich a knowledge graph stored in Neo4j Aura with Google Enterprise Knowledge Graph is to access both tools via Python APIs from Vertex AI Workbench. The architecture for such a system is shown below
Example with Private Equity Data
To illustrate this architecture, we’re going to look at some data from ApeVue, a data provider for private equity markets information. ApeVue aggregates price data on pre-IPO companies from a variety of private equity brokers and distributes market consensus prices and index benchmarks based on that information.
For this example we’re going to construct a knowledge graph in Neo4j Aura from some CSV files provided by ApeVue. These files cover the ApeVue50 Benchmark Index and its constituent companies. An iPython notebook that runs the load is available here. You’re more than welcome to run it yourself!
When complete, we can inspect the graph and see the index and subindices. One way to do that graphically is with Neo4j Browser. You can open that from within the Neo4j Aura console.
Now, we run the query:
MATCH (n:Sector) RETURN n
The result is a view of all the sectors in the data set, in this case 14 of them.
We can click on any of those sectors to view the companies which are part of it as well:
Similarly, we can search for specific items within our knowledge graph and then view the neighborhood around them. For instance, we can search for Neo4j by running the Cypher query:
MATCH (n:Company {name: ‘Neo4j’}) return n
When complete, expanding the neighborhood around the Neo4j node gives an interesting view of how it relates to other firms and investors:
In this case, we can see that Neo4j has a number of investors (the blue nodes). One of these is named “GV Management Company, LLC,” previously known as Google Ventures.
Enriching the Data with Enterprise Knowledge Graph
Our knowledge graph is pretty interesting in and of itself. But we can make it better. There’s no way to view the graph underlying Enterprise Knowledge Graph. However, we can query that graph and use it to enrich the knowledge graph we’ve built in Neo4j. In this case, we’re going to pass the company name into the API and get the description of that company back. We’ll then add a new property called “description” to each “Company” node in the Neo4j database.
That’s done via some Python code running in Vertex AI Workbench. A notebook showing an example of this is available here. The main part of that is the call to the Cloud Knowledge Graph API here:
Once we’ve run through the notebook, it’s possible to inspect the enriched data set in Neo4j. For instance, if we query for “Neo4j” again in our knowledge graph, we’ll see it now has a property called description:
What we’ve done here is take the best of both worlds. We’ve leveraged Google’s incredible expertise in search and knowledge aggregation with Neo4j’s market leading ability to store, query and visually represent data as graphs. The result is a very powerful way to build custom knowledge graphs.
Exploring the Knowledge Graph
Now that we’ve loaded and enriched our data, let’s explore it. To do so we’ll use Neo4j Bloom, a graph specific business intelligence tool.
First off, let’s take a look at the companies and graphs:
Here we can see our 14 sectors as the orange dots. A few sectors only have one company as part of them but others have many. Rerunning the search to include our investors, we now get a much more crowded view:
We can use the Neo4j Graph Data Science component to better make sense of this picture. Computing the betweenness centrality on the graph gives us this view.
In it we’ve sized nodes according to their score. One surprising thing in this is that the investors aren’t what’s important. Rather, the companies and sectors are the main connecting points in our graph.
We can also add filters to our perspective. For instance, we can filter to see what companies had a return of 10% or greater in the last month. That gives us this view:
Zooming in on that view, we can identify a firm that invested in four of those companies that returned 10% or greater.
This is a small subset of what’s possible with Bloom. We invite you to explore this data on your own!
Conclusion
In this blog post we loaded a dataset provided by ApeVue into Neo4j AuraDS. AuraDS is Neo4j’s managed service, running on Google Cloud Platform. The data we loaded consisted of the ApeVue50 index, including return, depth and open interest data. We queried the data using Neo4j Cypher and Browser. We enriched that dataset with queries to Google Enterprise Knowledge Graph. Finally, we explored the dataset using Neo4j Bloom.
The enriched knowledge graph gives us a more complete view of the private equity data. Downstream systems using this knowledge graph would have access, not just to return investor and sector information, but also to a natural language description of what the company does. This could be used to power conversational agents or be fed into full text searches of the data set.
Systems that use Neo4j and Google Enterprise Knowledge Graph can provide better insights and understanding of connected information than otherwise possible. Downstream systems can then make more accurate business decisions and provide better customer experiences.
You can find the notebooks we used on GitHub here.
If you’d like to learn more about the dataset, please reach out to Nick Fusco and the team at ApeVue (contact@apevue.com). For information on Neo4j, please reach out to ecosystem@neo4j.com with any questions.
We thank the many Google Cloud and Neo4j team members who contributed to this collaboration.
When it comes to cloud-based content management, collaboration, and file sharing tools for businesses and individuals, Box, Inc. is a recognized leader. Recently, we decided to migrate from Apache HBase, a distributed, scalable, big data store deployed on-premises, to Cloud Bigtable, Google Cloud’s HBase-compatible NoSQL database. By doing so, we achieved the many benefits of a cloud-managed database: reduced operational maintenance work on HBase, flexible scaling, decreased costs and an 85% smaller storage footprint. At the same time, the move allowed us to enable BigQuery, Google Cloud’s enterprise data warehouse, and run our database across multiple geographical regions.
But how? Adopting Cloud Bigtable meant migrating one of Box’s most critical services, whose secure file upload and download functionality is core to its content cloud. It also meant migrating over 600 TB of data with zero downtime. Read on to learn how we did it, and the benefits we’re ultimately enjoying.
Background
Historically, Box has used HBase to store customer file metadata with the schema in the table below. This provides us a mapping from a file to a file’s physical storage locations. This metadata is managed by a service called Storage Service, which runs on Kubernetes; this metadata is used on every upload and download at Box. For some context on our scale: at the start of the migration we had multiple HBase clusters that each stored over 600 billion rows and 200 terabytes of data. Additionally, these clusters received around 15,000 writes per second and 20,000 reads per second, but could scale to serve millions of requests for analytical jobs or higher loads.
Our HBase architecture consisted of three fully replicated clusters spread across different geographical regions: Two active clusters for high availability, and another to handle routine maintenance. Each regional Storage Service wrote to its local HBase cluster and those modifications were replicated out to other regions. On reads, Storage Service first fetched from the local HBase cluster and fell back onto other clusters if there was a replication delay.
Preparing to migrate
To choose the best Bigtable cluster configuration for our use case, we ran performance tests and asynchronous reads and writes before the migration. You can learn more about this on the Box blog here.
Since Bigtable requires no maintenance downtime, we decided to merge our three HBase clusters down to just two Bigtable clusters in separate regions for disaster recovery. That was a big benefit, but now we needed to figure out the best way to merge three replicas into two replicas!
Theoretically, the metadata in all three of our HBase clusters should have been the same because of partitioned writes and guaranteed replication. However, in practice, metadata across all the clusters had drifted, and Box’s Storage Service handled these inconsistencies upon read. Thus, during the backfill phase of the migration, we decided to take snapshots of each HBase cluster and import them into Bigtable. But we were unsure about whether to overlay the snapshots or to import the snapshots to separate clusters.
To decide on how to merge three clusters to two, we ran the Google-provided Multiverse Scan Job, a customized MapReduce job that sequentially scans HBase table snapshots in parallel. This allowed us to effectively perform a sort-merge-join of the three tables and compare rows and cells for differences between the three HBase clusters. While the job scanned the entire table, a random 10% of critical rows were compared. This job took 160 Dataproc worker nodes and ran for four days. Then, we imported the differences into BigQuery for analysis.
We found that inconsistencies fell into three categories:
Missing rows in an HBase cluster
A row existed, but was missing columns in an HBase cluster
A row existed, but had differing non-critical columns in an HBase cluster
This exercise helped us decide that consolidating all three snapshots into one would provide us with the most consistent copy, and to have Bigtable replication handle importing the data into the secondary Bigtable cluster. This would resolve any issues with missing columns or rows.
Migration plan
So, how do you migrate trillions of rows into a live database? Based on our previous experience migrating a smaller database into Bigtable, we decided to implement synchronous modifications. In other words, every successful HBase modification would result in the same Bigtable modification. If either step failed, the overall request would be considered a failure, guaranteeing atomicity. For example, when a write to HBase succeeded, we would issue a write to Bigtable, serializing the operations. This increased the total latency of writes to the sum of a write to HBase and Bigtable. However, we determined that was an acceptable tradeoff, as doing parallel writes to both these databases would have introduced complex logic in Box’s Storage Service.
One complexity was that Box’s Storage Service performed many check-and-modify operations. These couldn’t be mirrored in Bigtable for the duration of migration where Bigtable had not been backfilled, and consequently check-and-modify operations would differ from the HBase check-and-modifies. For this reason, we decided to rely on the result of the HBase check-and-modify, and would only perform the modification if the HBase check-and-modify succeeded.
Rollout plan
To roll out synchronous modifications safely, we needed to control it by both percentage and region. For example, our rollout plan for a region looked like the following:
1% region 15% region 125% region 150% region 1100% region 1
Synchronous modifications ensured that Bigtable had all new data written to it. However, we still needed to backfill the old data. After running synchronous modifications for a week and observing no instabilities, we were ready to take the three HBase snapshots and move onto the import phase.
Bigtable import: Backfilling data
We had three HBase snapshots of 200TB each. We needed to import these into Bigtable using the Google-provided Dataproc Import Job. This job had to be run carefully since we were fully dependent on the performance of the Bigtable cluster. If we overloaded our Bigtable cluster, we would immediately see adverse customer impact — an increase in user traffic latency. In fact, our snapshots were so large that we scaled up our Bigtable cluster to 500 nodes to avoid any performance issues. We then began to import each snapshot sequentially. An import of this size was completely unknown to us so we controlled the rate of import by slowly increasing the size of the Dataproc cluster and monitoring Bigtable user traffic latencies.
Validation
Before we could start relying on reads from Bigtable, there was a sequence of validations that had to happen. If any row was incorrect, this could lead to negative customer impact. The size of our clusters made it impossible to do validation on every single row. Instead we took three separate approaches to validation to gain confidence on the migration:
On every read, we asynchronously read from Bigtable and added logging and metrics to notify us of any differences. The one caveat with this approach was that we have a lot of reads that are immediately followed by an update. This approach created a lot of noise, since all of the differences we surfaced were from modifications that happened in between the HBase read and the Bigtable read.
During this read validation we discovered that Bigtable regex scans were different from HBase regex scans. For one, Bigtable only supports “equals” regex comparators. Also, the Bigtable Regex uses RE2 which treats “.” (any character, which unless specified excludes newline) differently than HBase. Thus, we had to roll out a specific regex for Bigtable scans and validate that they were returning the expected results.
2. Sync validation: Run a Dataproc job with hash comparison between Bigtable and HBase
This validation job, similar to the one found here, performed a comparison of hashes across Bigtable and HBase rows. We ran it on a sample of 3% of the rows and uncovered a 0.1% mismatch. We printed these mismatches and analyzed them. Most of these mismatches were from optimistic modifications to certain columns and found that no re-import or correction was needed.
3. Customer perspective validation
We wanted to perform an application-level validation to see what customers would be seeing instead of a database-level validation.
We wrote a job to scan the whole filesystem that would queue up objects where we would call an endpoint in Storage Service that would compare the entry in Bigtable and HBase. For more information, check out this Box blog.
This validation supported the output of the Sync Validation job. We didn’t find any differences that weren’t explained above.
Flipping to Bigtable
All these validations gave us the confidence to return reads from Bigtable instead of HBase. We kept synchronous dual modifications to HBase on as a backup, in case we needed to roll anything back. After returning only Bigtable data, we were finally ready to turn off modifications to HBase. At this point Bigtable became our source of truth.
Thumbs up to Bigtable
Since completing the migration to Bigtable, here are some benefits we’ve observed.
Speed of development
We now have full control of scaling up and down Bigtable clusters. We turned on Bigtable autoscaling, which automatically increases or decreases our clusters given CPU and storage utilization parameters. We were never able to do this before with physical hardware. This has allowed our team to develop quickly without impacting our customers.
Our team now has much less overhead related to managing our database. In the past, we would constantly have to move around HBase traffic to perform security patches. Now, we don’t need to worry about managing that at all.
Finally, MapReduce jobs that would take days in the past now finish under 24 hours.
Cost savings
Before Bigtable, we were running three fully replicated clusters. With Bigtable, we are able to run one primary cluster that takes in all the requests, and one replicated secondary cluster that we could use if there were any issues with the primary cluster. Besides, for disaster recovery, the secondary cluster is extremely useful to our team to run data analysis jobs.
Then, with autoscaling, we can run our secondary cluster much more lightly until we need to run a job, at which point it self-scales. The secondary cluster runs with 25% less nodes than the primary cluster. When we used HBase, all three of our clusters were sized evenly.
New analysis tools
We ported all our HBase MapReduce jobs over to Bigtable, and found that Bigtable has provided us with parity in functionality with minor configuration changes to our existing jobs.
Bigtable has also enabled us to use the Google Cloud ecosystem:
We were able to add Bigtable as an external BigQuery source. This allowed us to query our tables in real time, which was never possible in HBase. This application was best suited to our small tables. Care should be taken with running queries on a production Bigtable cluster due to impact on CPU utilization. App profiles may be used to isolate traffic to secondary clusters.
For our larger tables we decided to import them into BigQuery through a Dataproc job. This enabled us to pull ad hoc analytics data without running any extra jobs. Further, querying BigQuery is also much faster than running MapReduce jobs.
Long story short, migrating to Bigtable was a big job, but with all the benefits we’ve gained, we’re very glad we did!
Considering a move to Bigtable? Find more information about migrations and Google Cloud supported tools:
To some extent, business is a practice in trial and error. You start with a business plan and try to cover all your bases. Then, you make adjustments based on what’s working within your business model— and what isn’t.
Sometimes, however, the factors that are slowing down your business’s growth aren’t obvious. It’s important to get an objective look at where there are shortcomings in your business model. That’s where modern data tools come in.
Businesses are creating data all the time. Data points might include the number of pageviews on a website, the length of time it takes an employee to complete a specific task, or social media likes. Each business creates different data points, which can be collected and used to help guide strategy.
Data is an important tool for businesses because it allows them to identify opportunities, track trends, and gain powerful insights. It can be used for all kinds of applications, from solving a business’s operational problems to improving its marketing strategy. It can even be used to detect fraud.
Business data analysis used to be extremely expensive and impractical for all but the largest corporations. Fortunately, however, it’s become much more accessible, even for small businesses. Today, there is user-friendly software available that even the smallest business can use.
Setting Up Your Data Collection
If you haven’t done so already, the first step is to pick out software that will collect your data so you can use it. Some website builders have analytics built in, but many businesses need something more robust.
There are lots of great options to choose from and many are quite affordable. It’s a good idea to do a little research before you choose the software you want to use, as it might be difficult to switch later.
Using Data to Find Shortcomings & Opportunities
No business model is perfect. All you can do is use the data that’s available to you at the time you start your business and make your best projections. However, once your business is up and running, it’s important to reevaluate your business model on a continual basis.
Data analysis begins with a dataset— and usually, the bigger the better. More data typically makes the insights you’ll gain more reliable. However, if you’ve only just started to track your data, you can still use it to find shortcomings in your business model.
Next, you need to ask a question. For example: where could we improve efficiency in everyday operations? Then, you would be able to turn to the data and see where time (and money) was wasted.
For example, a doctor’s office might notice that the wait times when patients arrive at their appointments is excessive and it’s causing frustration for both staff and patients. If they collect enough data, they can see the average wait time and see which variables affect how long a patient will have to wait. Then, they could adjust how they schedule or check patients in to help solve the problem and increase customer happiness while decreasing staff stress.
Hospitals also frequently use data to lower the cost of care and find operational inefficiencies. It’s important to be specific in regards to your goals and the questions you use to guide your analysis. That way, you can isolate problems and better understand what is causing them.
Understand That Not All Data is Useful
Data can be the most valuable tool for your business, period. It can also be completely useless if you don’t recognize poor-quality data. Analyzing poor-quality data is a waste of time that can cost your business.
It’s important to understand that not all data is useful. Concentrate on the data that can help you solve problems or otherwise improve your business and don’t worry about the rest.
Data Can Help You Gain a Competitive Edge
Business data analysis has many potential benefits, regardless of your industry and business model. Large companies rely on data to help guide decision-making and improve overall performance.
Small businesses can gain a competitive edge by using data in their decision-making process. It can be difficult to compete in today’s marketplace if you’re relying on instinct alone. Data can help your business survive and thrive in a competitive landscape!
However, many workplaces are still trying to figure out how to leverage business intelligence effectively. This technology offers many potential benefits, but many companies don’t fully take advantage of the opportunities it provides. Companies that think outside the box tend to get better results with BI. Those that do their research and take advantage of the right BI and analytics tools also get better results
If you’re looking to integrate Embedded BI into your organization’s workflow, it can be a powerful tool that can improve decision-making processes and increase efficiencies. A knowledgeable BI vendor can help you identify the applications where BI could add the most value, explore your options, and develop a plan for implementation.
Business Intelligence is a Vital Asset to Many Organizations and Embedded BI Tools Can Help
Embedded BI is the integration of BI features directly into other applications, such as customer relationship management (CRM), enterprise resource planning (ERP), or human resources management (HRM) systems. This integration provides users with real-time access to data and insights, allowing them to make informed decisions without switching between applications. As Tableau points out, the purpose of enterprise BI is to provide a comprehensive view of the business across the entire organization.
The benefits of Embedded BI are clear. By bringing intelligence to the point of decision-making, organizations can improve their decision-making processes and increase efficiency. Here are some of the key benefits:
Improved Productivity: Embedded BI allows users to access data and insights directly within the applications they use every day. This eliminates the need for them to switch between applications, saving time and improving productivity.
Increased Adoption: Since users are already familiar with the application in which BI is embedded, they are more likely to adopt the new feature. This can lead to higher user engagement and more informed decision-making across the organization.
Customization: With Embedded BI, organizations can tailor the BI features to fit their specific needs. This allows them to create a custom experience that aligns with their workflows and business processes.
Cost-Effective: Embedded BI is often more cost-effective than purchasing a standalone BI solution. It eliminates the need for additional licenses, infrastructure, and maintenance costs.
Scalability: Embedded BI can be easily scaled to meet the needs of growing organizations. Since it is integrated directly into the application, it can handle increased data volumes and user traffic without compromising performance.
Real-time Insights: With Embedded BI, users have access to real-time data and insights. This allows them to make informed decisions quickly, without waiting for reports or analysis.
In summary, Embedded BI is a game-changer for organizations looking to improve their decision-making processes. By bringing intelligence to the point of decision-making, organizations can increase efficiency, improve productivity, and make better-informed decisions.
Embedded BI Pays Huge Dividends to Organizations of All Sizes
If you’re interested in implementing Embedded BI for your organization, start by identifying the applications where BI could add the most value. Then, work with a BI vendor to explore your options and develop a plan for implementation. With the right approach, you can transform the way your organization uses data to make decisions. You just need to follow the guidelines listed above.
Big data technology used to be a luxury for small business owners. It helps companies operate more efficiently, tap larger markets of customers, and solve some of their most complex challenges.
In 2023, big data Is no longer a luxury. It is an essential resource that companies have to utilize. One survey from March 2020 showed that 67% of small businesses spend at least $10,000 every year on data analytics technology. Of course, this was before countless businesses started implementing work-from-home policies or targeting customers online. Since so many companies went digital during the pandemic, that figure has probably increased over the last few years.
Big data is essential for small businesses since the economy is poised for a possible recession, which can make it even more difficult for struggling businesses to stay afloat.
Cash flow concerns are also becoming more prominent as the economy gears up for a recession. Companies which require immediate business funding are using data analytics tools to research and better understand their options.
However, there are even more important benefits of using big data during a bad economy. As a result, they will need to invest in data analytics tools to sustain a competitive edge in the face of growing economic uncertainty.
Big Data Can Help Companies Persevere in the Face of the Recession
Big data technology can offer enormous benefits for companies. Kaneshwari Patil wrote an article for Nasscom Insights about the reasons companies should invest in big data during the recession.
Patil points out that companies often make reckless decisions when they are worried about the state of the economy. For example, they may impulsively lay off workers or discontinue important projects, even though those decisions might have serious long-term ramifications.
Businesses need to make sensible, well-thought-out decisions to prepare for economic challenges. Patil and other experts argue that big data can help them with this.
What are the biggest reasons Big Data can help companies trying to be more resilient during a recession?
Big data offers many benefits for companies in any economy. These benefits become even more important when tight cash flow and inflation threaten them. Some of these benefits include the following.
Big data helps businesses address cash flow needs
A growing number of companies use big data technology to improve their financing. They can use data mining tools to evaluate the average interest rate of different lenders. They can also look for correlations between various variables that influence funding, so they can better position themselves to get better funding opportunities.
Data analytics helps companies make better pricing decisions
Anybody who has ever taken a business class understands the four “P’s” of marketing. These factors are place, promotion, product, and price. Many business school professors will tell you that price is the most important because it is the only factor that directly impacts revenue. Therefore, every business must set its prices carefully to maximize revenue and maintain a decent profit margin.
Big data technology can significantly improve the company’s pricing strategy. Walter Bater and his colleagues at McKinsey wrote an article on the benefits data-driven pricing provides. Big data algorithms can evaluate a variety of factors, including economic conditions, supply and demand changes in the market, seasonal patterns, and recent changes to the company’s brand position.
Many businesses need help making good pricing decisions during a recession because it is difficult to gauge how customers will change their purchasing patterns. Therefore, data-driven pricing may be even more critical during a bad economy.
Data mining helps companies better understand their target markets
Every business needs to carefully understand its target market. This is true in any economy. However, it becomes even more vital during a recession.
Consumer behavior and priorities change when the economy takes a turn for the worse. The cost of not understanding their behavior is also higher. Most companies will have much thinner profit margins or may even be losing money. Their losses may be much steeper if they are not highly responsive to customer preferences.
Therefore, it is a good idea for companies to use data mining techniques to learn as much as possible about their customers during a bad economy. One of the best tactics is to use data mining tools to learn more about customers on social media. They can find out what customers say about their brand and priorities. This helps companies adapt to meet their changing expectations.
Predictive analytics technology can help companies forecast demand
One of the biggest challenges businesses face in any economy is predicting demand for their products or services. This challenge becomes even more significant When the economy takes a nosedive since the market is likely to change considerably.
Many different factors influence demand for any product. Therefore, it is a good idea to have predictive analytics models that account for these variables. More advanced predictive analytics tools consider economic conditions when forecasting customer purchasing patterns.
Big data is very important for companies trying to stay afloat during a recession
The economy has been uncertain in recent months and is likely to plummet in the near future. Fortunately, small businesses can use big data technology to be more resilient. They should utilize the abovementioned big data strategies to build their brands and maintain profitability.
Retail companies put geospatial data to use to solve all manner of challenges. Data that is tied to location is vital to understanding customers and solving business problems. Say you’re a Director of Leasing who needs to choose the location for a new store. You’ll need to know your potential customers’ demographics, the products being sold by competitors, foot-traffic patterns — but all that data would be essentially useless if it wasn’t tied to a spatial location.
Adding the spatial dimension to your data unlocks new potential, but also adds a degree of complexity. Geospatial data requires map-based visualizations, unique functions and procedures, and far more storage space than your average data. This is why Location Intelligence platforms like CARTO, and peta-byte scale data warehouses like BigQuery are an essential part of a business that wants to use geospatial data to solve their business problems.
CARTO for Retail is a set of platform components and analytical functions that have been developed to assist Retail companies with their geospatial data. The CARTO for Retail functions are deployed directly in BigQuery, and combine spatial analytics with BigQuery Machine Learning tools to run predictions and analysis in the same location as your data. TheCARTO for Retail Reference Guide goes into extensive detail about this solution, which we’ll dive into below.
CARTO Platform Components
The CARTO platform provides a set of capabilities that, when combined with the processing power of BigQuery, form the CARTO for Retail Solution. Below is an illustration of the components in play:
Visualization
The CARTO Builder is a web-based drag-and-drop analysis tool that allows you to quickly see your geospatial data on a map. You can do discovery analyses with the built-in spatial functions, which push the processing down to BigQuery without any configuration required on your end. If you do want to put your hands on the commands that are sent to BigQuery, you can open the SQL interface and edit the code directly. This makes the CARTO Builder an excellent tool for rapid-prototyping geospatial applications.
Once you’re ready to add advanced application features like fine-grained access controls or custom filtering, you can add to your prototype’s code using the deck.gl framework (this is what CARTO uses on the backend) and CARTO for React. They also provide some helpful templates at that link to get you started.
Data
While most companies generate some of their own geospatial data, very few have the means (think hundreds of thousands of drones in the sky on a daily basis) to generate the full picture. How about adding some location data to your location data? CARTO’s Data Observatory provides curated 3rd party data (some free, most for purchase) including socio-demographics, Points of Interest, foot & road traffic, behavioral data or credit card transactions. All the data is already hosted in BigQuery, so it’s easy to merge with your existing data. BigQuery itself also has a number of publicly available geospatial datasets, including OpenStreetMap.
Analytics
There are a series of retail-specific User Defined Functions and stored procedures within the CARTO Analytics Toolbox. These procedures, called the CARTO’s Analytics Toolbox for BigQuery can be accessed through the CARTO platform, or directly in the BigQuery console. Leveraging the massive computing power of BigQuery, you can do the following analyses:
Clustering Analysis to Identify the optimal store locations by geographically clustering customers, competitors and existing stores.
Commercial Hotspots Models to focus on the most effective areas for expansion, based on the surrounding retail fabric.
Whitespace Analysis Routines to identify the best potential locations, where expected revenue is higher than top performing stores, and where key business criteria are met.
Twin Areas Analysis ML-driven analytics to focus network expansion strategies on the most similar locations to the best performing stores.
Store Revenue Prediction A trained Machine Learning model to predict the annual revenue of a planned store location.
Store Cannibalization A model to estimate the overlap of areas and spatial features that a new store would have with the existing store network.
Example
Now let’s see the CARTO for Retail components in action. Our goal for this example is to identify similar areas (known as twin areas) in Texas to match a particular high-performing store in Austin. We first create a connection to BigQuery using a service account.
Next, we need to create our data model using the carto.BUILD_REVENUE_MODEL_DATAfunction. This function takes in stores, revenue data, and competitors, then creates an evaluation grid to find twin areas, trade areas (which can be any polygon such as a radius, drive time, or custom created polygon), and desired enrichment variables. Below is an example of this function:
code_block[StructValue([(u’code’, u”CALL `carto-un`.carto.BUILD_REVENUE_MODEL_DATA(rn — Stores: revenue, store, geomrn ”’rn SELECT id as store, revenue, geom FROM project.dataset.stores_tablern ”’,rn — Stores information variables – optionalrn NULL,rn — Competitors: competitor, geomrn ”’rn SELECT id as competitor, geom FROM project.dataset.competitors_tablern ”’,rn — Area of interest: geomrn ”’rn SELECT state_geom as geom FROM `bigquery-public-data.geo_us_boundaries.states` WHERE state_name IN (‘Texas’, ‘Arizona’)rn ”’,rn — Grid params: grid type and levelrn ‘h3’, 7,rn — Decay params: kring size and decay functionrn 1, ”,rn — Data Observatory enrichmentrn [(‘total_pop_3200daaa’, ‘sum’), (‘households_3cda72a3’, ‘sum’), (‘median_age_fb9fb9a’, ‘sum’), (‘pop_25_years_ov_3eb5c867’, ‘sum’), (‘median_income_20186485’, ‘avg’), (‘income_200000_o_6cda1f8a’, ‘sum’), (‘median_rent_37636cdd’, ‘sum’), (‘families_with_y_228e5b1c’, ‘sum’), (’employed_pop_7fe50b6c’, ‘sum’)],rn ‘carto-data.CARTO_DO_USER_ID’,rn — Custom data enrichmentrn NULL, NULL,rn — Output destination prefixrn ‘project.dataset.retail_model_texas’rn);”), (u’language’, u”), (u’caption’, <wagtail.wagtailcore.rich_text.RichText object at 0x3e4e7ec14610>)])]
Finally, we can predict our twin areas. We pick a target index which we can identify from our map. As we can see here, this cell is the top performing store we want to find similar areas to.
From here we can run our Twin Areas model, which is based on Principal Component Analysis (PCA). We provide a query containing our target H3 cell, a second query of the cells we want to target to study (any cell without a store in Texas), and several other arguments to fine tune our results:
code_block[StructValue([(u’code’, u”CALL `carto-un`.carto.FIND_TWIN_AREAS(rn — Input queriesrn ”’SELECT * FROM `project.dataset.retail_model_texas` WHERE index = ‘87489e262ffffff’ ”’,rn ”’SELECT * FROM `project.dataset.forrest.retail_model_texas` WHERE revenue_avg = 0”’,rn — Twin areas model inputsrn ‘index’,rn 0.75,rn NULL,rn ‘project.dataset.twin_area_texas’rn);”), (u’language’, u”), (u’caption’, <wagtail.wagtailcore.rich_text.RichText object at 0x3e4e94d0bc10>)])]
The result is this interactive map which shows us the top areas that will likely perform the most similar to our target store based on our geospatial factors. We can also include other store factors in our first step to add site specific details like square footage or year built.
What’s Next
Believe it or not, there are even more tools and functions that can help you make the most of your geospatial data, which are explored in the CARTO for Retail Reference Guide. There’s the Bigquery Tiler, and CARTO’s out-of-the-box Site Selection Application, which includes relevant 3rd party data, advanced map visualizations and embedded models to pinpoint the best locations for network expansion.
In addition to the CARTO Analytics Toolbox, BigQuery also has many additional GIS functions for analyzing your geospatial data. Check out this blog on optimizing your spatial storage clustering in BigQuery. If you’re looking to analyze raster data, or can’t find the dataset you need in CARTO’s data observatory, consider trying Google Earth Engine.
Glean searches across all your company’s apps to help you find exactly what you need and discover the information you need to do your best work. It delivers powerful, unified enterprise search across all workplace applications, websites, and data sources used within an enterprise. Search results respect the existing permissions from your company’s systems, so users only see what they already have permission to see. Glean’s enterprise search also takes into account your role, projects, collaborators, and the language and acronyms specific to your company to deliver highly personalized results that provide you with information most pertinent to you and your work. This greatly reduces time spent searching, helping you be more productive and experience less frustrations at work finding what you need to progress.
Why Google Cloud is foundational for Glean
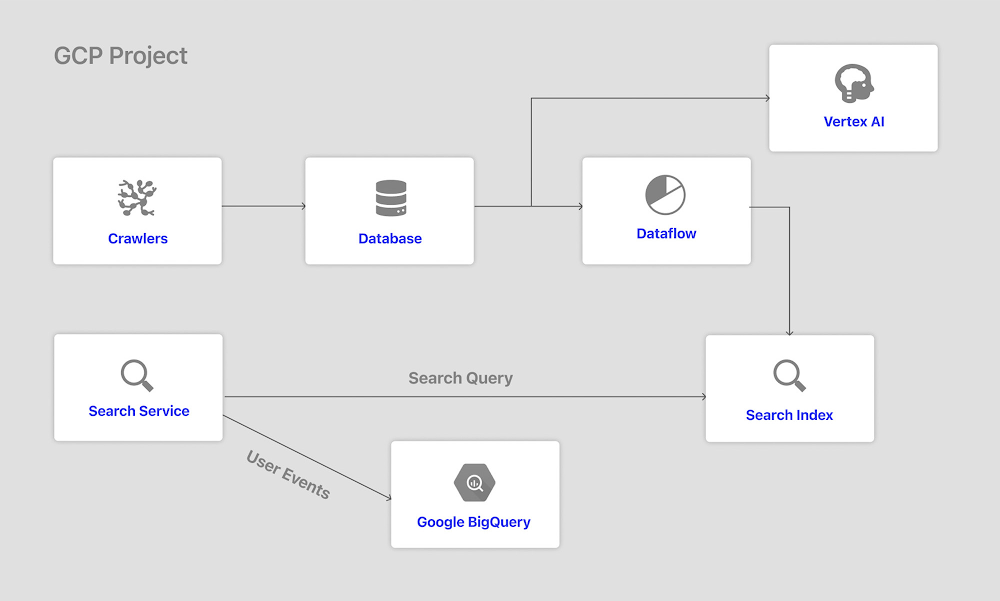
Crucial to the performance of Glean’s powerful and personalized enterprise search is the technology behind it. Glean is built on Google Cloud (see diagram 1) and leverages Google’s data cloud – a modern data stack with components such as BigQuery, DataFlow, and Vertex AI.
Use case 1: Processing and enriching pipelines of data through Dataflow.
Glean uses Google Cloud Dataflow to extract the relevant pieces from the content indexed from different sources of workplace knowledge. It then augments the data with various relevance signals before storing them in the search index that’s hosted in the project’s Google Kubernetes Engine. Additionally, Glean uses Dataflow to generate training data at scale for our models (also trained on Google Cloud). As a whole, Google Cloud Dataflow enables Glean to build complex and flexible data processing pipelines that autoscale efficiently when processing large corpuses of data.
Use case 2: Running analytical workloads with BigQuery and Looker Studio
Glean closely measures and optimizes the satisfaction of users who are using the product to find information. This involves understanding the actions taken by the Glean user in a session and identifying when the user was able to find content useful to them in the search results, as opposed to when the results were not helpful for the user. In order to compute this metric, Glean stores the anonymized actions taken in the product in BigQuery and uses BigQuery queries to compute user satisfaction metrics. These metrics are then visualized by building a product dashboard over the BigQuery data using Looker Studio.
Use case 3: Running ML models with VertexAI.
Glean is able to train state-of-the-art language models adapted to enterprise/domain-specific language at scale by using TPUs through Vertex AI.
TPUs, or Tensor Processing Units, are custom-designed hardware accelerators developed by Google specifically for machine learning workloads. TPUs are designed to speed up and optimize the training and inference of deep neural networks.
Google offers TPUs as a cloud-based service to its customers, which enables users to train and run machine learning models at a much faster rate than traditional CPUs or GPUs. Compared to traditional hardware, TPUs have several advantages, including higher performance, lower power consumption, and better cost efficiency. TPUs are also designed to work seamlessly with other Google Cloud services, such as TensorFlow, which is a popular open-source machine learning framework. This makes it easy for developers and data scientists to build, train, and deploy machine learning models using TPUs on Google Cloud.
Training data derived from the enterprise corpora is used to do domain-adaptive pretraining and task-specific fine-tuning on large-scale models with flexibility enabled by Vertex AI. Search is additionally powered by vector search served with encoders and (Artificial Neural Networks) ANN indices trained and built through Vertex AI.
A collaborative solution
What is the joint solution and what does it look like arch diagram
Glean offers a variety of features and services for its users:
Feature 1: Search across all your company’s apps.
Glean understands context, language, behavior, and relationships with others, to constantly learn about what you need and instantly find personalized answers to your questions. For instance, Glean factors in signals like docs shared with you, documents trending in your team, the office you are based in, the applications you use the most, and the most common questions being asked and answered in the various communication apps to surface documents and answers that are relevant to your search query. In order to provide this personalized experience, Glean understands the interactions between enterprise users as well as actions performed relevant to information discovery. It uses Cloud Dataflow to join these signals with the parsed information from the different applications, and trains semantic embeddings using the information on Vertex AI.
Feature 2: Discover the things you should know
Glean makes it easy to get things done by surfacing the information you need to know and the people you need to meet. This is effectively a recommendation engine for end users that surfaces data and knowledge that is contextually relevant for them. Glean leverages the vector embeddings trained using Vertex AI to be able recommend relevant enterprise information to employees that are timely and contextually relevant.
Feature 3: Glean is easy to use and ready to go, right out of the box.
It connects with all the apps you already use, so employees can continue working with the tools they already know and love. Glean uses fully-managed and auto-scalable Google Cloud components like App Engine, Kubernetes and Cloud Tasks to ensure high reliability and low operational overhead for the infrastructure components of the search stack.
Glean uses a variety of Google Cloud components to build the product, including:
Cloud GKE
Cloud Dataflow
Cloud SQL
Cloud Storage
Cloud PubSub
Cloud KMS
Cloud Tasks
Cloud DNS
Cloud IAM
Compute Engine
Vertex AI
BigQuery
Stackdriver Logging/Monitoring/Tracing
Building the product on top of these components provides Glean with a reliable, secure, scalable and cost-effective platform. It enables us to focus on the core application and relevance features, and helps us stand out.
Building better data products with Google Cloud
Glean trusts Google Cloud as our principal and unique cloud provider. This is mainly because of four factors:
Factor 1: Security
Google Cloud provides fine-grained IAM roles as well as various security features such as Cloud Armor, IAP based authentication, encryption by default, key management service, shielded VMs and private Google access that enables Glean to have a hardened, least-privilege configuration where the customer is fully in control of the data and has a full view into the access to the system.
Factor 2: Reliable and scalable infrastructure services
With fully managed services that auto-scale like GKE, Cloud SQL, Cloud Storage, and Cloud Dataflow, we can focus on the core application logic and not worry about the system being unable to handle peak load or uptime of the system, nor worry about needing to manually down-scale the system during periods of low use for cost efficiency.
Factor 3: Advanced data processing, analytics and AI/ML capabilities
For a search and discovery product like Glean, it’s very important to be able to make use of flexible data processing and analytics features in a cost effective manner. Glean builds on top of Google Cloud features like Cloud Dataflow, Vertex AI, and BigQuery to provide a highly personalized and relevant product experience to its users.
Factor 4: Support
The Google Cloud team has been a true partner to Glean and has been providing prompt support of any production issues or questions we have about the Google Cloud feature set. They’re also highly receptive to feedback and direct interaction with the product group to influence the product roadmap through new features.
Conclusion
At time of writing, Glean is one of over 800 tech companies powering their products and businesses using data cloud products from Google, such as BigQuery, Dataflow, Vertex AI. Google’s Built with BigQuery initiative, helps ISVs like Glean get started building applications using data and machine learning products and continue to add additional levels of capabilities with additional product features. By providing dedicated access to technology, expertise, and go-to-market programs, the Google Built-with initiatives (BigQuery, Google AI, etc.) can help tech companies accelerate, optimize and amplify their success.
Glean’s enterprise search and knowledge management solutions are built on Google Cloud. By partnering with Google Cloud, Glean leverages an all-in-one cloud platform for data collection, data transformation, storage, analytics and machine learning capabilities.
Through Built with BigQuery, Google is enabling, and co-innovating with tech companies like Glean to unlock product capabilities and build innovative applications using Google’s data cloud and AI products that simplify access to the underlying technology, receive helpful and dedicated engineering support, and engage in joint go-to-market programs. Participating companies can:
Get started fast with a Google-funded, pre-configured sandbox.
Accelerate product design and architecture through access to designated experts from the ISV Center of Excellence for Data Analytics and AI, who can provide insight into key use cases, architectural patterns and best practices
Amplify success with joint marketing programs to drive awareness and generate demand, and increase adoption
We would like to thank Smitha Venkat and Eugenio Scafati on the Google team for contributing to this blog.
Every company aims to be data driven, but bringing accurate data in front of the right stakeholders in a timely manner can be quite complex. The challenge arises even more when the source data resides in different technologies, with various access interfaces and data formats.
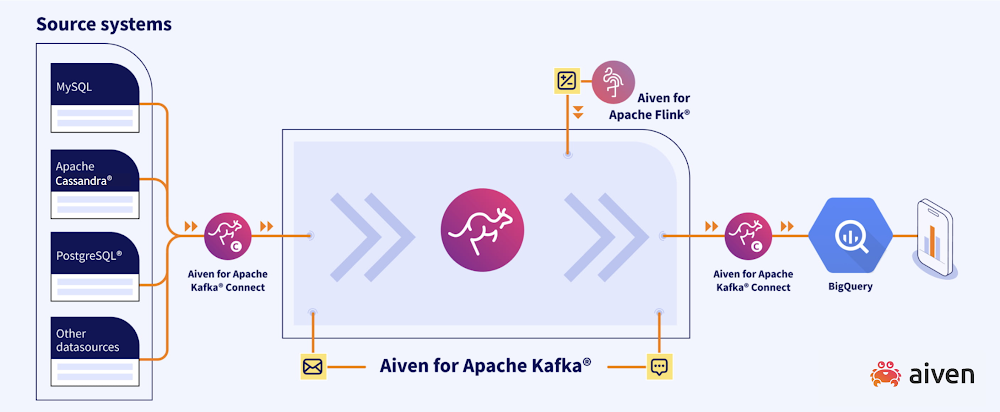
This is where the combination of Aiven for Apache Kafka® and Google BigQuery excels, by providing the ability to source the data from a wide ecosystem of tools and, in streaming mode, push it to BigQuery where datasets can be organized, manipulated and queried.
From data sources to Apache Kafka with Kafka Connect
Aiven, together with Apache Kafka, offers the ability to create a managed Kafka Connect cluster. Therange of 30+ connectors available enables integrating Kafka with a wide set of various technologies as both source and sink using a JSON configuration file. Even more, if the connector for the particular technology needed isn’t in the list, an integration with a self-managed Kafka Connect cluster provides complete freedom on the connector selection, while keeping the benefit of the fully-managed Apache Kafka cluster.
If the datasource is a database, connectors like the Debezium source for PostgreSQL can enable a reliable and fast change data capture mechanism using the native database replication features, thereby adding minimal load on the source system.
Data in Apache Kafka
During the ingestion phase, to optimize throughput, connectors can use the Avro data format and store the data’s schema in Karapace, Aiven’s open source tool for schema registry and REST API endpoints.
Data in Apache Kafka is stored in topics which can have an associated retention period defining the amount of time or space for which the data will be kept. The topics can be read by one or more consumers independently or in competition as part of the same application (“consumer group” in Apache Kafka terms).
If some reshaping of the data is needed, before it lands on the target datastore, Aiven for Apache Flink allows, in streaming mode, to perform such transformations by using SQL statements. Cleansing or enrichment projects with data coming from different technologies are common examples.
Push data to Google BigQuery
Once the data is in the right shape to be analyzed, the Apache Kafka topic can be pushed to BigQuery in streaming mode using the dedicated sink connector. The connector has a wide range of configuration options including the timestamp to be used for partitioning and the thread pool size defining the number of concurrent writing threads.
The data, coming in streaming mode via Apache Kafka, is now landed in one or more BigQuery tables, ready for further analysis and processing. BigQuery offers a rich set of SQL functions allowing to parse nested datasets, apply complex geographical transformations, and even train and use machine learning models amongst others. The depth of BigQuery SQL functions enable analysts, data engineers and scientists to perform their work in a unique platform using the common SQL language.
A streaming solution for fast analytics
With the wide set of source connectors available and its streaming capabilities, Aiven for Apache Kafka is the perfect fit to enable the data to flow from a huge variety of data sources to BigQuery for analytics.
One example of a customer using this pattern is the retail media platform Streaem, part of Wunderman Thompson. Streaem provides a self-service retail media platform for retailers and their brands to monetise areas of their site and in store digital assets by combining intelligence about their products and signals from their customers along with campaign information provided by advertisers. For example, a user might type “Coke” into a search box, and as well as seeing the regular results they will also see some sponsored listings. Then, as they browse around the site, there could be promoted products based on their previous interaction.
Streaem are fully committed to using Google Cloud as their platform of choice, but their technology is event-driven and based around Kafka as a message broker which is not natively available. Using Aiven’s Apache Kafka offering on top of Google Cloud lets Streaem get the best of both worlds; industry-standard event streaming on their preferred cloud, without the headache of managing Kafka themselves. With multiple microservices deployed, all of which need a consistent and up-to-date view of the world, Kafka is an obvious service to place at the center of their world to make sure everything has the latest information in a way which will scale effortlessly as Streaem itself reaches new heights.
“At Streaem we use Kafka as a core part of our platform where event-based data is a key enabler for the services we deliver to our clients” says Garry Turkington, CTO. “Using hosted data services on GCP allows us to focus on our core business logic while we rely on Aiven to deliver a high-performance and reliable platform we can trust.”
Analytics is still a challenge in a Kafka-only world, so Streaem uses a managed open-source Kafka Connector on the Aiven platform to stream the microservices data into Google BigQuery. This means that data about customer activity or keyword auctions or anything else in the live platform are available with low latency into BigQuery, powering Streaem’s reporting dashboards and providing up-to-date aggregations for live decisions to be made. By using Google Cloud Platform, Aiven for Apache Kafka, and BigQuery, Streaem can be confident that their production systems are running smoothly whilst they concentrate their efforts on growing their business.
Other use cases
Aiven for Apache Kafka along with Google Cloud BigQuery is driving crucial insights across a range of industry verticals and use cases. For example:
Retail: Demand Planning with BQML, Recommendation Engines, Product Search
Aiven is leveraged at a large European retail chain for open source database and event streaming infrastructure (Aiven for Apache Kafka, Aiven for OpenSearch, Aiven for Postgres, Aiven for Redis). The data is then fed to trained models in BigQuery ML to recommend products to purchase. These models can be exposed as APIs managed in Vertex AI for production applications.
E-commerce: Real-Time Dynamic Pricing
A global travel booking site uses Aiven for data streaming infrastructure (Aiven for Apache Kafka), handling global pricing and demand data in near real-time, and Aiven for OpenSearch for SIEM and application search use cases. Data then flows into BigQuery for analytics, giving the customer a best-in-class enterprise data warehouse.
Gaming: Player Analytics
Aiven powers data streaming (via Aiven for Apache Kafka) for a Fortune 500 gaming company, supporting multiple gaming titles and more than 100 million players globally. Analytics in BigQuery drives critical insights using player metadata.
Conclusion / Next Steps
The combination of Aiven for Apache Kafka and Google BigQuery drives analytics on the latest data in near real time, minimizing the time to insight and maximizing the impact. Customers of Aiven and Google are already taking advantage of this powerful combination, and seeing the benefits to their business. If you would like to experience this for yourself, sign up for Aiven and use the following links to learn more:
Aiven for Apache Kafka to discover the features, plans and options available for a managed Apache Kafka service