Customers who work with data warehouses, running BI on large datasets used to have to pick low latency but trading off freshness of data. With BigQuery BI Engine, they can accelerate their dashboards and reports that connect to BigQuery without having to sacrifice freshness of the data. Using the latest insights helps them make better decisions for the business. BI Engine enables customers to be able to get “formula one” performance for their queries across all BI tools that connect with BigQuery, thereby helping them leverage existing investments.
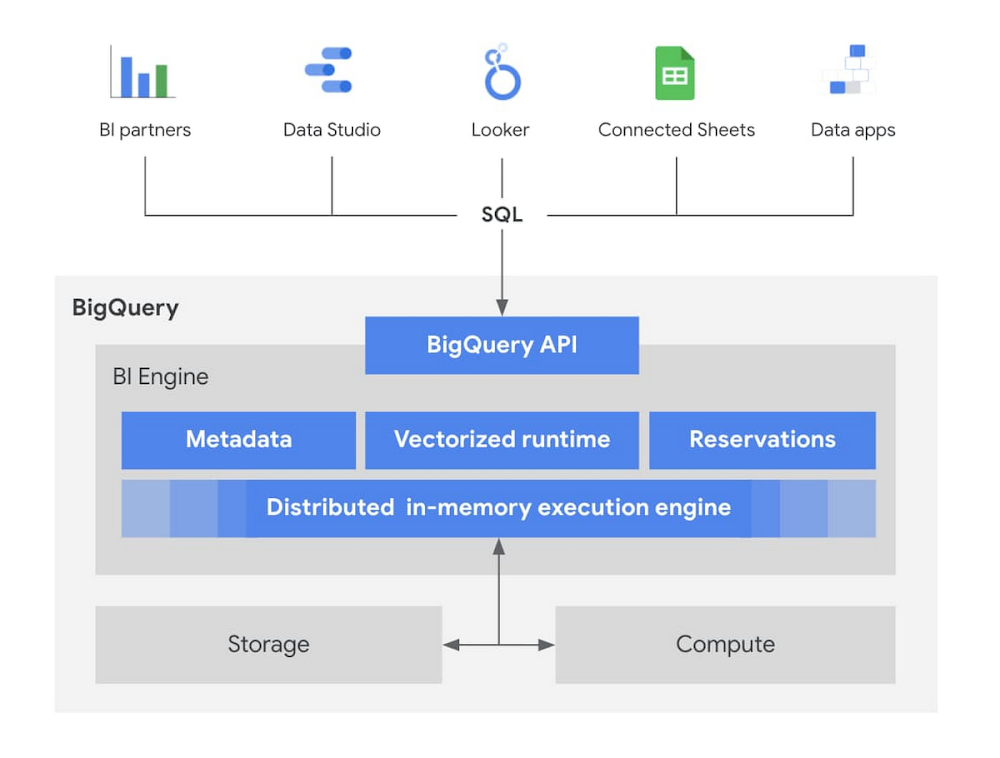
Last year, we launched a preview of BigQuery BI Engine, a fast in-memory analysis service that accelerates and provides sub-second query performance for dashboards and reports that connect to BigQuery. BI Engine works with any BI or custom dashboarding tool. This was designed to help analysts identify trends faster, reduce risk, match the pace of customer demand, and improve operational efficiency in an ever-changing business climate. With this launch, customers were able to build fast, interactive dashboards using any of the popular tools like Looker, Tableau, Sheets, PowerBI, Qlik or even any custom application.
And our customers have realized this value quickly. “We have seen significant performance improvements within BigQuery after implementing BI Engine. Our views and materialized views have been especially improved after implementing BI Engine.” says Yell McGuyer, Data Architect at Keller Williams Realty.
Today, we are very excited to announce the general availability of BigQuery BI Engine for all BI and custom applications that work with BigQuery!
BI Engine Acceleration works seamlessly with BigQuery
Native Integration with the BigQuery API. BI Engine natively integrates with the BigQuery API, which means that if your dashboards use standard interfaces like SQL, BigQuery APIs or JDBC/ODBC drivers to connect to BigQuery, then BI Engine is automatically supported. No changes are required for applications or dashboards to get sub-second, scalable dashboards up and running. If you run a query with BigQuery and if it can be accelerated, it will be accelerated with BI Engine.
Intelligent Scaling. Customers do not have to worry about efficiently using the memory reservation, BI Engine does it for you based on the access patterns. BI Engine leverages advanced techniques like vectorized processing, advanced data encodings, and adaptive caching to maximize performance while optimizing memory usage. It can also intelligently create replicas of the same data to enable concurrent access.
Simple Configuration. The only configuration needed when using BI Engine is to set up memory reservation, which is provided in a fine-grained increment of 1GB each.
Full Visibility. Monitoring and logging are critical for running applications in the cloud and to gain insight into performance and opportunities for optimization. BI Engine integrates with familiar tools such as Information Schema for job details (e.g. aggregate refresh time, cache hit ratios, query latency etc) and Stackdriver for monitoring of usage.
You can sign up for a BigQuery sandbox here and enable BI Engine for your project. Feel free to read through the documentation and quick-starts guides for popular BI tools. You can also watch the demo from Data Cloud Summit to see how BI Engine works with BI tools like Looker, Data Studio and Tableau.
If you’re a partner with an integration to BigQuery, consider joining the Google Cloud Ready – BigQuery initiative. You can find more details about the program here.
Data analytics technology is helping businesses boost profitability in many ways. A few years ago, Walter Baker and his colleagues at McKinsey reported that one of the biggest advantages of big data in business is that it can help with pricing decisions.
“Without uncovering and acting on the opportunities big data presents, many companies are leaving millions of dollars of profit on the table. The secret to increasing profit margins is to harness big data to find the best price at the product—not category—level, rather than drown in the numbers flood,” they write.
In order to appreciate the benefits of using big data for optimizing prices, companies must recognize the merits of creating the right price point in the first place. Then they will find ways to track prices with analytics and adapt their pricing strategy accordingly.
Witness the true story of price points. See how their understanding can lead to massive business benefits. Profits, revenues, sales volumes, and customer loyalty. They all can be achieved through adequate and well-established price points.
The idea behind the pricing point is trivial and important – find the price that will help sell the particular number of units while gaining profits and keeping consumers satisfied with the price you have chosen. Price points help balance the price to keep the demand curve under control.
Here, you will witness some key aspects of price points and see the importance of coupling the phenomenon with advanced techniques involving software and automated input.
What is this beast?
As it was mentioned above, price points are fairly simple to understand. However, its simplicity should not deceive you. As determinants of the pricing strategy, price points show their pros & cons and are often hard to properly assess. Why? Because establishing good price points depends on one’s ability to collect and process massive amounts of data. Even though instruments like price management software are available, you still need to know what type of data to analyze and how to do it.
How Can Data Analytics Help with Creating a Pricing Strategy?
This illustrates the importance of using data analytics to create a successful pricing strategy. Prior to the proliferation of big data, companies had to blindly make intuitive decisions about their pricing strategies. This was a hit or miss practice, because countless factors influence pricing models. Even when companies were able to successfully select profitable price points, they struggle to be responsive too changes in the market that shifted them. Data analytics technology helps companies establish better price points. Here are some benefits of using big data to address pricing challenges:
You can use predictive analytics technology to anticipate upcoming events that will influence the market and force you to change your pricing model.You can use machine learning to automate certain price changes.
You can use data analytics to identify purchasing behavior across different demographic groups. This helps you create more nuanced pricing models that may vary across different regions.You can look at historic sales data and use analytics tools to identify various environmental factors that changed sales volume. This helps you adjust your prices for seasonal trends, upcoming events or other extraneous factors that you have to take into consideration.
More companies are using data analytics to optimize their pricing models. The benefits listed above are the basis for their decisions to do so.
Balancing with price points
In the science of price points, it is crucial to avoid extremes. It can be achieved through the notion of price thresholds. What do they mean?Price thresholds illustrate the connection between the price of a product and the customer’s willingness to pay for the product. Set the price too low, and the clients will think that the product is of a low value. Set the price too high, and consumers will assume that the product does not worth it. Price thresholds help you balance highs and lows, thus keeping price points in perfect equilibrium.
This is where big data becomes so important in pricing. You can look at historical sales data to identify the price points that led to the best equilibrium points to maximize sales.
How can your company use data analytics to unleash the potential of price points?
Price points are not static. It means that they need to be adjusted to the ever-changing market realities. Besides, consumer preferences might shift, thus driving price points in a different direction. However, even in the most dynamic price points, there are some constants – business objectives, competitors’ strategies, availability of supply, demand curve, and customer loyalty.
Data analytics helps your company distinguish the variables that are static from those that are dynamic. The data can be incorporated into predictive analytics models to best forecast the right price points in the future.
For example, companies like Uber have historic data on the sales volume during major holidays like New Years and dangerous weather events. They can use this data to adjust prices as these events transpire. They can also monitor data in real-time to change prices and even automate their pricing strategy to reflect instantaneous event changes.
It can be challenging to keep tabs on all the factors mentioned above. However, it is paramount to do so. Following are several options for ensuring the price points work to your benefit and with the least resistance.
Option 1: Testing
Data analytics is helpful, but it doesn’t spare you from having to all of the grunt work. You cannot avoid getting your hands dirty to know your best price points. The best price points emerge from mistakes and learned insights, as with any action. Test different price points and look at the results in such a case. It can be customers’ reactions or profit margins. Determine what indicators to use to understand whether a particular price point passed the test.
There are different tests available. If you look for a more organized testing approach, consider using A/B testing. It is a simple solution that does not require too much knowledge or time to handle. Essentially, the method compares several price point strategies to present the one most applicable to your scenario.
Option 2: Advanced software
If testing is not your style, you can always use technological means. New pricing software uses sophisticated data analytics tools to help companies find the best price points.
There are various advanced data analytics solutions available on the market. Price management software is one of them. Such a tool can help you rip the benefits of automated pricing. How does it work? You give the machine different variables, playing out various pricing scenarios. As an outcome, you pick the one recommended. Often, the result translates into pricing that brings revenues and profits.
Advanced solutions are extremely viable for companies with broad portfolios. However, they are also beneficial for businesses relying only on one or few products. Price management software often includes a library of different scenarios generated in the context of various market environments. There is a massive chance that one of them will fit your given case.
Option 3: Skimming
The skimming model dictates that prices should be established to create the most favorable conditions for a company to enter a new market. How is it done? First and foremost, the company sets a particular objective. For instance, a business looks for an optimal price in a highly competitive environment. Second, the company needs to understand its end-game. For illustration, it can be achieving maximum profits in the shortest period possible. Third, it is crucial to understand the psychology behind entering a new market with a new product.
Following all three steps presented above, you should be able to complete the following strategy. You can set a higher price point when the new product is introduced. It will create the impression that customers can buy something unique and valuable. Besides, you can always add a feeling of urgency to the mixture. Later, when the new product reaches maturity, it is time to lower the price point. It is necessary to keep consumers interested, namely because, with time, the demand for the product naturally declines. Lower prices mean customers can get a good deal, which everyone likes.
Option 4: Assessment
Price points bring the most benefit when constantly updated and monitored. It is crucial to perceive them as living organisms that adapt to the changing environment. This approach helps you be one step ahead of competitors and make sure your customers are comfortable paying the price you set on a product. Always make sure your price points correlate to your key business objectives. Besides, constantly monitor price points using various KPIs, which you’ve chosen as pivotal.
In addition, don’t shun looking at your rivals. See how they are doing with their price points. Are there any mistakes they make? Are consumers like their prices versus their products? These are the questions to ask. They help monitor your price points and ensure you’re the one learning from the mistakes of others and not vice versa.
Big Data Helps Companies Establish the Most Profitable Price Points
As you can see, price points are both simple to understand and hard to implement. Nevertheless, you can easily establish price points equipped with the knowledge above if you understand the benefits of pricing analytics. Just make the most of price management software with sophisticated data analytics features and keep price points constantly monitored, assessed, and updated.
With over ⅓ of the food in the USA ending up as waste according to the USDA, it is a compelling challenge to address this travesty. What will happen to hunger, food prices, trash reduction, water consumption, and overall sustainability when we stop squandering this abundance?
Beginning with the departure from the farm to the back of the store, the freshness clock continues to run. Grocers work very hard to purchase high quality produce items for their customers and the journey to the shelf can take a toll in both quality and remaining shelf life. Suppliers focus on delivering their items through the arduous supply chain journey to the store with speed and gentle handling. The baton is then passed to the store to unload and present the items to customers with care to sell through each lot significantly before the expiration or sell by date. This is to ensure that the time spent in the customer’s home is ample to ensure a great eating experience as well. Food waste is a farm to fork problem with opportunity at every step of the chain, but today we will focus on the segment that the grocery industry oversees.
With the complexities of weather, geopolitical issues, distribution, sales variability, pricing, promotions, and inventory management, it seems daunting to impact waste. Fortunately, data analytics and machine learning in the cloud is a powerful weapon in the fight against food waste. Data Scientists harness knowledge to draw meaning from data turning that data into decision driving information.
One key Google has been working on to accelerate value is to break down data silos and leverage machine learning to realize better outcomes, using our Google Data Cloud platform. This enables better planning through demand forecasting, Inventory management, assortment planning, and dynamic pricing and promotions.
That sounds great but how does it work?
Let’s walk through a day in the life journey to see how the integrated Google Data Cloudplatform can change the game for good. Our friendly fictitious grocer FastFreshFood is committed to selling high quality perishable items to their local market. Their goal is to minimize food waste and maximize revenue by selling as much perishable fresh food as possible before the sell by date. Our fictitious grocer in partnership with Google Cloud could build a solution that will take a significant bite out of their food waste volume and better satisfy customers.
Sales through the register and online are processed in real time with Datastream, Dataflow to keep an accurate perpetual inventory by minute of every single item.
A Demand forecasting model using machine learning algorithms in BigQuery then identifies needs for back room replenishment, so Direct Store Delivery and daily store Distribution Centers manage ordering more efficiently to ensure just the right amount of each product each day.
Realtime reporting dashboards in Looker with alerting capabilities enable the system to operate with strong associate support and understanding. The reporting suite shows inventory levels into the future, daily orders, and at risk items.
The pricing algorithm could also alert store leadership concerning any items that will not sell through and suggest real time in store specials resulting in zero waste at shelf and maximized revenue.
This approach is not just for perishable categories and is a pattern that works well for in-store produced items and center store items. The key point is that by bringing ML/AI to difficult business problems grocers are reinventing what is possible for both their profitability and sustainability.
In partnership with Google Cloud, retailers can solve complex problems with innovative solutions to achieve higher quality, lower cost, and provide great customer experiences. To learn more from this and other use cases, please visit our Design Patterns website.
Curious to learn more?
We’re excited to share what we know about tackling food waste at Google, a topic we’ve been working on in the last decade as we’ve embarked on reducing our own food waste in our operations in over 50 countries in the world. The Google Food for Good team works exclusively on Google Cloud Platform with our partners on this topic. Two additional articles below.
Mosquitoes aren’t just the peskiest creatures on Earth; they infect more than 700 million people a year with dangerous diseases like Zika, Malaria, Dengue Fever, and Yellow Fever. Prevention is the best protection, and stopping mosquito bites before they happen is a critical step.
SC Johnson—a leading developer and manufacturer of pest control products, consumer packaged goods, and other professional products—has an outsized impact in reducing the transmission of mosquito-borne diseases. That’s why Google Cloud was honored to team up with one of the company’s leading pest control brands, OFF!®, to develop a new publicly available, predictive model of when and where mosquito populations are emerging nationwide.
As the planet warms and weather changes, OFF! noticed month-to-month and year-to-year fluctuations in consumer habits at a regional level, due to changes in mosquito populations. Because of these rapid changes, it’s difficult for people to know when to protect themselves. The OFF!Cast Mosquito Forecast™, built on Google Cloud and available today, will predict mosquito outbreaks across the United States, helping communities protect themselves from both the nuisance of mosquitoes and the dangers of mosquito-borne diseases—with the goal of expanding to other markets, like Brazil and Mexico, in the near future.
Source: Sadie J. Ryan, Colin J. Carlson, Erin A. Mordecai, and Leah R. Johnson
With the OFF!Cast Mosquito Forecast™, anyone can get their local mosquito prediction as easily as a daily weather update. Powered by Google Cloud’s geospatial and data analytics technologies, OFF!Cast Mosquito Forecast is the world’s first public technology platform that predicts and shares mosquito abundance information. By applying data that is informed by the science of mosquito biology, OFF!Cast accurately predicts mosquito behavior and mosquito populations in specific geographical locations.
Starting today, anyone can easily explore OFF!Cast on a desktop or mobile device and get their local seven-day mosquito forecast for any zip code in the continental United States. People can also sign up to receive a weekly forecast. To make this forecasting tool as helpful as possible, OFF! modeled its user interface after popular weather apps, a familiar frame of reference for consumers.
SC Johnon’s OFF!Cast platform gives free, accurate and local seven-day mosquito forecasts for zip codes across the continental United States.
The technology behind the OFF!Cast Mosquito Forecast
To create this first-of-its-kind forecast, OFF! stood up a secure and production-scale Google Cloud Platform environment and tapped into Google Earth Engine, our cloud-based geospatial analysis platform that combines satellite imagery and geospatial data with powerful computing to help people and organizations understand how the planet is changing.
The OFF!Cast Mosquito Forecast is the result of multiple data sources coming together to provide consumers with an accurate view of mosquito activity. First, Google Earth Engine extracts billions of individual weather data points. Then, a scientific algorithm co-developed by the SC Johnson Center for Insect Science and Family Health and Climate Engine experts translates that weather data into relevant mosquito information. Finally, the collected information is put into the model and distilled into a color-coded, seven-day forecast of mosquito populations. The model is applied to the lifecycle of a mosquito, starting from when it lays eggs to when it could bite a human.
The SC Johnson Center for Insect Science and Family Health is one the world’s leading entomology research centers, studying advanced science of insect biology, insect-borne disease prevention and effective product solutions for consumer use. The science behind brands like OFF! is grounded in knowledge from world-class entomologists who have devoted their careers to SC Johnson’s mission of eradicating diseases like Malaria and Zika.
“We are putting the power in consumers’ hands in providing them with a tool to help predict their exposure and prevent mosquito bites,” said Maude Meier, SC Johnson entomologist. “It’s an exciting time to be working in the field of insect science as we find new opportunities to combine science and technology, like Google Earth Engine, to be a force for good in our mission to prevent the spread of insect-borne diseases.”
It takes an ecosystem to battle mosquitos
Over the past decade, academics, scientists and NGOs have used Google Earth Engine and its earth observation data to make meaningful progress on climate research, natural resource protection, carbon emissions reduction and other sustainability goals. It has made it possible for organizations to monitor global forest loss in near real-time and has helped more than 160 countries map and protect freshwater ecosystems. Google Earth Engine is now available in preview with Google Cloud for commercial use.
Our partner, Climate Engine, was a key player in helping make the OFF!Cast Mosquito Forecast a reality. Climate Engine is a scientist-led company that works with Google Cloud and our customers to accelerate and scale the use of Google Earth Engine, in addition to those of Google Cloud Storage and BigQuery, among other tools. With Climate Engine, OFF! integrated insect data from VectorBase, an organization that collects and counts mosquitoes and is funded by the U.S. National Institute of Allergy and Infectious Diseases.
The model powering the OFF!Cast Mosquito Forecast combines three inputs—knowledge of a mosquito’s lifecycle, detailed climate data inputs, and mosquito population counts from more than 5,000 locations provided by VectorBase. The model’s accuracy was validated against precise mosquito population data collected over six years from more than 33 million mosquitoes across 141 different species at more than 5,000 unique trapping locations.
A better understanding of entomology, especially things like degree days and how they affect mosquito populations, and helping communities take action is critically important to improving public health. Learn more about OFF!Cast Mosquito Forecast and see here to learn more about Google Earth Engine on Google Cloud.
Today, manufacturers are advancing on their digital transformation journey, betting on innovative technologies like cloud and AI to strengthen competitiveness and deliver sustainable growth. Nearly two thirds of manufacturers already use cloud solutions, according to McKinsey. The actual work of scaling digital transformation projects from proof of concept to production, however, still remains a challenge for the majority of them, according to analysts.
We believe the scalability challenges revolve around two factors—the lack of access to contextualized operational data and the skills gap to use complex data science and AI tools on the factory floor.
To ensure manufacturers can scale their digital transformation efforts into production, Google Cloud is announcing new manufacturing solutions, specifically designed for manufacturers’ needs.
The new manufacturing solutions from Google Cloud give manufacturing engineers and plant managers access to unified and contextualized data from across their disparate assets and processes.
Let’s take a look at the new solutions as we follow the data journey, from the factory floor to the cloud:
Manufacturing Data Engine is the foundational cloud solution to process, contextualize and store factory data. The cloud platform can acquire data from any type of machine, supporting a wide range of data, from telemetry to image data, via a private, secure, and low cost connection between edge and cloud. With built-in data normalization and context-enrichment capabilities, it provides a common data model, with a factory-optimized data lakehouse for storage.
Manufacturing Connect is the factory edge platform co-developed with Litmus Automation that quickly connects with nearly any manufacturing asset via an extensive library of 250-plus machine protocols. It translates machine data into a digestible dataset and sends it to the Manufacturing Data Engine for processing, contextualization and storage. By supporting containerized workloads, it allows manufacturers to run low-latency data visualization, analytics and ML capabilities directly on the edge.
Built on the Manufacturing Data Engine are a growing set of data analytics and AI use cases, enabled by Google Cloud and our partners:
Manufacturing analytics & insights: An out-of-the-box integration with Looker templates that delivers a dashboarding and analytics experience. As an easy-to-use, no-code data and analytics model, it empowers manufacturing engineers and plant managers to quickly create and modify custom dashboards, adding new machines, setups, and factories automatically. The solution enables drill down into the data against KPIs, or on-demand to uncover new insights and improvement opportunities throughout the factory. Shareable insights unlock collaboration across the enterprise and with partners.
Predictive maintenance: Pre-built predictive maintenance machine learning models allow manufacturers to deploy in weeks without compromising on prediction accuracy. Manufacturers can continuously improve their models and refine them in collaboration with Google Cloud engineers.
Machine-level anomaly detection: A purpose-built integration that leverages Google Cloud’s Time Series Insights API on real-time machine and sensor data to identify anomalies as they occur and provide alerts.
“The growing amount of sensor data generated on our assembly lines creates an opportunity for smarter analytics around product quality, production efficiency, and equipment health monitoring, but it also means new data intake and management challenges,” said Jason Ryska, director of manufacturing technology development at Ford Motor Company. “We worked with Google Cloud to implement a data platform now operating on more than 100 key machines connected across two plants, streaming and storing over 25 million records per week. We’re gaining strong insights from the data that will help us implement predictive and preventive actions and continue to become even more efficient in our manufacturing plants.”
“With the tight integration of a powerful factory edge solution with Google Cloud, it is easier than ever for factories to tap into cloud capabilities,” said Masaharu Akieda, general manager for the Digital Solutions Division at KYOCERA Communication Systems Company. “Google Cloud’s solutions enable a broader group of users beyond data scientists to quickly access, analyze and use data in a variety of use cases. We are excited to partner with Google Cloud as we implement new manufacturing solutions to optimize production operations and consistently increase quality.”
“As the global innovator of solid state cooling and heating technology, we’ve developed a sustainable manufacturing platform that uses less water, less electricity, and less chemical waste,” says Jason Ruppert, chief operations officer of Phononic. “This partnership with Google Cloud allows us to contextualize data across all of our manufacturing processes – ultimately providing us the analytics and insights to optimize our operations and continue to bring to the world products that cool sustainably, reducing greenhouse gas (GhG) emissions and improving the environment.”
With Google cloud’s new manufacturing solutions, three critical pieces of smart manufacturing operations are strengthened and integrated: factory-floor engineers, data, and AI.
Empowering factory-floor engineers to be the hub of smart manufacturing
Over the last few years, the manufacturing industry contributed more than 10% of the U.S. gross domestic product, or 24% of GDP with indirect value (i.e. purchases from other industries) included. This is also the sector that employs approximately 15 million people, representing 10% of total U.S. employment. However, more than 20% of manufacturers’ workforce in the US is older than 55 years, and an average age of 44 years old – with similar patterns seen across the world. Finding new talent to replace the retiring workforce is getting increasingly harder for manufacturers.
Companies therefore need to both enable their existing workforce, while making it more attractive to new talent to join. This balance requires making critical technology such as Cloud and AI accessible, easier to use, and deeply embedded in manufacturers’ day-to-day operations.
Google Cloud’s manufacturing solutions are designed with this end in mind. Combining fast implementation and ease-of-use, powerful digital tools are put directly into the hands of the manufacturers’ workforce to uncover new insights and optimize operations in entirely new ways.
Key parts of the solution are low- to no-code in setup and use, and therefore are suitable for a large variety of end users. Built for scale, the solutions allow for template-based rollouts and encourage reuse through standardization. Designed with best practices in mind, manufacturers are enabled to focus precious resources on use cases, instead of the underlying infrastructure.
Manufacturing engineers can visualize and drill down into data using Manufacturing Analytics & Insights, built on Looker’s business intelligence engine. Being integrated with the Manufacturing Data Engine, its automatic configuration provides an up-to-date view into any aspect of manufacturing operations. From the COO to plant managers and factory engineers, users are enabled to easily browse and explore factory data on the enterprise, factory, line machine, and sensor level.
Besides designing manufacturing solutions from the ground up for ease-of-use, Google Cloud and partners are actively helping manufacturers in upskilling their workforce capabilities with a dedicated enablement service.
Making every data point accessible and actionable
Data is the backbone of digital manufacturing transformation and manufacturers have a potential abundance of data: performance logs from a single machine can generate 5 gigabytes of data per week, and a typical smart factory can produce 5 petabytes per week.
However, this wealth of data and the insights contained within it remain largely inaccessible for many manufacturers today: data is often only partially captured, and then locked away in a variety of disparate and proprietary systems.
Manufacturing Connect, co-developed with Litmus Automation, provides an industry-leading breadth of 250-plus native protocol connectors to quickly connect to and acquire data from nearly any production asset and system with a few clicks. Integrated analytics features and support for containerized workloads provide manufacturers with the option for on-premise processing of data.
A complementary cloud component allows manufacturers to centrally manage, configure, standardize and update edge instances across all their factories for roll-outs on a global scale. Integrated in the same UI, users can also manage downstream processing of data sent to the cloud by configuring Google Cloud’s Manufacturing Data Engine solution.
The Manufacturing Data Engine provides structure to the data, and allows for semantic contextualization. Doing so, data is made universally accessible and useful across the enterprise. By abstracting away the underlying complexity of manufacturing data, manufacturers and partners are enabled to develop high value, repeatable, scalable, and quick to implement analytics and AI use cases.
AI for smart manufacturing demands a broad partner ecosystem
Manufacturers recognize the value of AI solutions in driving cost and production optimizations. So much so that several of them have active patents on AI initiatives. In fact, according to research from Google in June, 2021, 66% of manufacturers that use AI in their day-to-day operations report their reliance on AI is increasing.
Google Cloud helps manufacturers put cloud technology and artificial intelligence to work helping factories run faster and smoother. Customers using the Manufacturing Data Engine from Google Cloud can directly access Google Cloud’s industry-leading Vertex AI platform, which offers integrated AI/ML tools ranging from AutoML for manufacturing engineers, to advanced AI tools for experts to fine-tune results. With Google Cloud, AI/ML use case development has never been more accessible for manufacturers.
Crossing the scalability chasm for using the power of cloud and AI in manufacturing
Our mission is to accelerate your digital transformation by bridging data silos, and to help make every engineer into a data scientist with easy-to-use AI technologies and an industry data platform. Join us at the Google Cloud Manufacturer Spotlight to learn more.
The new manufacturing solutions will be demonstrated in person for the first time at Hannover Messe 2022, May 30–June 2. Visit us at Stand E68, Hall 004, or schedule a meeting for an onsite demonstration with our experts.
Today, we are announcing that Looker’s new Google Cloud operators for Apache Airflow are available in Cloud Composer, Google Cloud’s fully managed service for orchestrating workflows across cloud, hybrid, and multi-cloud environments. This integration gives users the ability to orchestrate Looker persistent derived tables (PDTs) alongside the rest of their data pipeline.
Looker PDTs are the materialized results of a query, written to a Looker scratch schema in the connected database and rebuilt on a defined schedule. Because they are defined within LookML, PDTs reduce friction and speed up time to value by putting the power to create robust data transformations in the hands of data modelers. But administration of these transformations can be difficult to scale. By leveraging this new integration, customers can now get greater visibility into and exercise more granular control over their data transformations.
Using Looker with Cloud Composer enables customers to:
Know exactly when PDTs are going to rebuild by directly linking PDT regeneration jobs to the completion of other data transformation jobs. This insight ensures that PDTs are always up to date without using Looker datagroups to repeatedly query for changes in the underlying data and enables admins to closely control job timing and resource consumption.
Automatically kick off other tasks that leverage data from PDTs, like piping transformed data into a machine learning model or delivering transformed data to another tool or file store.
Quickly get alerted of errors that occur for more proactive troubleshooting and issue resolution.
Save time and resources by quickly identifying any points of failure within a chain of cascading PDTs and restarting the build process from there rather than from the beginning. Within Looker, there are only options to rebuild a specific PDT or to rebuild the entire chain.
Easily pick up any changes in your underlying database by forcing incremental PDTs to reload in full on a schedule or on an ad-hoc basis with the click of a button.
Pairing Looker with Cloud Composer provides customers with a pathway for accomplishing key tasks like these, making it easier to manage and scale PDT usage.
What’s New
There are two new Looker operators available that can be used to manage PDT builds using Cloud Composer:
LookerStartPdtBuildOperator: initiates materialization for a PDT based on a specified model name and view name and returns the materialization ID.
LookerCheckPdtBuildSensor: checks the status of a PDT build based on a provided materialization ID for the PDT build job.
These operators can be used in Cloud Composer to create tasks inside of a Directed Acyclic Graph, or DAG, with each task representing a specific PDT build. These tasks can be organized based on relationships and dependencies across different PDTs and other data transformation jobs.
Getting Started
You can start using Looker and Cloud Composer together in a few steps:
Within your connection settings in your Looker instance, turn on the Enable PDT API Control toggle. Make sure that this setting is enabled for any connection with PDTs that you’d like to manage using Cloud Composer.
Set up a Looker connection in Cloud Composer. This connection can be done through Airflow directly, but for production use, we’d recommend that you use Cloud Composer’s Secret Manager.
Define dependencies between tasks within your DAG.
To learn more about how to externally orchestrate your Looker data transformations, see this tutorial in the Looker Community.
Data Transformations at Scale
This integration between Looker and Cloud Composer pairs the speed and agility of PDTs with the added scalability and governance of Cloud Composer. By managing these Looker data transformations using Cloud Composer, customers can:
Define and manage build schedules to help ensure that resourcing is allocated efficiently across all ongoing processes
See the jobs that are running, have errored, or have completed, including Looker data transformations, in one place
Leverage the output of a PDT within other automated data transformations taking place outside of Looker
Thanks to this integration with Cloud Composer, Looker is giving customers the ability to empower modelers and analysts to transform data at speed, while also tapping into a scalable governance model for transformation management and maintenance. Looker operators for Cloud Composer are generally available to customers using an Airflow 2 environment. For more information, check out the Cloud Composer documentation or read this tutorial on setting up Looker with Apache Airflow.
Artificial intelligence is often portrayed as a technology that will make robots rule over humans. No wonder many people fear that computers and other AI—enabled devices will control us. However, if we keep aside this dangerous depiction of AI, we can see how beneficial such systems are in our lives. Businesses are including more of it in their companies and adopting methods like AI text analysis.
What is text analysis?
In this age of the internet, we come across enough text that will cost us an entire lifetime to read. Multiple emails, social media posts, blogs, articles, and other text forms are generated daily. The crux of the matter is that a humongous amount of text is available globally, and we are prone to missing out on valuable content.
In smaller companies, too, one can see that they take in more textual information than they can handle. This problem will not stop as more documents and other types of information are collected and stored. This will eventually lead you to situations where you know that valuable data is inside these documents, but you cannot extract them.
This is where text analysis comes into the picture. Text analysis, or text mining, is a machine—learning technique that can extract valuable data from large amounts of unstructured text. Artificial intelligence, machine learning, and advanced data analytics techniques come together to accomplish this.
Why is text analysis needed?
When machines can easily procure needed information from a pile of unorganized data, you know the benefits of such technology are enormous. Here are some reasons why text analysis is required:
1. Text analysis makes businesses more scalable
If data had to be sorted manually, it would easily take months or even years to do it. But with text analysis tools, information in the form of emails, documents, and more can be easily structured. The entire process can be done in a few minutes, giving you more time to focus on other essential business tasks.
2. Text analysis can be done in real—time
Businesses are overburdened with information, and customers contribute more to it by adding more information on the web. Unfortunately, this prohibits companies from keeping an eye on each content type. Text analysis can up the game here by locating important data at any time and in real—time, no matter its location.
3. AI—enabled text analysis delivers consistent criteria
Humans may be more intelligent than computers, but they are also prone to make more errors. But by using AI text analysis, all data and related algorithms can be quickly sorted. As a result, this process is faster and has fewer errors.
What is the relation between AI text analysis and Natural Language Processing?
AI text analysis only deals with extracting valuable data from a massive pile of content. Then, NLP is used to make the data more understandable. It uses artificial intelligence to transform the data into how humans write and speak.
The usage of NLP has become widespread in the past few years. Its use can be seen firsthand in products like Siri, Alexa, and Google voice search that respond to user requests quickly. Considering the amount of unstructured data produced daily, NLP has become integral to efficiently understanding and analyzing text—based data.
Some of the real—world applications of AI and NLP are:
Natural language generation to answer questions via customer service chatbotsVoice—controlled assistants like Alexa and SiriLanguage models, such as the autocomplete feature that predicts your following words based on what you have typedStreamlining the recruitment process on LinkedIn, where people’s skills and experience are quickly scannedUsage of NLP in tools like Grammarly that can correct errors and simplify writing styles
What are the benefits of using AI for text analysis?
Artificial intelligence uses NLP to understand the information the same way humans do for text analysis. Some of the benefits of using it are:
1. Performs text analysis on a large scale
NLP technology analyses all types of documents, no matter how big their size. Suppose the exact text is analyzed manually. But with NLP and AI, a complete analysis can be done in just seconds or minutes. Additionally, NLP can scale up or down as per your needs and computational power.
2. Streamlines processes and reduces costs
As mentioned earlier, NLP can work at any scale and any given point during the day or night. For manual text analysis, you would need a group of staff working around the clock. But with AI text analysis, you can keep the team to a minimum.
An automated NLP that operates in real—time works best for customer feedback. You will get to know about the problems your customers are facing with a product or a service instantly. This ensures that no processes are repeated and that procedures are streamlined.
3. Improves customer satisfaction
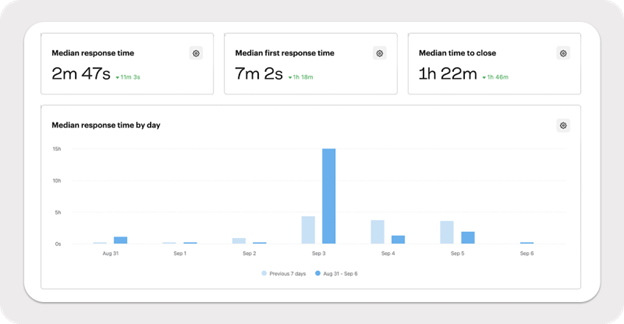
AI—enabled NLP tools help you automatically analyze and sort customer service tickets. These tickets can be further sorted as per urgency, sentiment, intent, topic, etc. Doing so, you will never leave any customer hanging.
Integrated CRM systems can instantly arrange, manage and respond to customer service queries. In addition, analyzing customer satisfaction surveys using NLP can help you figure out the satisfaction level of customers at each step of the journey.
4. More objective and accurate analysis
Performing repetitive tasks like reading and analyzing text can be tedious. Moreover, the data collected is not free from error or biases if humans handle it. NLP tools can perform tasks more accurately and without any shadow of judgment or skewing of results.
Unstructured data can be difficult to skim through. For example, online surveys and open—ended survey responses require more rigorous analysis by breaking down the text for easy understanding. But AI—guided NLP tools can delve inside piles of unorganized data and provide accurate and actionable insights.
6. A better understanding of the market
Market research is a time—consuming task, susceptible to incorrect or incomplete data analysis. But when you put NLP to work to understand your customer base, you will get a better idea of the market segmentation. Artificial intelligence also prepares you to target audiences directly and decrease customer churn.
7. Empower your employees
Just imagine the human hours you will be saving by automating processes! Using a full—fledged artificial intelligence software for data analysis will increase the focus on employees on their actual jobs. Furthermore, your staff will be free from repetitive and boring tasks.
Closing out on AI text analysis
The benefits of using NLP in businesses are aplenty. It is also a technology that keeps your business ahead of the times. It is no longer something that only the IT guys could experiment with, but all companies can use it for their gain. An NLP tool will always help you get the most out of your data.
Unauthorized data intrusions have been occuring with alarming frequency. From the highly sophisticated 2021 incident better known as the Pandora Papers to the massive hospitality breach that caused the personal details of millions of MGM hotel guests to be exposed on the dark web, such incidents are a distressing fact of modern life.
It’s tempting to think of the risk of a data intrusion as an unavoidable cost of doing business. And it is true that preventing sophisticated forces from doing what they will is difficult, if not impossible, for most enterprises.
Yet we underplay the consequences of successful data breaches at our own peril. Even a “minor” incident can have lasting ramifications for affected individuals and firms. Let’s take a look at a few of these in turn and why you need to prevent these data breaches.
1. Damage to Your Corporate Image
This downside is perhaps the most difficult to quantify because it’s hard to pin a value on your reputation in the first place. Suffice to say that any damage to your corporate image is bad for business — perhaps over timescales far longer than the inciting incident and your direct response.
The threat of lasting damage is what compelled Asiaciti Trust and others to clean up the technical and reputational damage caused by the Pandora Papers incident. It’s what drove firms like MGM International and Capital One (another recent data breach victim) to disclose their own vulnerabilities too.
2. Financial Costs to Restore Lost Data
Restoring lost data is often not as simple as pressing a button following a data incident. That’s because such incidents often corrupt corporate and personal data, making it difficult to determine what needs to be restored. Depending on which systems and data the incident affected in the first place, version control could be an issue as well.
3. Time Costs to Restore Lost Data
It takes time to restore lost data as well. And your firm’s time may well be more valuable than its money in the aftermath of a data incident, when your team will be working overtime to get back to normal even as “business as usual” goes on (or tries to go on, anyway). Time spent on data restoration — a basic incident response need that can’t be delayed — is time not spent on your public response.
4. Resource-Intensive Crisis Response
This matters because said public response is very resource-intensive. And, like data restoration, it really shouldn’t be delayed once the public learns of the incident. (They almost certainly will learn about it, even if you don’t tell them. The incident that affected Asiaciti Trust and its peer firms was first reported in the media, not by any of the impacted organizations.)
Any internal resources devoted to your response — people, software, creative labor — are resources you’re not spending on “business as usual.”
5. Post-Incident Analysis and Remediation
This merely adds to the financial and time cost of a data incident. And those additions are often significant, as an effective postmortem generally requires outside expertise — forensic cyber experts — who work for weeks or months to figure out what happened and what can be done to prevent a recurrence.
That second part — preventing a recurrence — takes even more time to ensure. Depending on the outcome of the investigation, you’ll likely have a laundry list of action items that you’ll need to pay outside contractors or internal IT staff to implement.
6. Expense to Hire Legal Counsel, If Needed
If your data incident places your firm in legal jeopardy or requires negotiation with stakeholders, you may need to retain legal counsel with cyber liability expertise. These professionals are difficult to come by (though becoming more plentiful every year) and charge a premium for their services. But you might not have a choice.
7. Payouts to Affected Customers and Stakeholders
Finally, if the data incident materially affected any of your firm’s stakeholders — including customers — financial compensation may ultimately be in order (or required of you). This can take years to materialize, but it’ll hurt when the time comes to pay.
Prevention Is the Best Medicine — But It’s No Cure
Every one of these data intrusion consequences is bad for your business. It might cause a direct financial loss or a more subtle erosion of consumer confidence in your brand, but either way — it’s not a headache you want to deal with.
Clearly, prevention is the best medicine. And while it’s foolish to think that you can reduce your risk of a data intrusion all the way down to zero, you can do more to make yourself less attractive to the bad guys than you realize.
That’s a topic of conversation for another day. But now that you understand the downsides of leaving yourself vulnerable to data theft, it’s a conversation you’ll want to have sooner rather than later.
Did you know that around 37% of businesses use machine learning to some degree? This figure is growing significantly by the year.
There are many reasons that more companies are turning to machine learning technology. One of the benefits of leveraging machine learning is that it can help with develop employee compensation schemes.
Joanne Sammer, an author with Better Workplace Better World published an article on the use of AI in making pay decisions. She talked about the benefits of ensuring employees are paid based on their respective value, rather than their position.
One of the ways companies like IBM are using machine learning in employee compensation models is by using ongoing feedback rather than making pay decisions based on periodic reviews. This is a great example of how companies can use machine learning to improve employee retention.
One way that employers can use machine learning to improve compensation models is by developing tronc benefit systems.
A tronc benefit is a unique, well-organized remuneration structure for employees that distributes tips, gratuities, and service fees. The leisure and hospitality businesses rely largely on tronc benefits.
A tronc can enhance employees’ take-home pay at no additional expense to your organization by providing considerable advantages to both employers and employees through long-standing tax relief and exemptions. It also ensures that HMRC collects the correct amount of tax on the growing number of discretionary payments made using a payment card.
However, tronc systems aren’t easy to implement. This is one of the reasons that companies can use machine learning to bolster their compensation models.
Who is a Troncmaster and How Can They Use Machine Learning?
A TRONCMASTER (person in charge of the tronc benefits) must manage a different payroll (PAYE scheme) from the one used to process employees’ hourly/salary pay and send the ‘tip’ information to HMRC.
A number of new models have been developed with machine learning to improve the performance of tronc systems. Aman Kharwal wrote a program in Python to predict future tips that waiters will earn, which he shared on his blog. Any company can use similar machine learning models to improve their tronc management. A good TRONCMASTER will understand the appeal of this approach.
How can using machine learning to deal with tronc benefit help your business?
Tronc benefits place both the firm and the employee in the same tax situation as cash tips: the employee must pay income tax on the voluntary money received, and there is no National Insurance Contributions (NICs) to pay.
HMRC may examine your tronc arrangement to ensure that it fully complies with the provisions of the NICs-free payments program. If you don’t keep up with the regulations of tronc benefits, your business might be jeopardized. Pooling and exchanging cash tips, converting card tips to cash at the checkout, and unwittingly constructing tip contractual agreements are all areas of danger.
This is one of the most important reasons to invest in a machine learning system to manage this type of compensation. You can accurately forecast waiter tips and make sure that the right earnings are reported if you have an AI application making these forecasts.
Tronc benefits, when properly implemented, may help a company retain and inspire employees while also saving NI. They have a huge influence on low-wage workers, bringing their earnings up to a more tolerable level. Many workers have wanted to forgo prospective NI efficient income for guaranteed income because of the “top-up” from a tronc program that vanished as we went into lockdown.
Employees are driven by the fact that they can collect up to 100% of their hard-earned rewards, gratuities, or service with the understanding that they have a role in how they are distributed. Exemption from National Insurance contributions is one of the benefits provided to enterprises. They will leverage these benefits even more if the system is managed through machine learning.
What is included in Tronc Benefits?
Only discretionary tips, gratuities, and service charges can be distributed using a tronc benefits. All gratuities left on cards and service costs added to the bill are normally included. It also includes monetary tips if they are shared instead than being kept by the person.
It is left to the firm to determine how much of the service costs paid by customers is included in the tronc, but with increased government pressure and the recent Queen’s address, new legislation appears to be on the way that would require all voluntary tips to go to employees.
Businesses frequently keep a tiny amount of card gratuities to cover payment processing expenses, but this practice may have to alter if the new regulation takes effect.
Choose the most appropriate tronc structure and managing it with machine learning
More companies than ever are using payroll AI and machine learning to manage employee compensation systems. Machine learning can be even more helpful with tronc management, since it is so much harder to project actual earnings.
The structure of your tronc is determined by a variety of factors, and it can be complicated and appear to change constantly. It is critical to acquire the appropriate guidance immediately away, or your company mind end up making a mistake. Fortunately, machine learning technology can help immensely.
Pearl Lemon Accountants may not only give consulting services to help you set up your tronc, but we can also function as the troncmaster for you, assuring impartiality in tip allocation and even paying premiums on your behalf with our Tronc Complete service.