Archives October 2021

Fresh updates: Google Cloud 2021 Summits

Fresh updates: Google Cloud 2021 Summits

There are a lot of great things happening at Google Cloud, and we’re delighted to share new product announcements, customer perspectives, interactive demos, and more through our Google Cloud Summit series, a collection of digital events taking place over the coming months.

Join us to learn more about how Google Cloud is transforming businesses in various industries, including Manufacturing & Supply Chain, Retail & Consumer Goods, and Financial Services. We’ll also be highlighting the latest innovations in data, artificial intelligence (AI) and machine learning (ML), security and more. 

Content will be available for on-demand viewing immediately following the live broadcast of each event. Bookmark this page to easily find updates as news develops, and don’t forget to register today or watch summits on demand by visiting the Summit series website.

Upcoming events

Government & Education Summit | Nov 3-4, 2021

Mark your calendars – registration is open for Google Cloud’s Government and Education Summit, November 3–4, 2021.

Government and education leaders have seen their vision become reality faster than they ever thought possible. Public sector leaders embraced a spirit of openness and created avenues to digital transformation, accepting bold ideas and uncovering new methods to provide public services, deliver education and achieve groundbreaking research. At Google Cloud, we partnered with public sector leaders to deliver an agile and open architecture, smart analytics to make data more accessible, and productivity tools to support remote work and the hybrid workforce. 

The pandemic has served as a catalyst for new ideas and creative solutions to long-standing global issues, including climate change, public health, and resource assistance. We’ve seen all levels of government and education leverage cloud technology to meet these challenges with a fervor and determination not seen since the industrial revolution. We can’t wait to bring those stories to you at the 2021 Google Cloud Government and Education Summit.

The event will open doors to digital transformation with live Q&As, problem-solving workshops and leadership sessions, designed to bring forward the strongest talent, the most inclusive teams, and the boldest ideas. Interactive, digital experiences and sessions that align with your schedule and interests will be available, including dedicated sessions and programming for our global audiences.

Register today for the 2021 Google Cloud Government and Education Summit. Moving into the next period of modernization, we feel equipped with not just the technology, but also the confidence to innovate and the experience to deliver the next wave of critical digital transformation solutions.

Digital Manufacturer Summit | June 22, 2021

Together we can transform the future of our industry. At Google Cloud’s Digital Manufacturer Summit customers will hear from Porsche, Renault Group, Doosan Heavy Industries & Construction, GE Appliances and Landis+Gyr who are boosting productivity across their enterprise with digital solutions powered by AI and analytics. 

Google Cloud recently launched a report and blog on AI Acceleration, which reveals that the COVID-19 pandemic may have spurred a significant increase in the use of AI and other digital enablers among manufacturers. We will continue this thought leadership in the summit.

Hear from forward-thinking business executives as they discuss the latest trends and the future of the industry. Participate in focused sessions and gain game-changing insights that dive deep into customer experience, product development, manufacturing operations, and supply chain operations. 

Register now: Global & EMEA

APAC Technical Series | June 22 – 24, 2021

IT and business professionals located in the Asia Pacific region can continue their cloud technology learnings by taking part in a three-day deep-dive into the latest data and machine learning technologies. This event will help you harness data and unlock innovation to build, iterate, and scale faster and with confidence. 

Register now: APAC

Security Summit | July 20, 2021

At Google Cloud Security Summit, security professionals can learn why many of the world’s leading companies trust Google Cloud infrastructure, and how organizations can leverage Google’s cloud-native technology to keep their organization secure in the cloud, on-premises, or in hybrid environments. 

During the opening keynote, engaging sessions, and live Q&A, customers will learn about how our Trusted Cloud can help them build a zero-trust architecture, implement shared-fate risk management, and achieve digital sovereignty. Join us to hear from some of the most passionate voices exploring how to make every day safer with Google. Together, we’ll reimagine how security should work in the cloud.

Register now: NORTHAM & EMEA

Retail & Consumer Goods Summit | July 27, 2021

Are you ready for the continued growth in digital shopping? Do you understand how leveraging AI and ML can improve your business? Join your peers and thought leaders for engaging keynotes and breakout sessions designed for the Retail and CPG industries at our upcoming Retail and Consumer Goods Summit on July 27th.

You’ll learn how some of the world’s leading retail and consumer goods companies like Ulta, Crate & Barrel, Albertsons, IKEA, and L’Oreal are using Google Cloud AI, machine learning, and data analytics technology to accelerate their digital transformation. In addition, we’ll share announcements on new products and solutions to help retailers and brands succeed in today’s landscape. 

Register now: Global

Now available on demand

Data Cloud Summit | May 26, 2021

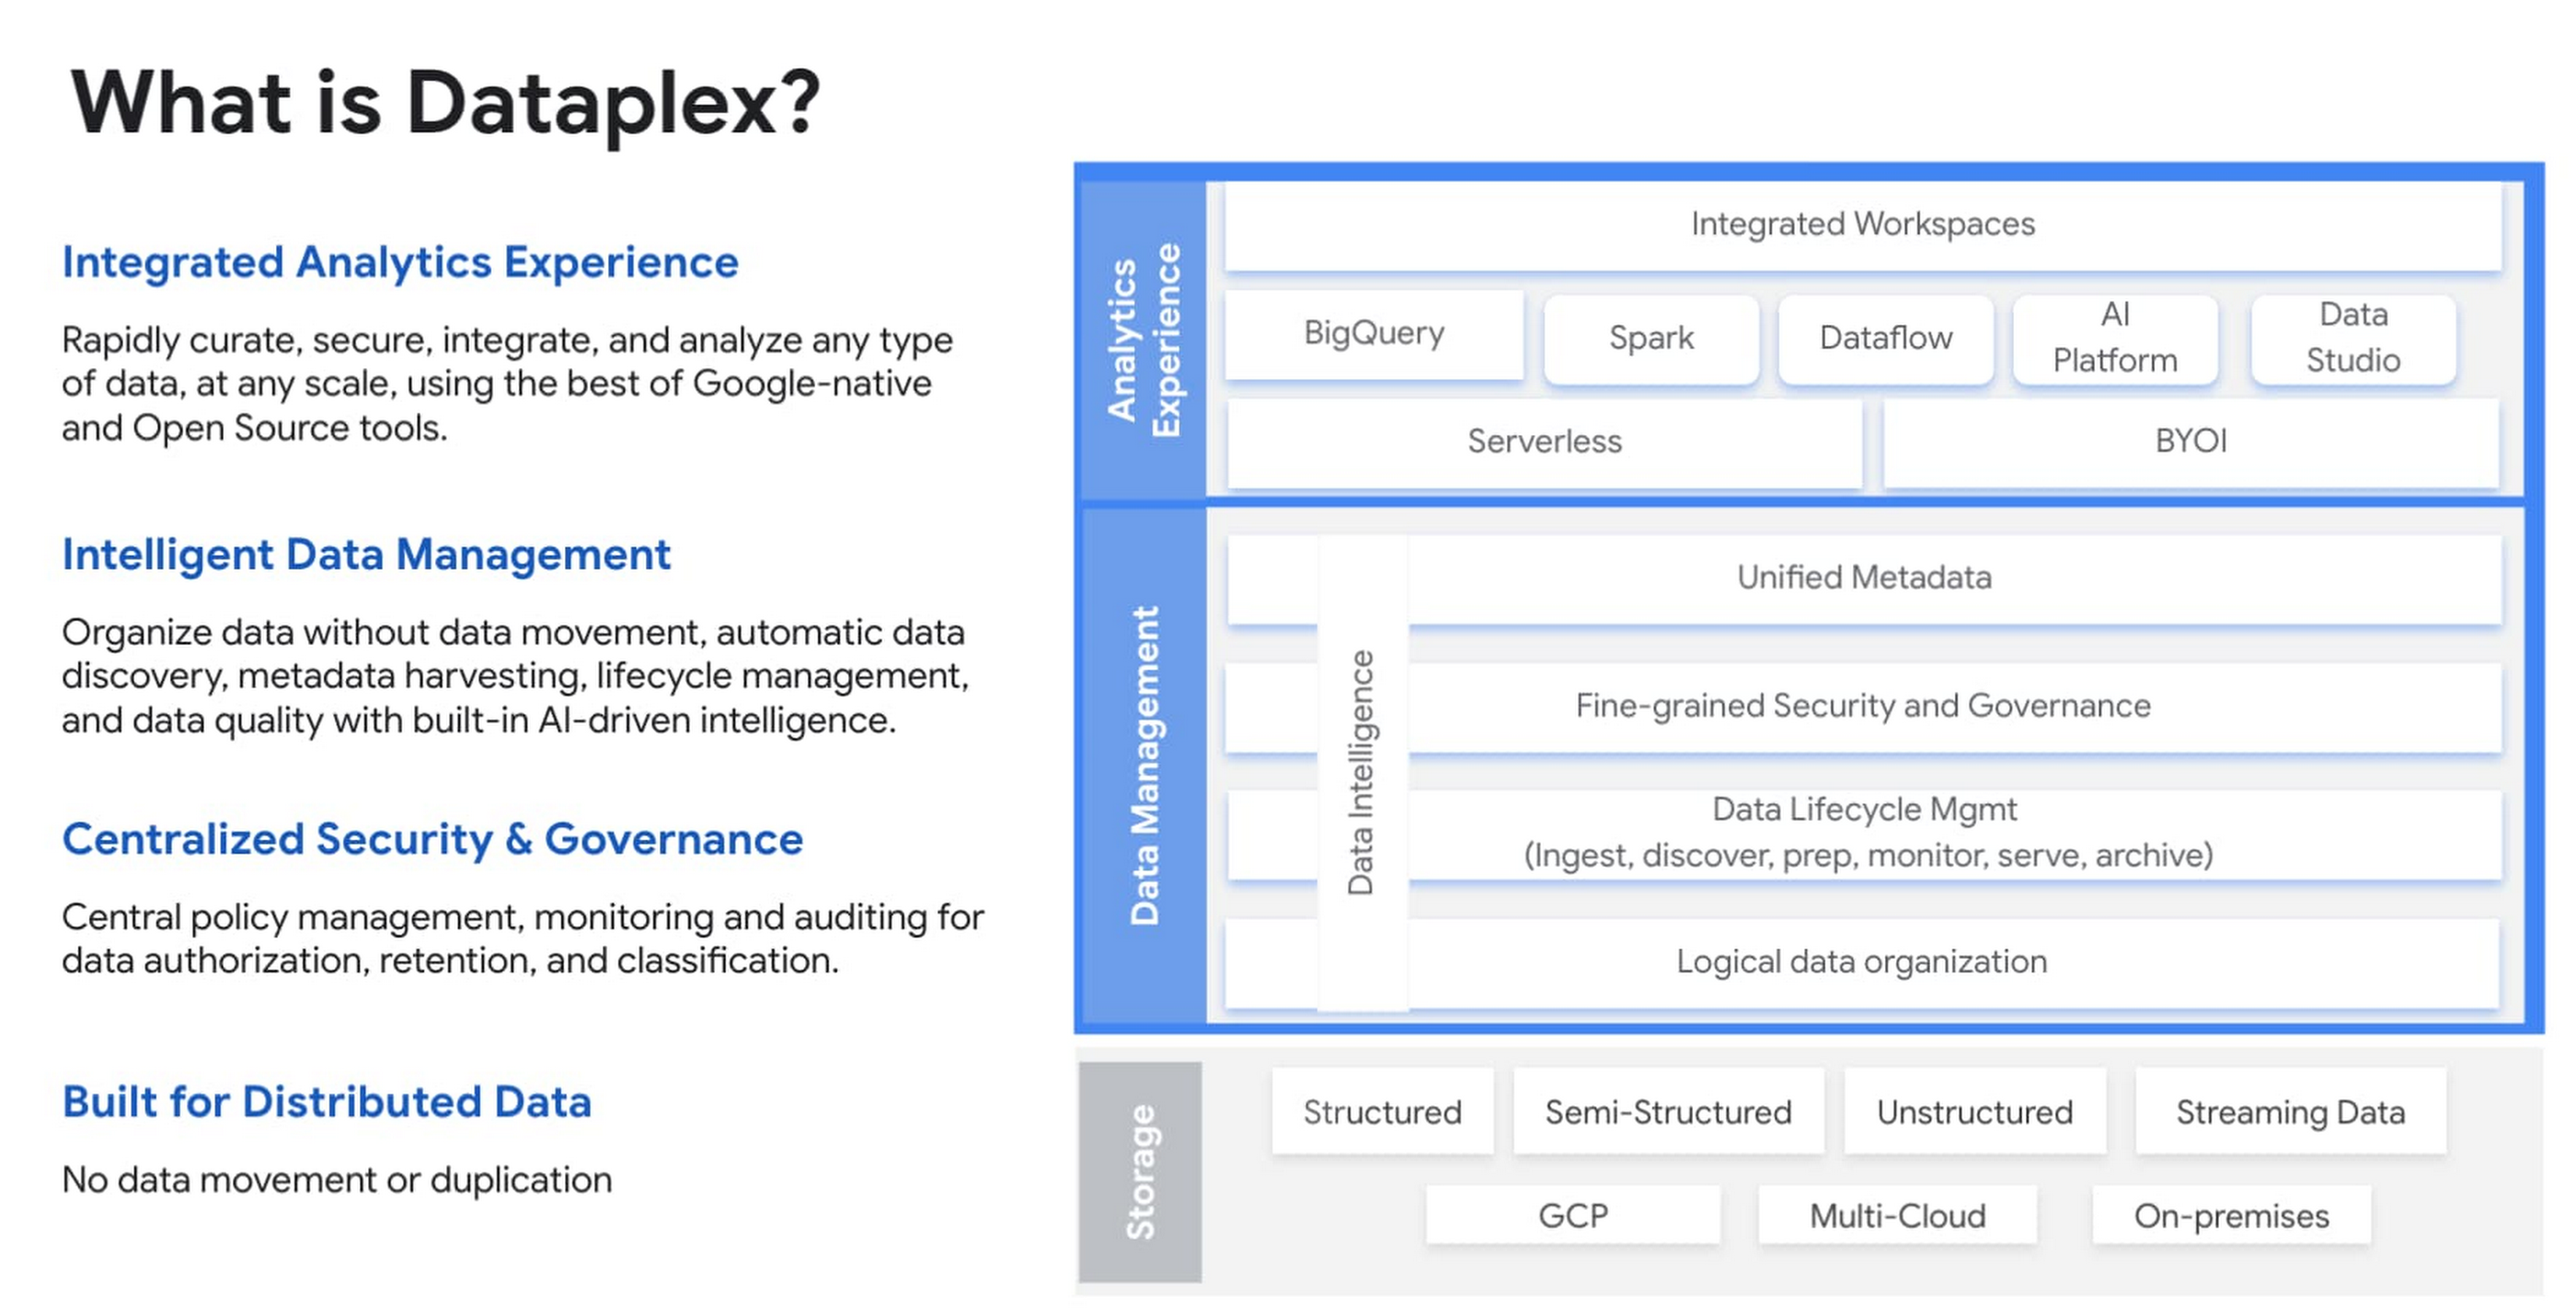
In case you missed it, check out content from the Google Data Cloud Summit, which featured the launch of three new solutions – Dataplex, Analytics Hub and Datastream – to provide organizations with a unified data platform. The summit also featured a number of engaging discussions with customers including Zebra Technologies, Deutsche Bank, Paypal, Wayfair and more.

Watch on-demand now: Global

Financial Services Summit | May 27, 2021

We launched Datashare at the Financial Services Summit; this solution is designed to help capital markets firms share market data more securely and efficiently. Attendees can also view sessions on a range of topics including sustainability, the future of home buying, embedded finance, dynamic pricing for insurance, managing transaction surges in payments, the market data revolution, and more. Customers such as Deutsche Bank, BNY Mellon, HSBC, Credit Suisse, PayPal, Global Payments, Roostify, AXA, Santander, and Mr Cooper shared their insights as well. 

Watch on-demand now: NORTHAM & EMEA

We have also recently launched several new blog posts tied to the Financial Services Summit: 

Introducing Datashare solution for financial services for licensed market data discovery, access and analytics on Google Cloud

Google Cloud for financial services: driving your transformation cloud journey

How insurers can use severe storm data for dynamic pricing

Why embedding financial services into digital experiences can generate new revenue 

Applied ML Summit | June 10, 2021

The Google Applied ML Summit featured a range of sessions to help data scientists and ML engineers explore the power of Google’s Vertex AI platform, and learn how to accelerate experimentation and production of ML models.  Besides prominent Google AI/ML experts and speakers, the event also featured over 16 ML leaders from customers and partners like Spotify, Uber, Mr. Cooper, Sabre, PyTorch, L’Oreal, Vodafone and WPP/Essence.

Watch on-demand now: Global

Related Article

Save the date for Google Cloud Next ‘21: October 12-14, 2021

Join us and learn how the most successful companies have transformed their businesses with Google Cloud. Sign-up at g.co/cloudnext for up…

Read Article

Source : Data Analytics Read More

Quickly, easily and affordably back up your data with BigQuery table snapshots

Quickly, easily and affordably back up your data with BigQuery table snapshots

Mistakes are part of human nature. Who hasn’t left their car unlocked or accidentally hit “reply all” on an email intended to be private? But making mistakes in your enterprise data warehouse, such as accidentally deleting or modifying data, can have a major impact on your business. 

BigQuery time travel, which is automatically enabled for all datasets, lets you quickly access the state of a table as of any point in time within the last 7 days. However, recovering tables using this feature can be tricky as you need to keep track of the “last known good” time. Also, you may want to maintain the state of your data beyond the 7 day window, for example, for auditing or regulatory compliance requirements. This is where the new BigQuery table snapshots feature comes into play.

Table snapshots are available via the BigQuery API, SQL, command line interface, or the Google Cloud Console. Let’s look at a quick example in the Cloud Console.

First, we’ll create a new dataset and table to test out the snapshot functionality:

Next, open to the properties page for the newly created table by selecting it in the Explorer pane. The source table for a snapshot is called the base table.

While you can use SQL or the BigQuery command line tool to create a snapshot, for this example we’ll create a snapshot of the inventory table using the Snapshot button in the Cloud Console toolbar.

BigQuery has introduced a new IAM permission (bigquery.tables.createSnapshot) that is required for the base table in addition to the existing bigquery.tables.get and bigquery.tables.getData permissions. This new permission has been added to the bigQuery.dataViewer and bigQuery.dataEditor roles, but will need to be added to any custom roles that you have created.

Table snapshots are treated just like regular tables, except you can’t make any modifications (either data or schema) to them. If you create a snapshot in the same dataset as the base table, you will need to give it a unique name or use the suggested name which appends a timestamp on to the end of the table name. 

If you want to use the original table name as the snapshot name, you will need to create it in a new dataset so there will be no naming conflicts. For example, you could write a script to create a new dataset and create snapshots of all of the tables from a source dataset, preserving their original names. Note that when you create a snapshot in another dataset, it will inherit the security configuration of the destination dataset, not the source.

You can optionally enter a value into the Expiration time field and have BigQuery automatically delete the snapshot at that point in time. You can also optionally specify a value in the Snapshot time field to create the snapshot from a historical version of the base table within the time travel window. For example, you could create a snapshot from the state of a base table as of 3 hours ago.

For this example, I’ll use the name inventory-snapshot. A few seconds after I click Save, the snapshot is created. It will appear in the list of tables in the Explorer pane with a different icon.

The equivalent SQL for this operation would be:

Now, let’s take a look at the properties page for the new table snapshot in the Cloud Console.

In addition to the general snapshot table information, you see information about the base table that was used to create the snapshot, as well as the date and time that the snapshot was created. This will be true even if the base table is deleted. Although the snapshot size displays the size of the full table, you will only be billed (using standard BigQuery pricing) for the difference in size between the data maintained in the snapshot and what is currently maintained in the base table. If no data is removed, or changed in the base table, there will be no additional charge for the snapshot.

As a snapshot is read-only, If you attempt to modify the snapshot table data via DML or change the schema of the snapshot via DDL, you will get an error. However, you can change snapshot properties such as description, expiration time, or labels. You can also use table access controls to change who has access to the snapshot, just like any other table. 

Let’s say we accidentally deleted some data from the base table. You can simulate this by running the following commands in the SQL workspace.

You will see that the base table now has only 6 rows, while the number of rows and size of the snapshot has not changed. If you need to access the deleted data, you can query the snapshot directly. For example, the following query will show you that the snapshot still has 7 rows:

However, if you want to update the data in a snapshot, you will need to restore it to a writable table. To do this, click the Restore button in the Cloud Console.

By default, the snapshot will be restored into a new table. However, if you would like to replace an existing table, you can use the existing table name and select the Overwrite table if it exists checkbox.

This operation can also be performed with the BigQuery API, SQL, or CLI. The equivalent SQL for this operation would be:

In this blog, we’ve demonstrated how to use the Google Cloud Console and the new table snapshots feature to easily create backups of your BigQuery tables. You can also create periodic (daily, monthly, etc.) snapshots of tables using the BigQuery scheduled query functionality. Learn more about table snapshots in the BigQuery documentation.

Related Article

BigQuery Admin reference guide: Storage internals

Learn how BigQuery stores your data for optimal analysis, and what levers you can pull to further improve performance.

Read Article

Source : Data Analytics Read More

Open data lakehouse on Google Cloud

Open data lakehouse on Google Cloud

For more than a decade the technology industry has been searching for optimal ways to store and analyze vast amounts of data that can handle the variety, volume, latency, resilience, and varying data access requirements demanded by organizations.

Historically, organizations have implemented siloed and separate architectures, data warehouses used to store structured aggregate data primarily used for BI and reporting whereas data lakes, used to store unstructured and semi-structured data, in large volumes, primarily used for ML workloads. This approach often resulted in extensive data movement, processing, and duplication requiring complex ETL pipelines. Operationalizing and governing this architecture was challenging, costly and reduced agility. As organizations are moving to the cloud they want to break these silos. 

To address some of these issues,a new architecture choice has emerged: the data lakehouse, which combines key benefits of data lakes and data warehouses. This architecture offers low-cost storage in an open format accessible by a variety of processing engines like Spark while also providing powerful management and optimization features. 

At Google cloud we believe in providing choice to our customers. Organizations that want to build their data lakehouse using open source technologies only can easily do so by using low cost object storage provided by Google Cloud Storage, storing data in open formats like Parquet, with processing engines like Spark and use frameworks like Delta, Iceberg or Hudi through Dataproc to enable transactions. This open source based solution is still evolving and requires a lot of effort in configuration, tuning and scaling. 

At Google Cloud, we provide a cloud native, highly scalable and secure, data lakehouse solution that delivers choice and interoperability to customers. Our cloud native architecture reduces cost and improves efficiency for organizations.  Our solution is based on:

Storage: Providing choice of storage across low cost object storage in Google Cloud Storage or highly optimized analytical storage in BigQuery

Compute: Serverless compute that provide different engines for different workloads

BigQuery, our serverless cloud data warehouse provides ANSI SQL compatible engine that can enable analytics on petabytes of data.

Dataproc, our managed Hadoop and Spark service enables using various open source frameworks

Serverless Spark, allows customers to submit their workloads to a managed service and take care of the job execution. 

Vertex AI, our unified MLOps platform enables building large scale ML models with very limited coding

Additionally you can use many of our partner products like Databricks, Starburst or Elastic for various workloads.

Management: Dataplex enables a metadata-led data management fabric across data in Google Cloud Storage (object storage) and BigQuery (highly optimized analytical storage). Organizations can create, manage, secure, organize and analyze data in the lakehouse using Dataplex.

Let’s take a closer look at some key characteristics of a data lakehouse architecture and how customers have been building this on GCP at scale. 

Storage Optionality

At Google Cloud our core principle is delivering an open platform. We want to provide customers with a choice of storing their data in low cost object storage in Google Cloud Storage or highly optimized analytical storage or other storage options available on GCP. We recommend organizations store their structured data in BigQuery Storage. BigQuery Storage also provides a streaming API that enables organizations to ingest large amounts of data in real-time and analyze it. We recommend unstructured data to be stored in Google Cloud storage. In some cases where organizations need to access their structured data in OSS formats like Parquet or ORC they can store them on Google Cloud Storage. 

At Google Cloud we have invested in building Data Lake Storage API also known as BigQuery Storage API to provide consistent capabilities for structured data across both BigQuery and GCS storage tiers. This API enables users to access BigQuery Storage and GCS through any open source engine like Spark, Flink etc. Storage API enables users to apply fine grained access control on data in BigQuery and GCS storage (coming soon).

Serverless Compute

The data lakehouse enables organizations to break data silos and centralize data, which facilitates various different types of use cases across organizations. To get maximum value from data, Google Cloud allows organizations to use different execution engines, optimized for different workloads and personas to run on top the same data tiers. This is made possible because of complete separation of compute and storage on Google Cloud.  Meeting users at their level of data access including SQL, Python, or more GUI-based methods mean that technological skills do not limit their ability to use data for any job. Data scientists may be working outside traditional SQL-based or BI types of tools. Because BigQuery has the storage API, tools such as AI notebooks, Spark running on Dataproc, or Spark Serverless can easily be integrated into the workflow. The paradigm shift here is that the data lakehouse architecture supports bringing the compute to the data rather than moving the data around. With serverless Spark and BigQuery, data engineers can spend all their time on the code and logic. They do not need to manage clusters or tune infrastructure. They submit SQL or PySpark jobs from their interface of choice, and processing is auto-scaled to match the needs of the job.

BigQuery leverages serverless architecture to enable organizations to run large scale analytics using a familiar SQL interface. Organizations can leverage BigQuery SQL to run analytics on petabyte scale data sets. In addition, BigQuery ML democratizes machine learning by letting SQL practitioners build models using existing SQL tools and skills. BigQuery ML is another example of how customers’ development speed can be increased by using familiar dialects and the need to move data.  

Dataproc, Google Cloud’s managed Hadoop, can read the data directly from lakehouse storage; BigQuery or GCS and run its computations, and write it back. In effect, users are given freedom to choose where and how to store the data and how to process it depending on their needs and skills. Dataproc enables organizations to leverage all major OSS engines like Spark, Flink, Presto, Hive etc.  

Vertex AI is a managed machine learning (ML) platform that allows companies to accelerate the deployment and maintenance of artificial intelligence (AI) models. Vertex AI natively integrates with BigQuery Storage and GCS to process both structured and unstructured data. It enables data scientists and ML engineers across all levels of expertise to implement Machine Learning Operations (MLOps) and thus efficiently build and manage ML projects throughout the entire development lifecycle. 

Intelligent data management and governance

The data lakehouse works to store the data in a single-source-of-truth, making minimal copies of the data. Consistent security and governance is key to any lakehouse. Dataplex, our intelligent data fabric service, provides data governance and security capabilities across various lakehouse storage tiers built on GCS and BigQuery. Dataplex uses metadata associated with the underlying data to enable organizations to logically organize their data assets into lakes and data zones. This logical organization can span across data stored in BigQuery and GCS. 

Dataplex sits on top of the entire data stack to unify governance and data management. It provides a unified data fabric that enables enterprises to intelligently  curate,secure and govern data, at scale, with an integrated analytics experience. It provides automatic data discovery and schema inference across different systems and complements this with automatic registration of metadata as tables and filesets into metastores. With built-in data classification and data quality checks in Dataplex, customers have access to data they can trust.

Data sharing: is one of the key promises of evolved data lakes is that different teams and different personas can share the data across the organization in a  timely manner. To make this a reality and break organizational barriers, Google offers a layer on top of BigQuery called Analytics Hub. Analytics Hub provides the ability to create private data exchanges, in which exchange administrators (a.k.a. data curators) give permissions to publish and subscribe to data in the exchange to specific individuals or groups both inside the company and externally to business partners or buyers. (within or outside of their organization). 

Open and flexible

In the ever evolving world of data architectures and ecosystems, there are a growing suite of tools being offered to enable data management, governance, scalability, and even machine learning. 

With promises of digital transformation and evolution, organizations often find themselves with sophisticated solutions that have a significant amount of bolted-on functionality. However, the ultimate goal should be to simplify the underlying infrastructure,and enable teams to focus on their core responsibilities: data engineers make raw data more useful to the organization, data scientists explore the data and produce predictive models so business users can make the right decision for their domains.

Google Cloud has taken an approach anchored on openness, choice and simplicity and offers a planet-scale analytics platform that brings together two of the core tenants of enterprise data operations, data lakes and data warehouses into a unified data ecosystem.  

The data lakehouse is a culmination of this architectural effort and we look forward to working with you to enable it at your organization. For more interesting insights on lakehouse, you can read the full whitepaper here.

Related Article

Read Article

Source : Data Analytics Read More

What You Should Adjust in Windows to Improve Data Security

What You Should Adjust in Windows to Improve Data Security

Data security has become a vital topic of concern for consumers all over the world. Countless people have had to contend with the consequences of having their personal data exposed.

Data breaches are most widely publicized when they occur at major corporations, such as Target. Unfortunately, these high profile cases take attention away from the need to invest in data security solutions at home. Many hackers try to steal data directly from individual consumers, so they must take all necessary efforts to safeguard it. This can be even more important when working from home, since being online leaves hackers with more opportunities to steal your data.

Hewlett Packard has some tips on finding out if your computer has been hacked. However, if you see these signs it may already be too late. One of the most important things that you can do is try to adjust your Windows settings to thwart hackers.

Windows Users Must Be Diligent About Stopping Hackers from Accessing their Data

Windows is the most popular desktop operating system out there by far, having solely monopolized the OS markets for decades. Since billions of us across the globe use Windows daily and trust the software with our sensitive, confidential, and personal data, it is important not to forget to be vigilant about safety while using Windows. Some practices, like backing up your Windows machine can make or break your life, literally, if you lose your most precious data. You would not drive without a seatbelt, so why would you run your Windows without good knowledge of its security options and settings?

For these reasons, we will look into some industry-standard best practices as well as more advanced ways of improving your Windows cybersecurity by leaps and bounds.

Windows Settings For Optimal Security

You may have heard that Microsoft has taken steps to protect customer data from the NSA. As nice as that may sound, their data is still at risk.

Just like any operating system, no matter if it is a macOS or Android, there are several things that a user has to set up for better performance, better efficiency, and most importantly better security than what comes out of the box. These settings are not set by default because users may prefer different configurations for different purposes, so only basic security settings are activated by the manufacturer on a new machine. The rest is up to you to make an informed decision.

Windows has existed for a long time, and every iteration of Windows has been better and better in terms of several factors including security. The more recent version of Windows, namely Win 10 and Win 11 are security powerhouses, but if you do not know how to interact with these features, you will not reap the full benefits. Windows is usually loaded with a lot more trash than other operating systems (ware) and is also a larger platform that accepts a lot more third-party applications (external) than, say, Apple’s systems. This means that your data can be easily exposed. It is also designed to be backward-compatible with older software, which opens more security holes. However, this does not mean that you cannot adjust Windows to operate at a squeaky clean, bulletproof level. It just takes a bit of time looking through and toggling some Windows Security settings.

Here is a quick list of some settings that we need to talk about that includes both security and privacy-related settings;

Windows FirewallInstallation settingsCortanaAd trackingLocation trackingApp access and permissionsUninstall unnecessary programsSystem ProtectionWindows DefenderDevice SecurityApp & Browser ControlVirus & Threat Protection

First off, in case you are installing a fresh copy of Windows yourself, avoid the ‘Express’ setting at install and opt for a ‘Custom’ set up. When opting for this type of setup, you will be more in control of what settings Windows applies, such as learning more about what Diagnostics Windows records, use of location services, Cortana, etc. as well as a full Privacy Statement for you to read. You can also disable any data collection, diagnostics, and location tracking settings in Settings>Accounts and Settings>Privacy. Cortana can also be, and should be, switched off (like the tracking features) in Settings unless you explicitly need the voice-activated assistant. Keep in mind that Cortana does monitor your system and your activities by default.

Furthermore, make sure that your Windows Firewall (again you can find it via search) is ON. As far as app access and permissions goes, primarily it is important to uninstall (search for ‘Add Remove’ programs) any programs that you do not want on your PC. These programs can contain malware, and unnecessarily hog your PC’s resources in the background. Another thing to keep in mind is which programs and apps you have given your camera, microphone, and other access permissions to (search for App Permissions). Also, if your device supports it, you will be able to access an area of settings called ‘Device Security where you can toggle helpful hardware security features on and off, such as ‘Core Isolation’, ‘Memory Integrity’, and others. Such settings are designed to fight severe cyberattacks,

For optimal protection against dangerous cyberattacks and hackers, it is advisable to ensure that your Windows Defender Smart Screen is enabled, as well as your UAC or User Account Control. There is also the option of enabling Microsoft’s Bitlocker, which is a disc encryption tool (although this is only offered in Win 10 Pro and Enterprise).

Modern Windows versions like 10 and 11 already come with security features enabled by default, such as DEP or Data Execution Prevention for 64-bit applications, ASLR, SEHOP, and more. However, it is up to you to configure options like your Microsoft Defender’s Antivirus and SmartScreen, your Windows Firewall as well as BitLocker encryption. Finally, once you have cleaned up unnecessary programs, and taken the other tips in this article into account, you could also greatly benefit from;

Installing a premium antimalware programUsing a premium VPN when connecting to the internetUsing a security-focused web browser instead of Microsoft EdgePracticing internet browsing best practices like learning about phishing

Data Privacy Must Be a Priority for Windows Users

If you own a device with the Windows operating system, then you have to make sure that data privacy is a top concern. You need to make sure that your settings are adjust to stop hackers from accessing your data.

The post What You Should Adjust in Windows to Improve Data Security appeared first on SmartData Collective.

Source : SmartData Collective Read More

What Are the Benefits of Cloud Computing?

What Are the Benefits of Cloud Computing?

Cloud Computing is the next big thing that is becoming popular all over the world, especially for the bigger Enterprises. People are now open the cloud computing options because they want to save the data for a longer term to make sure that they don’t lose data in case of any emergency.

Cloud computing has been in the industry for more than two decades now, and it has been continuously providing competitive benefits to everybody in the industry.

Overall, around 69% of the international data has been stored using the cloud computing technique. Over there are around 94% of businesses claim to see an improvement in terms of security with the cloud computing technique and process.

Some of the major benefits of cloud computing are mentioned below.

There are a number of amazing reasons to invest in cloud computing. You want to make sure that you know how to use it effectively, because it can pay huge dividends for your business if you know how to invest in it.

Cloud Computing is cost-saving. You will be saving a good amount of money with efficient Cloud Computing techniques. This is the reason why people no longer invest in other security options for storing and saving the data; instead, they use cloud computing techniques that are a lot more cost-effective and Secure.

A lot of data companies are also working on cloud computing techniques to get excellent flexibility and mobility option. With the cloud computing techniques, the industries have greater insight into the data and can forecast a lot more than they do before the given time period.

Cloud Computing is the future, providing better insight and better collaboration options. With better collaboration options, the industries are increasing their revenue and benefits to a huge level. Quality control is also possible, along with the disaster recovery option.

You no longer have to keep preventing the data from security threats and other issues. Because with the cloud computing option, you will be having a good amount of safety without any difficulty that too with the automatic updates on the software. There is always a competitive edge that you will be getting when you are using cloud computing, and sustainability is always top-notch. There are a lot of companies that are providing Cloud Computing services that you must go for based on your requirement for saving and preventing the data.

These security option will not only significantly save the data, but you will also be moving towards an efficient option in terms of storing your data. You no longer have to go for the conventional techniques of in-house storage of data. Internal data theft is not possible when you are using Cloud Computing. The intelligent Cloud Computing options will provide your disclaimer before the disaster and also offer you disaster recovery options. There are around 9% of the users who have been using cloud computing that claim for better disaster recovery when using Cloud Computing. Moreover, the revenue generation is approximately 53% more as compared to the competitors.

Another very important benefit of cloud computing is that it helps with data scalability. You can store far more data on your cloud servers than you could ever hope to store on your internal networks or hard discs. When you combine this with the fact that cloud technology makes it easier to back data up, you will start to see a lot of great benefits of using cloud technology for your company.

So how about you check the cloud services Toronto – dynamix solutions to get your best Cloud Computing solution.

The post What Are the Benefits of Cloud Computing? appeared first on SmartData Collective.

Source : SmartData Collective Read More

Top 5 Tools for Building an Interactive Analytics App

Top 5 Tools for Building an Interactive Analytics App

An interactive analytics application gives users the ability to run complex queries across complex data landscapes in real-time: thus, the basis of its appeal. The application presents a massive volume of unstructured data through a graphical or programming interface using the analytical abilities of business intelligence technology to provide instant insight. Furthermore, this insight can be modified and recalibrated by changing input variables through the interface. Interactive analytics applications present vast volumes of unstructured data at scale to provide instant insights.

The image above shows a typical example of an interactive analytics application. It shows that someone is interacting with the data changing different inputs to navigate through unstructured data. 

Why Use an Interactive Analytics Application?

Every organization needs data to make many decisions. The data is ever-increasing, and getting the deepest analytics about their business activities requires technical tools, analysts, and data scientists to explore and gain insight from large data sets. Interactive analytics applications make it easy to get and build reports from large unstructured data sets fast and at scale.

There are many tools in the market right now to assist with building interactive analytics applications. In this article, we’re going to look at the top 5.

Top 5 Tools for Building an Interactive Analytics App

1.  Firebolt

Firebolt makes engineering a sub-second analytics experience possible by delivering production-grade data applications & analytics. It is built for flexible elasticity: it can easily be scaled up or down in response to the workload of an application with just a click or an execution of a command.

It is scalable because of its decoupled storage and computed architecture. You can use firebolt programmatically through REST API, JDBC, and SDKs — that makes it easy to use. Firebolt is super-fast compared to other popular tools to build interactive analytics apps. 

Firebolt also makes common data challenges such as slow queries and frequently changing schema easy to deal with at a reasonable price — $1.54/hour (Engine:1 x c5d.4xlarge). 

2.  Snowflake

Snowflake provides the right balance between the cloud and data warehousing, especially when data warehouses like Teradata and Oracle are becoming too expensive for their users. It is also easy to get started with Snowflake as the typical complexity of data warehouses like Teradata and Oracle are hidden from the users. 

It is secure, flexible, and requires less management compared to traditional warehouses. Snowflake allows its users to unify, integrate, analyze, and share previously stored data at scale and concurrency through a management platform. 

Snowflake offers a “pay for what you use” service but doesn’t state a price; they only highlight the “start for free” button on the website.

3.  Google BigQuery

Google BigQuery is a serverless and cost-effective multi-cloud data warehouse. It is designed for business agility, and that is why it is highly scalable. It offers new customers $300 in free credits during the first 90 days. BigQuery also takes it further by giving all of their customers 10 GB storage and up to 1 TB queries/month for free. 

Its built-in machine learning makes it possible for users to gain insights predictive and real-time analytics. Accessing data stored on Google BigQuery is secured with default and customer-managed encryption keys, and you can easily share any business intelligence insight derived from such data with teams and members of your organization with a few clicks. 

Google BigQuery also claims to provide 99.99% uptime SLA. It offers a “pay for what you” service.

4.  Druid

Druid is a real-time analytics database from Apache. It is a high-performing database that is designed to build fast, modern data applications. Druid is specifically designed to support workflows that require fast ad-hoc analytics, concurrency, and instant data visibility are core necessities.

It is easy to integrate with any existing data pipelines, and it can also stream data from the most popular message buses such as Amazon Kinesis and Kafka. It can also batch load files from data lakes such as Amazon S3 and HDFS. Druid is purposefully built to deploy in public, private, and hybrid clouds and use indexing structures, exact and approximate queries to get the most results fast. 

Druid has no initial price.

5.  Amazon Redshift

Amazon Redshift is a fast and widely used data warehouse. It is a fully managed and scalable data warehouse service that is cost-effective to analyze all your data with existing business intelligence tools efficiently. It is easily integrated with the most popular business intelligence tools like Microsoft PowerBI, Tableau, Amazon QuickSight, etc.

Like other listed data warehouses, it is optimized for datasets ranging from a few hundred gigabytes to a petabyte or more to build insight-driven reports and dashboards at costs less than $1,000 per terabyte per year. That is very cheap compared to traditional data warehouses. In addition, Amazon Redshift ML can automatically create, train, and deploy Amazon SageMaker ML. You can also access real-time operational analytics with the capability of Amazon Redshift.

Conclusion

Building interactive analytics applications are critical for organizations to get quick insight that can help their operations. Interactive analysis applications work best with accessible data centralized in a data warehouse; therefore, there is a need to have analysis tools that make building applications easy, effective and efficient.

For this purpose, this article’s tools such as Firebolt, Snowflake, Amazon Redshift, Google BigQuery, and Apache Druid are very suitable. If you are building an interactive analysis application, pick one of them that is suitable for your needs in terms of efficiency, cost, and scalability and run with it.

The post Top 5 Tools for Building an Interactive Analytics App appeared first on SmartData Collective.

Source : SmartData Collective Read More

BigQuery Omni now available for AWS and Azure, for cross cloud data analytics

BigQuery Omni now available for AWS and Azure, for cross cloud data analytics

2021 has been a year punctuated with new realities.  As enterprises now interact mainly online, data and analytics teams need to better understand their data by collaborating across organizational boundaries. Industry research shows 90% of organizations have a multicloud strategy which adds complexity to data integration, orchestration and governance. While building and running enterprise solutions in the cloud, our customers constantly manage analytics across cloud providers. These providers unintentionally create data silos that cause friction for data analysts.  This month we announced the availability of BigQuery Omni, a multicloud analytics service that lets data teams break down data silos by using BigQuery to securely and cost effectively analyze data across clouds. 

For the first time, customers will be able to perform cross-cloud analytics from a single pane of glass, across Google Cloud, Amazon Web Services (AWS) and Microsoft Azure. BigQuery Omni will be available to all customers on AWS and for select customers on Microsoft Azure during Q4.  BigQuery Omni enables secure connections to your S3 data in AWS or Azure Blob Storage data in Azure. Data analysts can query that data directly through the familiar BigQuery user interface, bringing the power of BigQuery to where the data resides. 

Here are a few ways BigQuery Omni addresses the new reality customers face with multi cloud environments: 

Multicloud is here to stay: Enterprises are not consolidating, they are expanding and proliferating their data stack across clouds. For financial, strategic, and policy reasons customers need data residing in multiple clouds. Data platforms support for multicloud has become table stakes functionality. 

Multicloud data platforms provide value across clouds: Almost unanimously, our preview customers echoed that the key to providing game-changing analytics was through providing more functionality and integration across clouds.  For instance,  customers wanted to join player and ad engagement data to better understand campaign effectiveness. They wanted to join online purchases data with in-store checkouts to understand how to optimize the supply chain. Other scenarios included joining inventory and ad analytics data to drive marketing campaigns, and service and subscription data to understand enterprise efficiency. Data analysts require the ability to join data across clouds, simply and cost-effectively.

Multicloud should work seamlessly: Providing a single-pane-of-glass over all data stores empowers a data analyst to extend their ability to drive business impact without learning new skills and shouldn’t need to worry about where the data is stored. Because BigQuery Omni is built using the same APIs as BigQuery, where data is stored (AWS, Azure, or Google Cloud) becomes an implementation detail. 

Consistent security patterns are crucial for enterprises to scale: As more data assets are created, providing the correct level of access can be challenging. Security teams need control over all data access with as much granularity as possible to ensure trust and data synchronization. 

Data quality unlocks innovation: Building a full cross-cloud stack is only valuable if the end user has the right data they need to make a decision.  Multiple copies, inconsistent, or out-of-date data all drive poor decisions for analysts. In addition, not every organization has the resources to build and maintain expensive pipelines.

BigQuery customer Johnson & Johnson was an early adopter of BigQuery Omni on AWS; “We found that BigQuery Omni was significantly faster than other similar applications. We could write back the query results to other cloud storages easily and multi-user and parallel queries had no performance issues in Omni. How we see Omni is that it can be a single pane of glass using which we can connect to various clouds and access the data using, SQL like queries,” said Nitin Doeger, Data Engineering and Enablement manager at Johnson and Johnson.

Another early adopter from the media and entertainment industry had data hosted in multiple cloud environments. Using BigQuery Omni they built cross cloud analytics to correlate advertising with in game purchases. Needing to optimize campaign spend and improve targeted ad personalization while lowering the cost per click for ads, their challenge was that campaign data was siloed across cloud environments with AWS, Microsoft Azure, and Google Cloud. In addition to this the data wasn’t synchronized across all environments and moving data introduced complexity, risk and cost. Using BigQuery they were able to analyze CRM data in S3 while keeping the data synchronized. This resulted in a marketing attribution solution to optimize campaign spend and ultimately helped improve campaign efficiency while reducing cost and improving data accessibility across teams. 

In 2022, new capabilities will include cross cloud transfer’ and authorized external tables to help data analysts drive governed, cross-cloud scenarios and workflows all from the BigQuery interface. Cross cloud transfer helps move the data you need to finish your analysis in Google Cloud and find insights leveraging unique capabilities of BigQuery ML, Looker and Dataflow. Authorized external tables will provide consistent and fine grained governance with row-level and column-level security for your data. Together these capabilities will unlock simplified and secure access across clouds for all your analytics needs. Below is a quick demo of those features relevant to multicloud data analysts and scientists.

To get started with BigQuery Omni, simply create a connection to your data stores, and start running queries against your existing data, wherever it resides. Watch the multicloud session at Next 21 for more details. 

BigQuery Omni makes cross cloud analytics possible! We are excited with what the future holds and look forward to hearing about your cross cloud data analytics scenarios. Share your questions with us on the Google Cloud Community, we look forward to hearing from you.

Related Article

Turn data into value with a unified and open data cloud

At Google Cloud Next we announced Google Earth Engine with Bigquery, Spark on Google Cloud and Vertex AI Workbench

Read Article

Source : Data Analytics Read More

Google Cloud Next Rollup for Data Analytics

Google Cloud Next Rollup for Data Analytics

October 23rd (this past Saturday!) was my 4th Googlevarsery and we are wrapping an incredible Google Next 2021!

When I started in 2017, we had a dream of making BigQuery Intelligent Data Warehouse that would power every organization’s data driven digital transformation. 

This year at Next, It was amazing to see Google Cloud’s CEO, Thomas Kurian, kick off his keynote with CTO of WalMart, Suresh Kumar , talking about how his organization is giving its data the “BigQuery treatment”.

AS  I recap Next 2021 and  reflect on our amazing journey over the past 4 years, I’m so proud of the opportunity I’ve had to work with some of the world’s most innovative companies from Twitter to Walmart to Home Depot, Snap, Paypal and many others.   

So much of what we announced at Next is the result of years of hard work, persistence and commitment to delivering the best analytics experience for customers. 

I believe that one of the reasons why customers choose Google for data is because we have shown a strong alignment between our strategy and theirs and because we’ve been relentlessly delivering innovation at the speed they require. 

Unified Smart Analytics Platform 

Over the past 4 years our focus has been to build industries leading unified smart analytics platforms. BigQuery is at the heart of this vision and seamlessly integrates with all our other services. Customers can use BigQuery to query data in BigQuery Storage, Google Cloud Storage, AWS S3, Azure Blobstore, various databases like BigTable, Spanner, Cloud SQL etc. They can also use  any engine like Spark, Dataflow, Vertex AI with BigQuery. BigQuery automatically syncs all its metadata with Data Catalog and users can then run a Data Loss Prevention service to identify sensitive data and tag it. These tags can then be used to create access policies. 

In addition to Google services, all our partner products also integrate with BigQuery seamlessly. Some of the key partners highlighted at Next 21 included Data Ingestion (Fivetran, Informatica & Confluent), Data preparation (Trifacta, DBT),  Data Governance (Colibra), Data Science (Databricks, Dataiku) and BI (Tableau, PowerBI, Qlik etc).

Planet Scale analytics with BigQuery

BigQuery is an amazing platform and over the past 11 years we have continued to innovate in various aspects. Scalability has always been a huge differentiator for BigQuery. BigQuery has many customers with more than 100 petabytes of data and our largest customer is now approaching  an exabyte of data. Our large customers have run queries over trillions of rows. 

But scale for us is not just about storing or processing a lot of data. Scale is also how we can reach every organization in the world. This is the reason we launched BigQuery Sandbox which enables organizations to get started with BigQuery without a credit card. This has enabled us to reach tens of thousands of customers. Additionally to make it easy to get started with BigQuery we have built integrations with various Google tools like Firebase, Google Ads, Google Analytics 360, etc. 

Finally, to simplify adoption we now provide options for customers to choose whether they would like to pay per query, buy flat rate subscriptions or buy per second capacity. With our autoscaling capabilities we can provide customers best value by mixing flat rate subscription discounts with auto scaling with flex slots.

Intelligent Data Warehouse to empower every data analyst to become a data scientist

BigQuery ML is one of the  biggest innovations that we have brought to market over the past few years. Our vision is to make every data analyst a data scientist by democratizing Machine learning. 80% of time is spent in moving, prepping and transforming data for the ML platform. This also causes a huge data governance problem as now every data scientist has a copy of your most valuable data.  Our approach was very simple.  We asked:”what if we could bring ML to data rather than taking data to an ML engine?” 

That is how BigQuery ML was born. Simply write 2 lines of SQL code and create ML models. 

Over the past 4 years we have launched many models like regression, matrix factorization, anomaly detection, time series, XGboost, DNN etc. These  models are used by customers to solve complex  business problems simply from segmentation, recommendations, time series forecasting, package delivery estimation etc. The service is very popular: 80%+ of our top customers are using BigQueryML today.  When you consider that the average adoption rate of ML/AI is in the low 30%, 80% is a pretty good result!

We announced tighter integration of BQML with Vertex AI. Model explainability will provide the ability to explain the results of predictive ML classification and regression models by understanding how each feature contributes to the predicted result. Also users will be able to manage, compare and deploy BigQuery ML models in Vertex; leverage Vertex Pipelines to train and predict BigQuery ML models.

Real-time streaming analytics with BigQuery 

Customer expectations are changing and everyone wants everything in an instant: according to Gartner, by the end of 2024, 75% of enterprises will shift from piloting to operationalizing AI, driving a 5X increase in streaming data and analytics infrastructures.

The BigQuery’s storage engine is optimized for real-time streaming. BigQuery supports streaming ingestion of 10s of millions of events in real-time and there is no impact on query performance. Additionally customers  can use materialized views and BI Engine (which is now GA) on top of streaming data. We guarantee always fast, always fresh data. Our system automatically updates MVs and BI Engine. 

Many customers also use our PubSub service to collect real-time events and process these through Dataflow prior to ingesting into BigQuery. This is a streaming ETL pattern which is very popular. Last year,we announced PubSub Lite to  provide customers with a 90% lower price point and aTCO that is lower than any DIY Kafka deployment. 

We also announced Dataflow Prime, it is our next generation platform for Dataflow. Big Data processing platforms have only focused on horizontal scaling to optimize workloads. But we have seen new patterns and use cases like streaming AI where you may have a few steps in pipelines that perform data prep and then customers  have to run a GPU based model. Customers  want to use different sizes and shapes of machines to run these pipelines in the most optimum manner. This is exactly what Dataflow Prime does. It delivers vertical auto scaling with the right fitting for your pipelines. We believe this should lower costs for pipelines significantly.

With Datastream as our change data capture service (built on Alooma technology), we have solved the last key problem space for customers. We can automatically detect changes in your operational databases like MySQL, Postgres, Oracle etc and sync them in BigQuery.

Most importantly, all these products work seamlessly with each other through a set of templates. Our goal is to make this even more seamless over next year. 

Open Data Analytics with BigQuery

Google has always been a big believer in Open Source initiatives. Our customers love using various open source offerings like Spark, Flink, Presto, Airflow etc. With Dataproc & Composer our customers have been able to run various of these open source frameworks on GCP and leverage our scale, speed and security. Dataproc is a great service and delivers massive savings to customers moving from on-prem Hadoop environments. But customers want to focus on jobs and not clusters. 

That’s why we launched Dataproc Serverless Spark (GA) offering at Next 2021. This new service adheres to one of our key design principles we started with: make data simple.  

Just like with BigQuery, you can simply RUN QUERY. With Spark on Google Cloud, you simply RUN JOB.  ZDNet did a great piece on this.  I invite you to check it out!

Many of our customers are moving to Kubernetes and wanted to use that as the platform for Spark. Our upcoming Spark on GKE offering will give the ability to deploy spark workloads on existing Kubernetes clusters.  

But for me the most exciting capability we have is, the ability to run Spark directly on BigQuery Storage. BigQuery storage is highly optimized analytical storage. By running Spark directly on it, we again bring compute to data and avoid moving data to compute. 

BigSearch to power Log Analytics

We are bringing the power of Search to BigQuery. Customers already ingest massive amounts of log data into BigQuery and perform analytics on it. Our customers have been asking us for better support for native JSON and Search. At Next 21 we announced the upcoming availability of both these capabilities.

Fast cross column search will provide efficient indexing of structured, semi-structured and unstructured data. User friendly SQL functions let customers rapidly find data points without having to scan all the text in your table or even know which column the data resides in. 

This will be tightly integrated with native JSON, allowing customers to get BigQuery performance and storage optimizations on JSON as well as search on unstructured or constantly changing  data structures. 

Multi & Cross Cloud Analytics

Research on multi cloud adoption is unequivocal — 92% of businesses in 2021 report having a multi cloud strategy. We have always believed in providing customers choice to our customers and meeting them where they are. It was clear that all our customers wanted us to take our gems like BigQuery to other clouds as their data was distributed on different clouds. 

Additionally it was clear that customers wanted cross cloud analytics not multi-cloud solutions that can just run in different clouds. In short, see all their data with a single pane of glass, perform analysis on top of any data without worrying about where it is located, avoid egress costs and finally perform cross cloud analysis across datasets on different clouds.

With BigQuery Omni, we deliver on this vision, with a new way of analyzing data stored in multiple public clouds.  Unlike competitors, BigQuery Omni does not create silos across different clouds. BigQUery provides a single control plane that shows an analyst all data they have access to across all clouds. Analyst just writes the query and we send it to the right cloud across AWS, Azure or GCP to execute it locally. Hence no egress costs are incurred. 

We announced BQ Omni GA for both AWS and Azure at Google Next 21 and I’m really proud of the team for delivering on this vision.  Check out Vidya’s session and learn from Johnson and Johnson how they innovate in a multi-cloud world.

Geospatial Analytics with BigQuery and Earth Engine

We have partnered with our Google Geospatial team to deliver GIS functionality inside BigQuery over the years. At Next we announced that customers will be able to integrate Earth Engine with BigQuery, Google Cloud’s ML technologies, and Google Maps Platform. 

Think about all the scenarios and use-cases your team’s going to be able to enable sustainable sourcing, saving energy or understanding business risks.

We’re integrating the best of Google and Google Cloud together to – again – make it easier to work with data to create a sustainable future for our planet.  

BigQuery as a Data Exchange & Sharing Platform

BigQuery was built to be a sharing platform. Today we have 3000+ organizations sharing more than 250 petabytes of data across organizations. Google also brings more than 150 public datasets to be used across various use cases. In addition to this, we are also bringing some of the most unique datasets like Google Trends to BigQuery. This will enable organizations to understand in real-time trends and apply to their business problems.

I am super excited about the Analytics Hub Preview announcement. Analytics Hub will provide the ability for organizations to build private and public analytics exchanges. This will include data, insights, ML Models and visualizations. This is built on top of the industry leading security capabilities of BigQuery.

Breaking Data Silos

Data is distributed across various systems in the organization and making it easy to break the data silo and make all this data accessible to all is critical. I’m also particularly excited about the Migration Factory we’re building with Informatica and the work we are doing for data movement, intelligent data wrangling with players like Trifacta and FiveTran, with whom we share over 1,000 customers (and growing!).  Additionally we continue to deliver native Google service to help our customers. 

We acquired Cask in 2018 and launched our self service Data Integration service in Data Fusion. Now Fusion allows customers to create complex pipelines with just simple drag and drop. This year we focused on unlocking SAP data for our customers. We have launched various SAP connectors and accelerators to achieve this.

At GCP Next we also announced our BigQuery Migration service in preview. Many of our customers are migrating their legacy data warehouses and data lakes to BigQuery. BigQuery Migration Service provides end-to-end tools to simplify migrations for these customers. 

And today, to make migrations to BigQuery easier for even more customers, I am super excited to announce the acquisition of CompilerWorks. CompilerWorks’ Transpiler is designed from the ground up to facilitate SQL migration in the real world and will help our customers accelerate their migrations. It supports migrations from over 10 legacy enterprises data warehouses and we will be making it available as part of our BigQuery Migration service in the coming months.

Data Democratization with BigQuery

Over the past 4 years we have focused a lot on making it very  easy to derive actionable insights from data in BigQuery. Our priority has been to provide a strong ecosystem of partners that can provide you with great tools to achieve this but also deliver native Google capabilities. 

With our BI engine GA announcement which we introduced in 2019, previewed earlier this year and showcased with tools like Microsoft PowerBI and Tableau, is now available for all to play with.

BigQuery + Data Studio are like peanut butter and Jelly. They just work well together. We launched BI Engine first with Data Studio and scaled it to all the users. More than 40% of our BigQuery customers use Data Studio. Once we knew BI Engine works extremely well we now have made it an integral part of BigQuery API and launched it for all our internal and partner BI tools. 

We announced GA for BI Engine at Next 2021 but we were already GA with Data Studio for the past 2 years. We recently moved the Data Studio team back into Google Cloud making the partnership even stronger. If you have not used Data Studio, I encourage you to take a look and get started for free today here!! 

Connected Sheets for BigQuery is one of my favorite combinations. You can give every business user in your organization the ability to analyze billions of records using standard Google Sheets experience. I personally use it everyday to analyze all our product data. 

We acquired Looker in Feb 2020 with a vision of providing a semantic modeling layer to our customers with a governed BI solution. Looker is tightly integrated with BigQuery including BigQuery ML. Our latest partnership with Tableau where Tableau customers will soon be able to leverage Looker’s semantic model, enabling new levels of data governance while democratizing access to data. 

Finally, I have a dream that one day we will bring Google Assistant to your enterprise data. This is the vision of Data QnA. We are in early innings on this and we will continue to work hard to make this vision a reality. 

Intelligent Data Fabric to unify the platform

Another important trend that shaped our market is the Data Mesh.  Earlier this year, Starburst invited me to talk about this very topic. We have been working for years on this concept, and although we would love for all data to be neatly organized in one place, we know that our customers’ reality is that it is not (If you want to know more about this, read about my debate on this topic with Fivetran’s George Fraser, a16z’s Martin Casado and Databricks’ Ali Ghodsi).

Everything I’ve learned from customers over my years in this field is that they don’t just need a data catalog or a set of data quality and governance tools, they need an intelligent data fabric.  That is why we created Dataplex, whose general availability we announced at Next.

Dataplex enables customers to centrally manage, monitor, and govern data across data lakes, data warehouses, and data marts, while also ensuring data is securely accessible to a variety of analytics and data science tools.  It lets customers organize and manage data in a way that makes sense for their business, without data movement or duplication. It provides logical constructs – lakes, data zones, and assets – which enable customers to abstract away the underlying storage systems to build a foundation for setting policies around data access, security, lifecycle management, and so on.  Check out Prajakta Damle’s session and learn from Deutsche Bank how they are thinking about a unified data mesh across distributed data.

Closing Thoughts

Analysts have recognized our momentum and, as I look back at this year, I couldn’t thank our customers and partners enough for the support they provided my team and I across our large Data Analytics portfolio: in March, Google BigQuery was named a Leader in The Forrester Wave™: Cloud Data Warehouse, Q1 2021.  And in June, Dataflow was named a Leader in The Forrester Wave™: Streaming Analytics, Q2 2021 report.

If you want to get a taste for why customers choose us over other hyperscalers or cloud data warehousing, I suggest you watch the Data Journey series we’ve just launched, which documents the stories of organizations modernizing to the cloud with us.

The Google Cloud Data Analytics portfolio has become a leading force in the industry and I couldn’t be more excited to have been part of it.  I do miss you, my customers and partners, and I’m frankly bummed that we didn’t get to meet in person like we’ve done so many times before (see a photo of my last in-person talk before the pandemic), but this Google Next was extra special, so let’s dive into the product innovation and their themes.

I hope that I will get to see you in person next time we run Google Next!

Source : Data Analytics Read More

How geospatial insights can help meet business goals

How geospatial insights can help meet business goals

Organizations that collect geospatial data can use that information to understand their operations, help make better business decisions, and power innovation. Traditionally, organizations have required deep GIS expertise and tooling in order to deliver geospatial insights. In this post, we outline some ways that geospatial data can be used in various business applications. 

Assessing environmental risk 

Governments and businesses involved in insurance underwriting, property management, agriculture technology, and related areas are increasingly concerned with risks posed by environmental conditions. Historical models that predict natural disasters like pollution, flooding, and wildfires are becoming less accurate as real-world conditions change. Therefore, organizations are incorporating real-time and historical data into a geospatial analytics platform and using predictive modeling to more effectively plan for risk and to forecast weather.

Selecting sites and planning expansion

Businesses that have storefronts, such as retailers and restaurants, can find the best locations for their stores by using geospatial data like population density to simulate new locations and to predict financial outcomes. Telecom providers can use geospatial data in a similar way to determine the optimal locations for cell towers. A site selection solution can combine proprietary site metrics with publicly-available data like traffic patterns and geographic mobility to help organizations make better decisions about site selection, site rationalization, and expansion strategy.

Planning logistics and transport

For freight companies, courier services, ride-hailing services, and other companies that manage fleets, it’s critical to incorporate geospatial context into business decision-making. Fleet management operations include optimizing last-mile logistics, analyzing telematics data from vehicles for self-driving cars, managing precision railroading, and improving mobility planning. Managing all of these operations relies extensively on geospatial context. Organizations can create a digital twin of their supply chain that includes geospatial data to mitigate supply chain risk, design for sustainability, and minimize their carbon footprint. 

Understanding and improving soil health and yield

AgTech companies and other organizations that practice precision agriculture can use a scalable analytics platform to analyze millions of acres of land. These insights help organizations understand soil characteristics and help them analyze the interactions among variables that affect crop production. Companies can load topography data, climate data, soil biomass data, and other contextual data from public data sources. They can then combine this information with data about local conditions to make better planting and land-management decisions. Mapping this information using geospatial analytics not only lets organizations actively monitor crop health and manage crops, but it can help farmers determine the most suitable land for a given crop and to assess risk from weather conditions.

Managing sustainable development

Geospatial data can help organizations map economic, environmental, and social conditions to better understand the geographies in which they conduct business. By taking into account environmental and socio-economic phenomena like poverty, pollution, and vulnerable populations, organizations can determine focus areas for protecting and preserving the environment, such as reducing deforestation and soil erosion. Similarly, geospatial data can help organizations design data-driven health and safety interventions. Geospatial analytics can also help an organization meet its commitments to sustainability standards through sustainable and ethical sourcing. Using geospatial analytics, organizations can track, monitor, and optimize the end-to-end supply chain from the source of raw materials to the destination of the final product.

What’s next

Google Cloud provides a full suite of geospatial analytics and machine learning capabilities that can help you make more accurate and sustainable business decisions without the complexity and expense of managing traditional GIS infrastructure. Get started today by learning how you can use Google Cloud features to get insights from your geospatial data, see Geospatial analytics architecture.

Acknowledgements: We’d like to thank Chad Jennings, Lak Lakshmanan, Kannappan Sirchabesan, Mike Pope, and Michael Hao for their contributions to this blog post and the Geospatial Analytics architecture.

Related Article

Leveraging Google geospatial AI to prepare for climate resilience

While there is uncertainty about how much the climate will change in the future, we know it won’t look like the past. Extreme weather eve…

Read Article

Source : Data Analytics Read More

Google Cloud’s data ingestion principles

Google Cloud’s data ingestion principles

Businesses around the globe are realizing the benefits of replacing legacy data silos with cloud-based enterprise data warehouses, including easier collaboration across business units and access to insights within their data that were previously unseen. However, bringing data from numerous disparate data sources into a single data warehouse requires you to develop pipelines that ingest data from these various sources into your enterprise data warehouse. Historically, this has meant that data engineering teams across the organization procure and implement various tools to do so. But this adds significant complexity to managing and maintaining all these pipelines and makes it much harder to effectively scale these efforts across the organization. Developing enterprise-grade, cloud-native pipelines to bring data into your data warehouse can alleviate many of these challenges. But, if done incorrectly, these pipelines can present new challenges that your teams will have to spend their time and energy addressing. 

Developing cloud-based data ingestion pipelines that replicate data from various sources into your cloud data warehouse can be a massive undertaking that requires significant investment of staffing resources. Such a large project can seem overwhelming and it can be difficult to identify where to begin planning such a project. We have defined the following principles for data pipeline planning to begin the process. These principles are intended to help you answer key business questions about your effort and begin to build data pipelines that address your business and technical needs. Each section below details a principle of data pipelines and certain factors your teams should consider as they begin developing their pipelines.

Principle 1: Clarify your objectives

The first principle to consider for pipeline development is clarify your objectives. This can be broadly defined as taking a holistic approach to pipeline development that encompasses requirements from several perspectives: technical teams, regulatory or policy requirements, desired outcomes, business goals, key timelines, available teams and their skill sets, and downstream data users. Clarifying your objectives clearly identifies and defines requirements from each key stakeholder at the beginning of the process and continually checks development against these requirements to ensure the pipelines built will meet these requirements.

This is done by first clearly defining the desired end state for each project in a way that addresses a demonstrated business need of downstream data users. Remember that data pipelines are almost always the means to accomplish your end state, rather than the end state itself. An example of an effectively defined end-state is “enabling teams to gain a better understanding of our customers by providing access to our CRM data within our cloud data warehouse” rather than “move data from our CRM to our cloud data warehouse”. This may seem like a merely semantic difference, but framing the problem in terms of business needs helps your teams make technical decisions that will best meet these needs. 

After clearly defining the business problem you are trying to solve, you should facilitate requirement gathering from each stakeholder and use these requirements to guide the technical development and implementation of your ingestion pipelines. We recommend gathering stakeholders from each team, including downstream data users, prior to development to gather requirements for the technical implementation of the data pipeline. These will include critical timelines, uptime requirements, data update frequency, data transformation, DevOps needs, and security, policy, or regulatory requirements by which a data pipeline must meet.

Principle 2: Build your team

The second principle to consider for pipeline development is build your team. This means ensuring you have the right people with the right skills available in the right places to develop, deploy, and maintain your data pipelines. After you have gathered your pipeline requirements, you can begin to develop a summary architecture that will be used to build and deploy your data pipelines. This will help you identify the human talent you will need to successfully build, deploy, and manage these data pipelines and identify any potential shortfalls that would require additional support from either third-party partners or new team members.

Not only do you need to ensure you have the right people and skill sets available in aggregate, but these individuals need to be effectively structured to empower them to maximize their abilities. This means developing team structures that are optimized for each team’s responsibilities and their ability to support adjacent teams as needed.

This also means developing processes that prevent blockers to technical development whenever possible, such as ensuring that teams have all of the appropriate permissions they need to move data from the original source to your cloud data warehouse without violating the concept of least privilege. Developers need access to the original data source (depending on your requirements and architecture) in addition to the destination data warehouse. Examples of this are ensuring that developers have access to develop and/or connect to a Salesforce Connected App or read access to specific Search Ads 360 data fields.

Principle 3: Minimize time to value

The third principle to consider for pipeline development is minimize time to value. This means considering the long-term maintenance burden of a data pipeline prior to developing and deploying it in addition to being able to deploy a minimum viable pipeline as quickly as possible. Generally speaking, we recommend the following approach to building data pipelines to minimize their maintenance burden: Write as little code as possible. Functionally, this can be implemented by:

1. Leveraging interface-based data ingestion products whenever possible. These products minimize the amount of code that requires ongoing maintenance and empower users who aren’t software developers to build data pipelines. They can also reduce development time for data pipelines, allowing them to be deployed and updated more quickly. 

Products like Google Data Transfer Service and Fivetran allow for managed data ingestion pipelines by any user to centralize data from SaaS applications, databases, file systems, and other tooling. With little to no code required, these managed services enable you to connect your data warehouse to your sources quickly and easily.For workloads managed by ETL developers and data engineers, tools like Google Cloud’s Data Fusionprovide an easy-to-use visual interface for designing, managing and monitoring advanced pipelines with complex transformations.

2. Whenever interface-based products or data connectors are insufficient, use pre-existing code templates. Examples of this include templates available for Dataflow that allow users to define variables and run pipelines for common data ingestion use cases, and the Public Datasets pipeline architecture that our Datasets team uses for onboarding.

3. If neither of these options are sufficient, utilize managed services to deploy code for your pipelines. Managed services, such as Dataflow or Dataproc, eliminate the operational overhead of managing pipeline configuration by automatically scaling pipeline instances within predefined parameters.

Principle 4: Increase data trust and transparency

The fourth principle to consider for pipeline development is increase data trust and transparency. For the purposes of this document, we define this as the process of overseeing and managing data pipelines across all tools. Numerous data ingestion pipelines that each leverage different tools or are not developed under a coordinated management plan can result in “tech sprawl”, which significantly increases the management overhead of data ingestion pipelines as the quantity of data pipelines increases. This becomes especially cumbersome if you are subject to service-level agreements, or legal, regulatory, or policy requirements for overseeing data pipelines. Preventing tech sprawl is, by far, the best strategy for dealing with it by developing streamlined pipeline management processes that automate reporting. Although this can theoretically be achieved by building all of your data pipelines using a single cloud-based product, we do not recommend doing so because it prevents you from taking advantage of features and cost optimizations that come with choosing the best product for your use case. 

A monitoring service such as Google Cloud Monitoring Service or Splunk that automates metrics, events, and metadata collection from various products, including those hosted in on-premise and hybrid computing environments, can help you centralize reporting and monitoring of your data pipelines. A metadata management tool such as Google Cloud’s Data Catalog or Informatica’s Enterprise Data Catalog can help you better communicate the nuances of your data so users better understand which data resources are best fit for a given use case. This significantly reduces your pipeline’s governance burden by eliminating manual reporting processes that often result in inaccuracies or lagging updates.

Principle 5: Manage costs

The fifth principle to consider for pipeline development is manage costs. This encompasses both the cost of cloud resources and the staffing costs necessary to design, develop, deploy, and maintain your cloud resources. We believe that your goal should not necessarily be to minimize cost, but rather maximizing the value of your investment. This means maximizing the impact of every dollar spent by minimizing waste in cloud resource utilization and human time. There are several factors to consider when it comes to managing costs:

Use the right tool for the job – Different data ingestion pipelines will have different requirements for latency, uptime, transformations, etc. Similarly, different data pipeline tools have different strengths and weaknesses. Choosing the right tool for each data pipeline can help your pipelines operate significantly more efficiently. This can reduce your overall cost, free up staffing time to focus on the most impactful projects, and make your pipelines much more efficient.

Standardize resource labeling –  Implement and utilize a consistent labeling schema across all tools and platforms to have the most comprehensive view of your organization’s spending. One example is requiring all resources to be labeled by the cost center or team at time of creation. Consistent labeling allows you to monitor your spend across different teams and calculate the overall value of your cloud spending.

Implement cost controls – If available, leverage cost controls to prevent errors that result in unexpectedly large bills. 

Capture cloud spend – Capture your spend on all cloud resource utilization for internal analysis using a cloud data warehouse and a data visualization tool. Without it, you won’t understand the context of changes in cloud spend and how they correlate with changes in business.

Make cost management everyone’s job – Managing costs should be part of the responsibilities of everyone who can create or utilize cloud resources. To do this well, we recommend making cloud spend reporting more transparent internally and/or implementing chargebacks to internal cost centers based on utilization.

Long-term, the increased granularity in cost reporting available within Google Cloud can help you better measure your key performance indicators. You can shift from cost-based reporting (i.e. – “We spent $X on BigQuery storage last month”) to value-based reporting (i.e. – “It costs $X to serve customers who bring in $Y revenue”). 

To learn more about managing costs, check out Google Cloud’s “Understanding the principles of cost optimization” white paper.

Principle 6: Leverage continually improving services

The sixth principle is leverage continually improving services. Cloud services are consistently improving their performance and stability, even if some of these improvements are not obvious to users. These improvements can help your pipelines run faster, cheaper, and more consistently over time. You can take advantage of the benefits of these improvements by:

Automating both your pipelines and pipeline management: Not only should data pipelines be automated, but almost all aspects of managing your pipelines can also be automated. This includes pipeline/data lineage tracking, monitoring, cost management, scheduling, access management and more. This helps reduce long-term operational costs of each data pipeline that can significantly alter your value proposition and prevent any manual configurations from negating the benefits of later product improvements.

Minimizing pipeline complexity whenever possible: While ingestion pipelines are relatively easy to develop using UI-based or managed services, they also require continued maintenance as long as they are in use. The most easily maintained data ingestion pipelines are typically the ones that minimize complexity and leverage automatic optimization capabilities. Any transformation in a data ingestion pipeline is a manual optimization of the pipeline that may struggle to adapt or scale as the underlying services improve. You can minimize the need for such transformations by building ELT (extract, load, transform) pipelines rather than ETL (extract, transform, load) pipelines. This pushes transformations down to the data warehouse that is use a specifically optimized query engine to transform your data rather than manually configured pipelines.

Next steps

If you’re looking for more information about developing your cloud-based data platform, check out our Build a modern, unified analytics data platform whitepaper. You can also visit our data integration site to learn more and find ways to get started with your data integration journey.

Once you’re ready to begin building your data ingestion pipelines, learn more about how Cloud Data Fusion and Fivetran can help you make sure your pipelines address these principles.

Source : Data Analytics Read More