Archives September 2021

BigQuery Admin reference guide: Recap

BigQuery Admin reference guide: Recap

Over the past few weeks, we have been publishing videos and blogs that walk through the fundamentals of architecting and administering your BigQuery data warehouse. Throughout this series, we have focused on teaching foundational concepts and applying best practices observed directly from customers. Below, you can find links to each week’s content:

Resource Hierarchy [blog]: Understand how BigQuery fits into the Google Cloud resource hierarchy, and strategies for effectively designing your organization’s BigQuery resource model.

Tables & Routines[blog]:What are the different types of tables in BigQuery? When should you use a federated connection to access external data, vs bringing data directly into native storage? How do routines help provide easy-to-use and consistent analytics? Find out here!

Jobs & Reservation Model[blog]: Learn how BigQuery manages jobs, or execution resources, and how processing jobs plays into the purchase of dedicated slots and the reservation model.

Storage & Optimizations[blog]: Curious to understand how BigQuery stores data in ways that optimize query performance? Here, we go under-the-hood to learn about data storage and how you can further optimize how BigQuery stores your data.

Query Processing [blog]:Ever wonder what happens when you click “run” on a new BigQuery query? This week, we talked about how BigQuery divides and conquers query execution to power super fast analytics on huge datasets.

Query Optimization[blog]: Learn about different techniques to optimize queries. Plus, dig into query execution for more complex workflows to better understand tactics for saving time and money analyzing your data. 

Data Governance [blog]:Understand how to ensure that data is secure, private, accessible, and usable  inside of BigQuery. Also explore integrations with other GCP tools to build end-to-end data governance pipelines. 

BigQuery API Landscape [blog]:Take a tour of the BigQuery APIs and learn how they can be used to automate meaningful data-fueled workflows.

Monitoring [blog]:Walk through the different monitoring data sources and platforms that can be used to continuously ensure your deployment is cost effective, performant and secure.

We hope that these links can act as resources to help onboard new team members onto BigQuery or a reference for rethinking new patterns or optimizations – so make sure to bookmark this page! If you have any feedback or ideas for future videos, blogs or data focused series, don’t hesitate to reach out to me on LinkedIn or Twitter.

Related Article

BigQuery Admin reference guide: Monitoring

This blog aims to simplify monitoring and best practices related to BigQuery, with a focus on slots and automation.

Read Article

Source : Data Analytics Read More

Google Cloud improves Healthcare Interoperability on FHIR

Google Cloud improves Healthcare Interoperability on FHIR

The Importance of Interoperability

In 2020 hospital systems were scrambling to prepare for COVID-19. Not just the clinicians preparing for a possible influx of patients, but also the infrastructure & analytics teams trying to navigate a maze of Electronic Health Records (EHR) systems. By default these EHRs are not interoperable, or able to speak to one another, so answering a relatively simple question “how many COVID-19 patients are in all of my hospitals?” can require many separate investigations. 

Typically, the more complex a dataset is, the more difficult it is to build interoperable systems around it. Clinical data is extremely complex (a patient has many diagnoses, procedures, visits, providers, prescriptions, etc.), and EHR vendors built and managed their own proprietary data models to handle those data challenges. This has made it much more difficult for hospitals to track a patient’s performance when they switch hospitals (even within the same hospital system) and especially difficult for multiple hospitals systems to coordinate on care for nationwide epidemics (e.g. COVID-19, opioid abuse), which makes care less effective for patients & more expensive for hospitals. 

A Big Leap Forward in Interoperability

Building an interoperable system requires: 

(1) A common data schema

(2) A mechanism for hospitals to bring their messy real-world data into that common data schema

(3) A mechanism for asking questions against that common data schema

In 2011 a common FHIR (Fast Healthcare Interoperability Resources) Data Model & API Standard provided an answer to (1): a single data schema for the industry to speak the same data language. In the past 18 months, Google Cloud has deployed several technologies to unlock the power of FHIR and solve for (2) and (3): 

Google Cloud’s Healthcare Data Engine (HDE) produces FHIR records from streaming clinical data (either HL7v2 messages out of EHR systems or legacy formats from EDWs). This technology then enables data use for other applications & analytics in Google BigQuery (BQ)

Google Cloud’s Looker enables anyone in a healthcare organization to ask any question against the complex FHIR schema in Google BigQuery

Now a hospital system can quickly ask & answer a question against records from several EHR systems at once.

This dashboard tracks a hospital system’s COVID-19 cases & volume across its hospitals.

Applications Seen So Far

In less than 18 months, GCP has seen dozens of applications for HDE, BigQuery, and Looker working together to improve clinical outcomes. A few applications that have been particularly successful so far have answered questions like: 

How many readmissions will a hospital expect in 30 days? 

How long will each inpatient patient stay in a hospital?

How can a hospital better track misuse & operational challenges in prescribing opioid drugs to my patients?

How can a hospital quickly identify anomalies in patients’ vital signs across my hospital system?

How can a hospital identify & minimize hospital-associated infections (e.g. CLABSI) in my hospital?

How can a hospital prepare for COVID-19 cases across a hospital system? And leverage what-if planning to prepare for the worst?

These use cases represent just the tip of the iceberg of possibilities for improving day-to-day operations for clinicians & hospitals.

Solving Major Challenges in Interoperability

Latency: Hospitals often rely on stale weekly reports for analytics; receiving analytics in near real-time enables hospitals to identify problems and make changes much more quickly. COVID-19 in particular highlighted the need for faster turnaround on analytics. GCP’s Healthcare Data Engine handles streaming clinical data in the form of HL7 messages. As soon as messages arrive, they are transformed into FHIR and sent over to the BigQuery database to be queried. There is minimal latency, and users are querying near real-time data.

Scale: The scale and scope of hospital data is rapidly increasing as hospitals track more clinical events and as hospitals consolidate into larger systems. Hospitals are adopting cloud-based systems that autonomously scale to handle the intensive computation necessary to take in millions of clinical records with growing hospital system datasets. GCP’s serverless, managed cloud is meeting these needs for many hospital systems today.

Manage Multiple Clinical Definitions: Today hospitals struggle to manage definitions of complex clinical KPIs. For example, hospitals had many different definitions for a positive COVID-19 result (based on a frequently changing set of lab results and symptoms), which creates inconsistencies in analytics. Additionally, those definitions are often buried in scripts that are hard to adjust and change. HDE has developed capabilities that consistently transform HL7 messages into the FHIR store in a scalable fashion. Looker then provides a single source of truth in an object-oriented, version-controlled semantic layer to define clinical KPIs and quickly update them.  

Represent FHIR Relationally: FHIR was originally intended for XML storage to maximize schema flexibility. However, this format is usually very difficult for analytical queries, which perform better with relational datasets. In particular, FHIR has rows of data buried (or “nested”) within a single record (e.g. a single patient record has many key-value pairs of diagnoses) that make FHIR difficult to ask questions against. BigQuery is an analytical database that combines the analytical power of OLAP databases with the flexibility of a No-SQL data schema by natively storing FHIR data in this “nested” structure and querying against it. 

Query Quickly against FHIR: Writing unnested queries to a schema as complex as FHIR can be challenging. GCP’s Looker solution writes “nested” queries natively to BigQuery, making it much simpler to ask & answer new questions. This also prevents the “cube / extract” problem so common in healthcare, where hospitals are forced to build, manage, and maintain hundreds of simplified data cubes to answer their questions.

Predict Clinical Outcomes: Predictive modelling with AI/ML workflows has matured significantly. Hospitals increasingly rely on AI/ML to guide patients & providers towards better outcomes. For example, predicting patient, staffing, and ventilator volumes 30 days in advance across a hospital system can minimize disruptions to care. Leveraging FHIR on GCP enables GCP’s full suite of managed AI/ML tools – in particular BQML (BigQuery Machine Learning) and AutoML.

Ensure 24/7 Data Availability: COVID-19 exposed the vulnerabilities of relying on staffed on-premise data centers; GCP’s cloud infrastructure ensures availability and security of all clinical data. 

Protect Patient Data: Interoperability blends the need for private patient data to stay private while allowing data to be shared across hospitals. Researchers in particular often require granular security rules to access clinical data. Today hospitals often use an extract-based approach that requires many copies of the data outside of the database, a potential security flaw. GCP’s approach ensures that hospitals can query the data where it resides – in a secure data warehouse. Additionally, every component of GCP’s FHIR solution (HDE, BQ, Looker) can be configured to be HIPAA-compliant and includes row-level, column-level, and field-level security that can be set by users to ensure cell-level control over PHI data. GCP’s Cloud Loss Prevention API also anonymizes data automatically.

Speed to Insights: The complexity of data can lead to long windows to build analytics pipelines, leading to delays in healthcare improvements. GCP’s FHIR solution is relatively low-effort to implement. HDE can be set up against streaming HL7 messages in a few days and weeks, not months and years. Looker has a pre-built FHIR Block (coming to the Looker Blocks Directory and Marketplace soon) that can be installed & configured for a hospital’s particular data needs.

Share Insights Broadly: Interoperability requires not just being able to query across multiple systems, but also to share those insights across multiple platforms. GCP’s FHIR solution allows hospital systems to analyze governed results on FHIR, then send them anywhere: to dashboards in Looker, other BI tools, embedded applications, mobile apps, etc. For example, the National Response Portal represents the promise of hospitals and other organizations sharing aggregated healthcare data for nationwide insights around COVID-19.

For a technical review of GCP’s Healthcare Data Engine against Azure’s & AWS’ solutions, see here and here.

The New Frontier

This new healthcare data stack at Google Cloud represents a significant step forward towards interoperability in healthcare. When hospitals can communicate more easily with each other and when complex analytics are easier to conduct, everyone wins. Patients have better healthcare outcomes, and hospitals can provide care more efficiently. 

Google Cloud is committed to continue partnering with the largest hospital systems in the country to solve the most challenging problems in healthcare. Patients’ lives depend on it.

Related Article

Registration is open for Google Cloud Next: October 12–14

Register now for Google Cloud Next on October 12–14, 2021

Read Article

Source : Data Analytics Read More

Lower TCO for managing data pipelines by 80% with Cloud Data Fusion

Lower TCO for managing data pipelines by 80% with Cloud Data Fusion

In today’s data-driven environment, organizations need to use various different data sources available in order to extract timely and actionable insights.  Organizations are better off making data integration easier to get faster insights from data rather than spending time and effort in coding, testing complex data pipelines .  

Recently, Google Cloud sponsored Enterprise Strategy Group (ESG) on two whitepapers, conducting deep dives into the need for modern data integration, and how Cloud Data Fusion can address these challenges including the economic value of using Cloud Data Fusion as compared to other alternatives available.

Challenges in Data Integration

Data integration has notoriously been the greatest challenge data-driven organizations face as they work to better leverage data. On top of migrating certain, if not all, workloads to the cloud, areas like lack of metadata, combining distributed data sets, combining different data types, and handling the rate at which source data changes are directly leading to organizations prioritizing data integration.  In fact, this is the reason that improving data integration is where organizations expect to make the most significant investments in the next 12-18 months1. Organizations recognize that by simplifying and improving their data integration processes, they can enhance operational efficiency across data pipelines while ensuring they are on a path to data-driven success.

Cloud Strategy and Data Integration 

Based on the ESG report, the cloud strategy impacts the way in which organizations implement and utilize data integration today. Organizations can choose from, single cloud, multi-cloud or hybrid cloud strategy and in doing so, choosing the right data integration option can give organizations freedom and flexibility. Irrespective of the cloud strategy, organizations are embracing a centralized approach to data management to not only reduce costs but also to ensure greater efficiency in the creation and management of data pipelines. By standardizing on a centralized approach, data lifecycle management is streamlined through data unification. Further, with improved data access and availability, data and insight reusability are achieved.

Cross-environment integration and collaboration

Organizations are increasingly in search of services and platforms that minimize lock-in while promoting cross-environment integration and collaboration. As developers dedicate more time and effort into building modern applications heavily rooted in data, knowing the technology is underlined by open-source technology provides peace of mind knowing the application and underlying code can be run anywhere the open-source technology is supported. This desire for open-source technology extends to data pipelines too, where data teams have dedicated hours to optimally integrate a growing set of technologies and perfect ETL scripts. As new technologies, use cases, or business goals emerge, enabling environment flexibility ensures organizations can embrace data in the best way possible.

Cost savings with Cloud Data Fusion

ESG conducted interviews with customers to validate the savings and benefits that they have seen in practice and used these as the assumptions to compare Cloud Data Fusion. Aviv, a senior validation analyst with ESG has taken two use cases, building data warehouse and building data lake and compared on-prem, build yourself with Cloud Data Fusion. The research shows that customers can realize cost savings up to 88% to operate a hybrid cloud data lake and up to 80% to deploy, manage, and maintain data pipelines for cloud-based enterprise data warehouses in BigQuery. Here is a sneak peek into ROI calculations for building Data Warehouse in BigQuery using Cloud Data Fusion vs other alternatives.

The full whitepapers contain even more insight, as well as a thorough analysis of the data integration tools’ impact on businesses and recommended steps for unlocking its full potential. You can download the full reports below:

Accelerating Digital Transformation with Modern Data Integration

The Economic Benefits of Data Fusion versus other Alternatives 

Additionally, try a quickstart, or reach out to us for your cloud data integration needs.

1. ESG Master Survey Results, 2021 Technology Spending Intentions Survey, December 2020

Source : Data Analytics Read More

Optimizing your BigQuery incremental data ingestion pipelines

Optimizing your BigQuery incremental data ingestion pipelines

When you build a data warehouse, the important question is how to ingest data from the source system to the data warehouse. If the table is small you can fully reload a table on a regular basis, however, if the table is large a common technique is to perform incremental table updates. This post demonstrates how you can enhance incremental pipeline performance when you ingest data into BigQuery.

Setting up a standard incremental data ingestion pipeline

We will use the below example to illustrate a common ingestion pipeline that incrementally updates a data warehouse table. Let’s say that you ingest data into BigQuery from a large and frequently updated table in the source system, and you have Staging and Reporting areas (datasets) in BigQuery.

The Reporting area in BigQuery stores the most recent, full data that has been ingested from the source system tables. Usually you create the base table as a full snapshot of the source system table. In our running example, we use BigQuery public data as the source system and create reporting.base_table as shown below. In our example each row is identified by a unique key which consists of two columns: block_hash and log_index.

In data warehouses it is common to partition a large base table by a datetime column that has a business meaning. For example, it may be a transaction timestamp, or datetime when some business event happened, etc. The idea is that data analysts who use the data warehouse usually need to analyze only some range of dates and rarely need the full data. In our example, we partition the base table by block_timestamp which comes from the source system.

After ingesting the initial snapshot you need to capture changes that happen in the source system table and update the reporting base table accordingly. This is when the Staging area comes into the picture. The staging table will contain captured data changes that you will merge into the base table. Let’s say that in our source system on a regular basis we have a set of new rows and also some updated records. In our example we mock the staging data as follows: first, we create new data, than we mock the updated records:

Next, the pipeline merges the staging data into the base table. It joins two tables by unique key and than updates the changed value or inserts a new row

It is often the case that the staging table contains keys from various partitions but the number of those partitions are relatively small. It holds, for instance, because in the source system the recently added data may get changed due to some initial errors or ongoing processes but older records are rarely updated. However, when the above MERGE gets executed, BigQuery scans all partitions in the base table and processes 161 GB of data. You might add additional join condition on block_timestamp:

But BigQuery would still scan all partitions in the base table because condition T.block_timestamp = S.block_timestamp is a dynamic predicate and BigQuery doesn’t automatically push such predicates down from one table to another in MERGE.

Can you improve the MERGE efficiency by making it scan less data? The answer is Yes. 

As described in the MERGE documentation, pruning conditions may be located in a subquery filter, a merge_condition filter, or a search_condition filter. In this post we show how you can leverage the first two. The main idea is to turn a dynamic predicate into a static predicate.

Steps to enhance your ingestion pipeline

The initial step is to compute the range of partitions that will be updated during the MERGE and store it in a variable. As was mentioned above, in data ingestion pipelines, staging tables are usually small so the cost of the computation is relatively low.

Based on your existing ETL/ELT pipeline, you can add the above code as-is to your pipeline or you can compute date_min, data_max as part of some already existing transformation step. Alternatively, date_min, data_max can be computed on the Source System side while capturing the next ingestion data batch.

After computing date_min, date_max you pass those values to the MERGE statement as static predicates. There are several ways to enhance the MERGE and prune partitions in the base table based on precomputed date_min, data_max. 

If your initial MERGE statement uses a subquery, you can incorporate a new filter into it:

Note that you add the static filter to the staging table and keep T.block_timestamp = S.block_timestamp to convey to BigQuery that it can push that filter to the base table. This MERGE processes 41 GB of data in contrast to the initial 161 GB. You can see in the query plan that BigQuery pushes the partition filter from the staging table to the base table:

This type of optimization, when a pruning condition is pushed from a subquery to a large partitioned or clustered table, is not unique for MERGE. It also works for other types of queries. For instance:

And you can check the query plan to verify that BigQuery pushed down the partition filter from one table to another.

Moreover, for SELECT statements, BigQuery can automatically infer a filter predicate on a join column and push it down from one table to another if your query meets the following criteria:

The target table must be clustered or partitioned. The result size of the other table, i.e. after applying all filters, must qualify for broadcast join. Namly, the result set must be relatively small, less than ~100MB.

In our running example, reporting.base_table is partitioned by block_timestamp. If you define a selective filter on staging.load_delta and join two tables, you can see an inferred filter on the join key pushed to the target table

There is no requirement to join tables by partitioning or clustering key to kick off this type of optimization. However, in this case the pruning effect on the target table would be less significant.

But let us get back to the pipeline optimizations. Another way to enhance MERGE is to modify the merge_condition filter by adding static predicate on the base table:

To summarize, here are the steps that you can perform to enhance incremental ingestion pipelines in BigQuery. First you compute the range of updated partitions based on the small staging table. Next, you tweak the MERGE statement a bit to let BigQuery know to prune data in the base table.

All the enhanced MERGE statements scanned 41 GB of data, and setting up the src_range variable took 115 MB.  Compare it with the initial 161 GB scan. Moreover, given that computing src_range may be incorporated into some existing transformation in your ETL/ELT, it results in a good performance improvement which you can leverage in your pipelines. 

In this post we described how to enhance data ingestion pipelines by turning dynamic filter predicates into static predicates and letting BiQuery prune data for us. You can find more tips on BigQuery DML tuning here.

Special thanks to Daniel De Leo, who helped with examples and provided valuable feedback on this content.

Related Article

BigQuery explained: How to run data manipulation statements to add, modify and delete data stored in BigQuery

How do you delete all rows from a table in BigQuery? In this blog post, you’ll learn that and more, as we show you how you how to run dat…

Read Article

Source : Data Analytics Read More

Ad agencies choose BigQuery to drive campaign performance

Ad agencies choose BigQuery to drive campaign performance

Advertising agencies are faced with the challenge of providing the precision data that marketers require to make better decisions at a time when customers’ digital footprints are rapidly changing. They need to transform customer information and real-time data into actionable insights to inform clients what to execute to ensure the highest campaign performance.

In this post, we’ll explore how two of our advertising agency customers are turning to Google BigQuery to innovate, succeed, and meet the next generation of digital advertising head on. 

Net Conversion eliminated legacy toil to reach new heights

Paid marketing and comprehensive analytics agency Net Conversion has made a name for itself with its relentless attitude and data-driven mindset. But like many agencies, Net Conversion felt limited by traditional data management and reporting practices. 

A few years ago, Net Conversion was still using legacy data servers to mine and process data across the organization, and analysts relied heavily on Microsoft Excel spreadsheets to generate reports. The process was lengthy, fragmented, and slow—especially when spreadsheets exceeded the million-row limit.

To transform, Net Conversion built Conversionomics, a serverless platform that leverages BigQuery, Google Cloud’s enterprise data warehouse, to centralize all of its data and handle all of its data transformation and ETL processes. BigQuery was selected for its serverless architecture, high scalability, and integration with tools that analysts were already using daily, such as Google Ads, Google Analytics, and Data Hub. 

After moving to BigQuery, Net Conversion discovered surprising benefits that streamlined reporting processes beyond initial expectations. For instance, many analysts had started using Google Sheets for reports, and BigQuery’s native integration with Connected Sheets gave them the power to analyze billions of rows of data and generate visualizations right where they were already working.

If you’re still sending Excel files that are larger than 1MB, you should explore Google Cloud. Kenneth Eisinger
Manager of Paid Media Analytics at Net Conversion

Since modernizing their data analytics stack, Net Conversion has saved countless hours of time that can now be spent on taking insights to the next level. Plus, BigQuery’s advanced data analytics capabilities and robust integrations have opened up new roads to offer more dynamic insights that help clients better understand their audience.   

For instance, Net Conversion recently helped a large grocery retailer launch a more targeted campaign that significantly increased downloads of their mobile application. The agency was able to better understand and predict their customers’ needs by analyzing buyer behavior across the website, mobile application, and their purchase history. Net Conversion analyzed website data in real-time with BigQuery, ran analytics on their mobile app data through the Firebase’s integration with BigQuery, and enriched these insights with sales information from the grocery retailer’s CRM to generate propensity behavior models that  accurately predicted which customers would most likely install their mobile app.

WITHIN helped companies weather the COVID storm

WITHIN is a performance branding company, focused on helping brands maximize growth by fusing marketing and business goals together in a single funnel. During the COVID-19 health crisis, WITHIN became an innovator in the ad agency world by sharing real-time trends and insights with customers through its Marketing Pulse Dashboard. This dashboard was part of the company’s path to adopting BigQuery for data analytics transformation. 

Prior to using BigQuery, WITHIN used a PostgreSQL database to house its data and manual reporting. Not only was the team responsible for managing and maintaining the server, which took focus away from the data analytics, but query latency issues often slowed them down. 

BigQuery’s serverless architecture, blazing-fast compute, and rich ecosystem of integrations with other Google Cloud and partner solutions made it possible to rapidly query, automate reporting, and completely get rid of CSV files. 

Using BigQuery, WITHIN is able to run Customer Lifetime Value (LTV) analytics and quickly share the insights with their clients in a collaborative Google Sheet. In order to improve the effectiveness of their campaigns across their marketing channels, WITHIN further segments the data into high and low LTV cohorts and shares the predictive insights with their clients for in-platform optimizations.

By distilling these types of LTV insights from BigQuery, WITHIN has been able to use those to empower their campaigns on Google Ads with a few notable success stories.

WITHIN worked with a pet food company to analyze historical transactional data to model predicted LTV of new customers. They found significant differences between product category and autoship vs single order customers, and they implemented LTV-based optimization. As a result, they saw a 400% increase in average customer LTV. 
WITHIN helped a coffee brand increase their customer base by 560%, with the projected 12-month LTV of newly acquired customers jumping a staggering 1280%.

Through integration with Google AI Platform Notebooks, BigQuery also advanced WITHIN’s ability to use machine learning (ML) models. Today, the team can build and deploy models to predict dedicated campaign impact across channels without moving the data.  The integration of clients’ LTV data through Google Ads has also impacted how WITHIN structures their clients’ accounts and how they make performance optimization decisions.

Now, WITHIN can capitalize on the entire data lifecycle: ingesting data from multiple sources into BigQuery, running data analytics, and empowering people with data by automatically visualizing data right in Google Data Studio or Google Sheets.

A year ago, we delivered client reporting once a week. Now, it’s daily. Customers can view real-time campaign performance in Data Studio — all they have to do is refresh. Evan Vaughan
Head of Data Science at WITHIN

Having a consistent nomenclature and being able to stitch together a unified code name has allowed WITHIN to scale their analytics. Today, WITHIN is able to create an internal Media Mix Modeling (MMM) tool with the help of Google Cloud that they’re trialing with their clients.

The overall unseen benefit of BigQuery was that it put WITHIN in a position to remain nimble and spot trends before other agencies when COVID-19 hit. This aggregated view of data allowed WITHIN to provide unique insights to serve their customers better and advise them on rapidly evolving conditions.

Ready to modernize your data analytics? Learn more about how Google BigQuery unlocks the insights hidden in your data.

Related Article

Query BIG with BigQuery: A cheat sheet

Organizations rely on data warehouses to aggregate data from disparate sources, process it, and make it available for data analysis in s…

Read Article

Source : Data Analytics Read More

Wrapping up the summer: A host of new stories and announcements from Data Analytics

Wrapping up the summer: A host of new stories and announcements from Data Analytics

August is the time to sit back, relax, and enjoy the last of the summer. Or, for those in the southern hemisphere, August is the month you start looking at your swimsuits and sunglasses with interest as the weather warms. But regardless of where you live, August also seems to be when Google produces a lot of interesting Data Analytics reading.

In this monthly recap, I’ll divide last month’s most interesting articles into three groups: New Features and Announcements, Customer Stories, and  How-Tos. You can read through in order or skip to the section that’s most interesting to you.

Features and announcements

Datasets and Demo Queries – Recursion is a powerful topic, but it’s also a marvelous metaphor.  During August, we launched our most self-referential datasetyet; Google Cloud Release Notes are now in BigQuery. Find the product and feature announcements you need and do it fast using the new Google Cloud Release Notes Dataset. Additionally, we also launched the Top 25 topics in Google Trends (Looker Dashboard).

Save Messages, money and time with Pub/Sub topic retention. When you enable topic retention, all messages sent to the topic within the chosen retention window are accessible to all the topic’s subscriptions —without increasing your storage costs when you add subscriptions. Additionally, messages will be retained and available for replay even if there are no subscriptions attached to the topic at the time the messages are published, allowing subscribers to see the entire history of messages sent to the topic.

Extend your Dataflow templates with UDFs. Google provides a set of Dataflow templates that customers commonly use for frequent data tasks but also as reference data pipelines that developers can extend. But what if you want to customize a Dataflow template without modifying or maintaining the Dataflow template code itself? With JavaScript user-defined functions (UDFs), customers can now extend certain Dataflow templates with custom logic to transform records on the fly. This is especially helpful for users who want to customize a pipeline’s output format without having to re-compile or maintain the template code itself.

The diagram below shows the process flow for UDF enabled Dataflow Templates

Customer stories

Renault uses BigQuery to improve its Industrial Data platform
Last month, Renault described their journey and the impact of establishing an industrial IoT analytics system using Dataflow, Pub/Sub, and BigQuery for traceability of tools and products, as well as measure operational efficiency.  By consolidating multiple data silos into BigQuery the IT Infrastructure team was able to reduce storage costs by 50% even while processing several times more data than on their legacy system.

The chart below shows the multifold growth in data that Renault processed each month (blue bars) along with the corresponding drop in cost (red line) between the previous system (shaded area) and the Google solution.

Constellation Brands chose Google Cloud to power Direct to Consumer (DTC) shift

Ryan Mason, Director and Head of Direct to Consumer Strategy from Constellation Brands authored a piece on the business value of DTC channels as well as the method and impact of how he implemented his pipelines. This story explained how to gather multiple streams from the Google Marketing platform (Analytics 360, Tag Manager 360) and land them in BigQuery.

A key differentiator for us is that all Google Marketing Platform data is natively accessible for analysis within BigQuery.

From there, Constellation Brands can calculate key performance indicators (KPIs), such as customer acquisition cost (CAC), Customer Lifetime Value (CLV), and Net Promoter Score (NPS), and broadcast them across the company using Looker dashboards. In this way, the entire organization can track the health of the business through common access to the same KPI’s.

The operational impact of Looker [dashboards] is also substantial: our team estimates that the number of hours needed to reach critical business decisions has been reduced by nearly 60%.

How-Tos

Our DevRel Rockstar Leigha Jarett has published four very useful articles in her continuing series on the BigQuery Administration Reference Guide. This month she covered: Monitoring, API Landscape, Data Governance, and Query Optimization.

I highly recommend reading the article on query optimization. It’s packed with good tips, from the most commonly used — partitioning and clustering to reduce the amount of data that the query has to scan – to some lesser-known tips like proper ordering of expressions.

This article on workload management in BigQuery has some very useful tips and explains the key constructs of Commitments, Reservations, and Assignments.

If streaming is your game then this post from Zeeshan Kahn on handling duplicate data in streaming pipelines using DF and PS will come in handy.

Zooming up a few thousand feet, Googlers Firat Tekiner and Susan Pierce offer some high level insights as they discuss theconvergence of data lakes and data warehouses. After all, who wants to manage two sets of infrastructure?   Aunified data platformis the way to go.

And that’s how we do a relaxing summer month here at Google Cloud! Stay tuned for more announcements, how-to blogs, and customer stories as we ramp up for Google Cloud Next coming in October.

Related Article

What are the newest datasets in Google Cloud?

Want to know about the latest datasets from Google Cloud? Find information here in one handy location. Check back regularly as we update …

Read Article

Source : Data Analytics Read More

SQL Server SSRS, SSIS packages with Google Cloud BigQuery

SQL Server SSRS, SSIS packages with Google Cloud BigQuery

After migrating a Data Warehouse to Google Cloud BigQuery, ETL and Business Intelligence developers are often tasked with upgrading and enhancing data pipelines, reports and dashboards. Data teams who are familiar with SQL Server Integration Services (SSIS) and SQL Server Reporting Services (SSRS) are able to continue to use these tools with BigQuery, allowing them to modernize ETL pipelines and BI platforms after an initial data migration is complete. The following blog details patterns and examples on how Data teams can use SSIS and SSRS with BigQuery. 

Using SQL Server Integration Services (SSIS) with BigQuery

SQL Server Integration Services (SSIS) is used to move data between source and target databases. A common simplified pattern is featured below, where data is extracted from an OLTP system (source) and written to a Data Warehouse (target). Note that there are two intermediate steps, Data Transformations and Data Mappings. These steps contain specific business rules, logic and C# code that at this time makes sense to keep in SSIS rather than to move into BigQuery.

SSIS Data Flow

In the modified SSIS Data Flow below, a Multicast transformation is added along with a Flat File Output destination for the csv file.  Note that while data continues to load into the existing EDW database, it is also written to a file system as a Flat File (csv format) which is subsequently copied to a GCP bucket and loaded into BigQuery. This pattern supports enhancements to the current production EDW in parallel to BigQuery development workstreams.

SSIS Data Flow with BigQuery destination added

Once generated, the csv file is then copied into a Google Cloud Storage bucket (GCS) via a PowerShell script, which is run via an Execute Process task. A screenshot of a sample SSIS Control Flow follows. 

SSIS Control Flow

Output: SSIS Execute Process task

Configuration: SSIS Execute Process Task

Sample Syntax from the above screenshot

Once the csv files are copied into a GCS Bucket, external tables are created in BigQuery to reference the files. In this scenario, an external table functions as a staging table and can be queried directly or used as a source to merge data into internal tables optimized for reporting and user access. A sample external table schema follows.

To support data QA and validation, the GCP professional services Data Validation Tool (DVT) can be used to automate testing and data validation, for example, comparing table row counts and column data distributions between the EDW and BigQuery databases.

The Data Validation Tool (DVT) is an open sourced Python CLI tool based on the Ibis framework that compares heterogeneous data source tables with multi-leveled validation functions.

Data validation is a critical step in a Data Warehouse, Database or Data Lake migration project, where structured or semi-structured data from both the source and the destination tables are compared to ensure they are matched and correct after each migration step (e.g. data and schema migration, SQL script translation, ETL migration, etc.). The Data Validation Tool provides an automated and repeatable solution to perform this task.

Using SQL Server Reporting Services (SSRS) with Google BigQuery

SQL Server Reporting Services (SSRS) is used for reports and dashboards, and can be used to generate reports directly from Google BigQuery using the BigQuery Simba ODBC drivers (32-bit and 64-bit) .

Important developer note: Visual Studio 2019 is a 32-bit IDE and SSRS Report Server (SQL 2019) is a 64-bit application. Develop and test SSRS reports using a 32-bit ODBC DSN, and then editing the report data source to reference the 64-bit ODBC DSN after deploying the reports to the SQL Server Report Server.

Visual Studio – Installation Process

Install Visual Studio 2019 Community Edition including SQL Server Data Tools (SSDT)

Install the Visual Studio SSIS project template from the Visual Studio SSIS project template from the visual studio marketplace or alternatively, using Chocolatey

Install the Visual Studio SSRS project template from the visual studio marketplace

Download and Install the BigQuery Simba ODBC drivers (32 bit and 64 bit) and Configure the ODBC System DSN’s.

A BigQuery Service Account allows the BigQuery Simba ODBC DSN to access BigQuery tables and views using a stored credential. You must create a BigQuery Service Account and download the key file (.json) before configuring the ODBC DSN. Also, make sure you grant the Service Account the required BigQuery User permissions.

Screenshot: Service Account Permissions for a BigQuery Service Account.

Configure the ODBC System DSN’s (32-bit and 64-bit)

*UI Hint: When configuring the DSN, copy and paste your GCP ProjectID in the Catalog (Project) field, then select the Dataset, then click the Catalog (Project) dropdown to re-select the Catalog (Project).

Configure SQL Server Reporting Services

When we execute a report and specify that the data source does not require a username or password, SSRS requires an execution account that is a domain account.  Note that a test domain user account GONTOSOssrs-demo was created for this example. This account is a simple domain user account and has no permissions on the SSRS Report Server.

Add the execution account in the Report Server Configuration Manager below.

SSRS Report Development & Deployment

It’s important to remember that a 64-bit DSN is required for the report server. It is recommended to develop/test with the 32-bit DSN and then modify the Data Source on the SSRS server to reference the 64-bit DSN. Note that in the screenshot below under the Credentials subheading “Without Any Credentials” is checked, which causes SSRS to use the Report Server Execution Account we configured previously.  Also, since the BigQuery Service Account we previously created has Read access to the BigQuery dataset that was created, it’s a good idea to revisit Report Server Roles and Permissions to ensure that reports are secured.

Report Demo

In summary, both developers and analysts who are familiar with SSRS and SSIS can use  familiar tool sets with BigQuery after an initial migration, and then plan to modernize ETL/ELT using Data Flow and Reporting and BI with Looker in subsequent project phases.

Related Article

Understanding Cloud SQL Maintenance: why is it needed?

Get acquainted with the way maintenance works in Cloud SQL so you can effectively plan availability.

Read Article

Source : Data Analytics Read More

What type of data processing organization are you?

What type of data processing organization are you?

Every organization has its own unique data culture and capabilities. Yet each is expected to use technology trends and solutions in the same way as everyone else. Your organization may be built on years of legacy applications, you may have developed a considerable amount of expertise and knowledge, yet you may be asked to adopt a new approach based on a technology trend. On the other hand, you may be on the other side of the spectrum, a digitally native organization built with engineering principles from scratch without legacy systems but expected to follow the same principles as process driven, established organizations. The question is, should we treat these organizations in the same way when it comes to data processing? In this series of blogs and papers this is what we are exploring: how to set up an organization from the first principles from data analyst, data engineering and data science point of view. In reality, there is no such organization that is solely driven by one of these but it is likely to be a combination of multiple types. What type of organization you become is then driven by how much you are influenced by each of these principles. 

When you are considering what data processing technology encompasses, take a step back and make a strategic decision based on your key goals. This can be whether you optimize for performance, cost, reduction in operational overhead, increase in operational excellence, integration of new analytical and machine learning approaches. Or perhaps you’re looking to leverage existing employees’ skills while meeting all your data governance and regulatory requirements. We will be exploring these different themes and will focus on how they guide your decision-making process. You may be coming from technologies which are solving some of the past problems and some of the terminologies may be more familiar, however they don’t scale your capabilities. There is also the opportunity cost of prioritizing legacy and new issues that arise from a transformation effort, and as a result your new initiative can set you further behind on your core business while you play catch up to an ever changing technology landscape. 

Data value chain

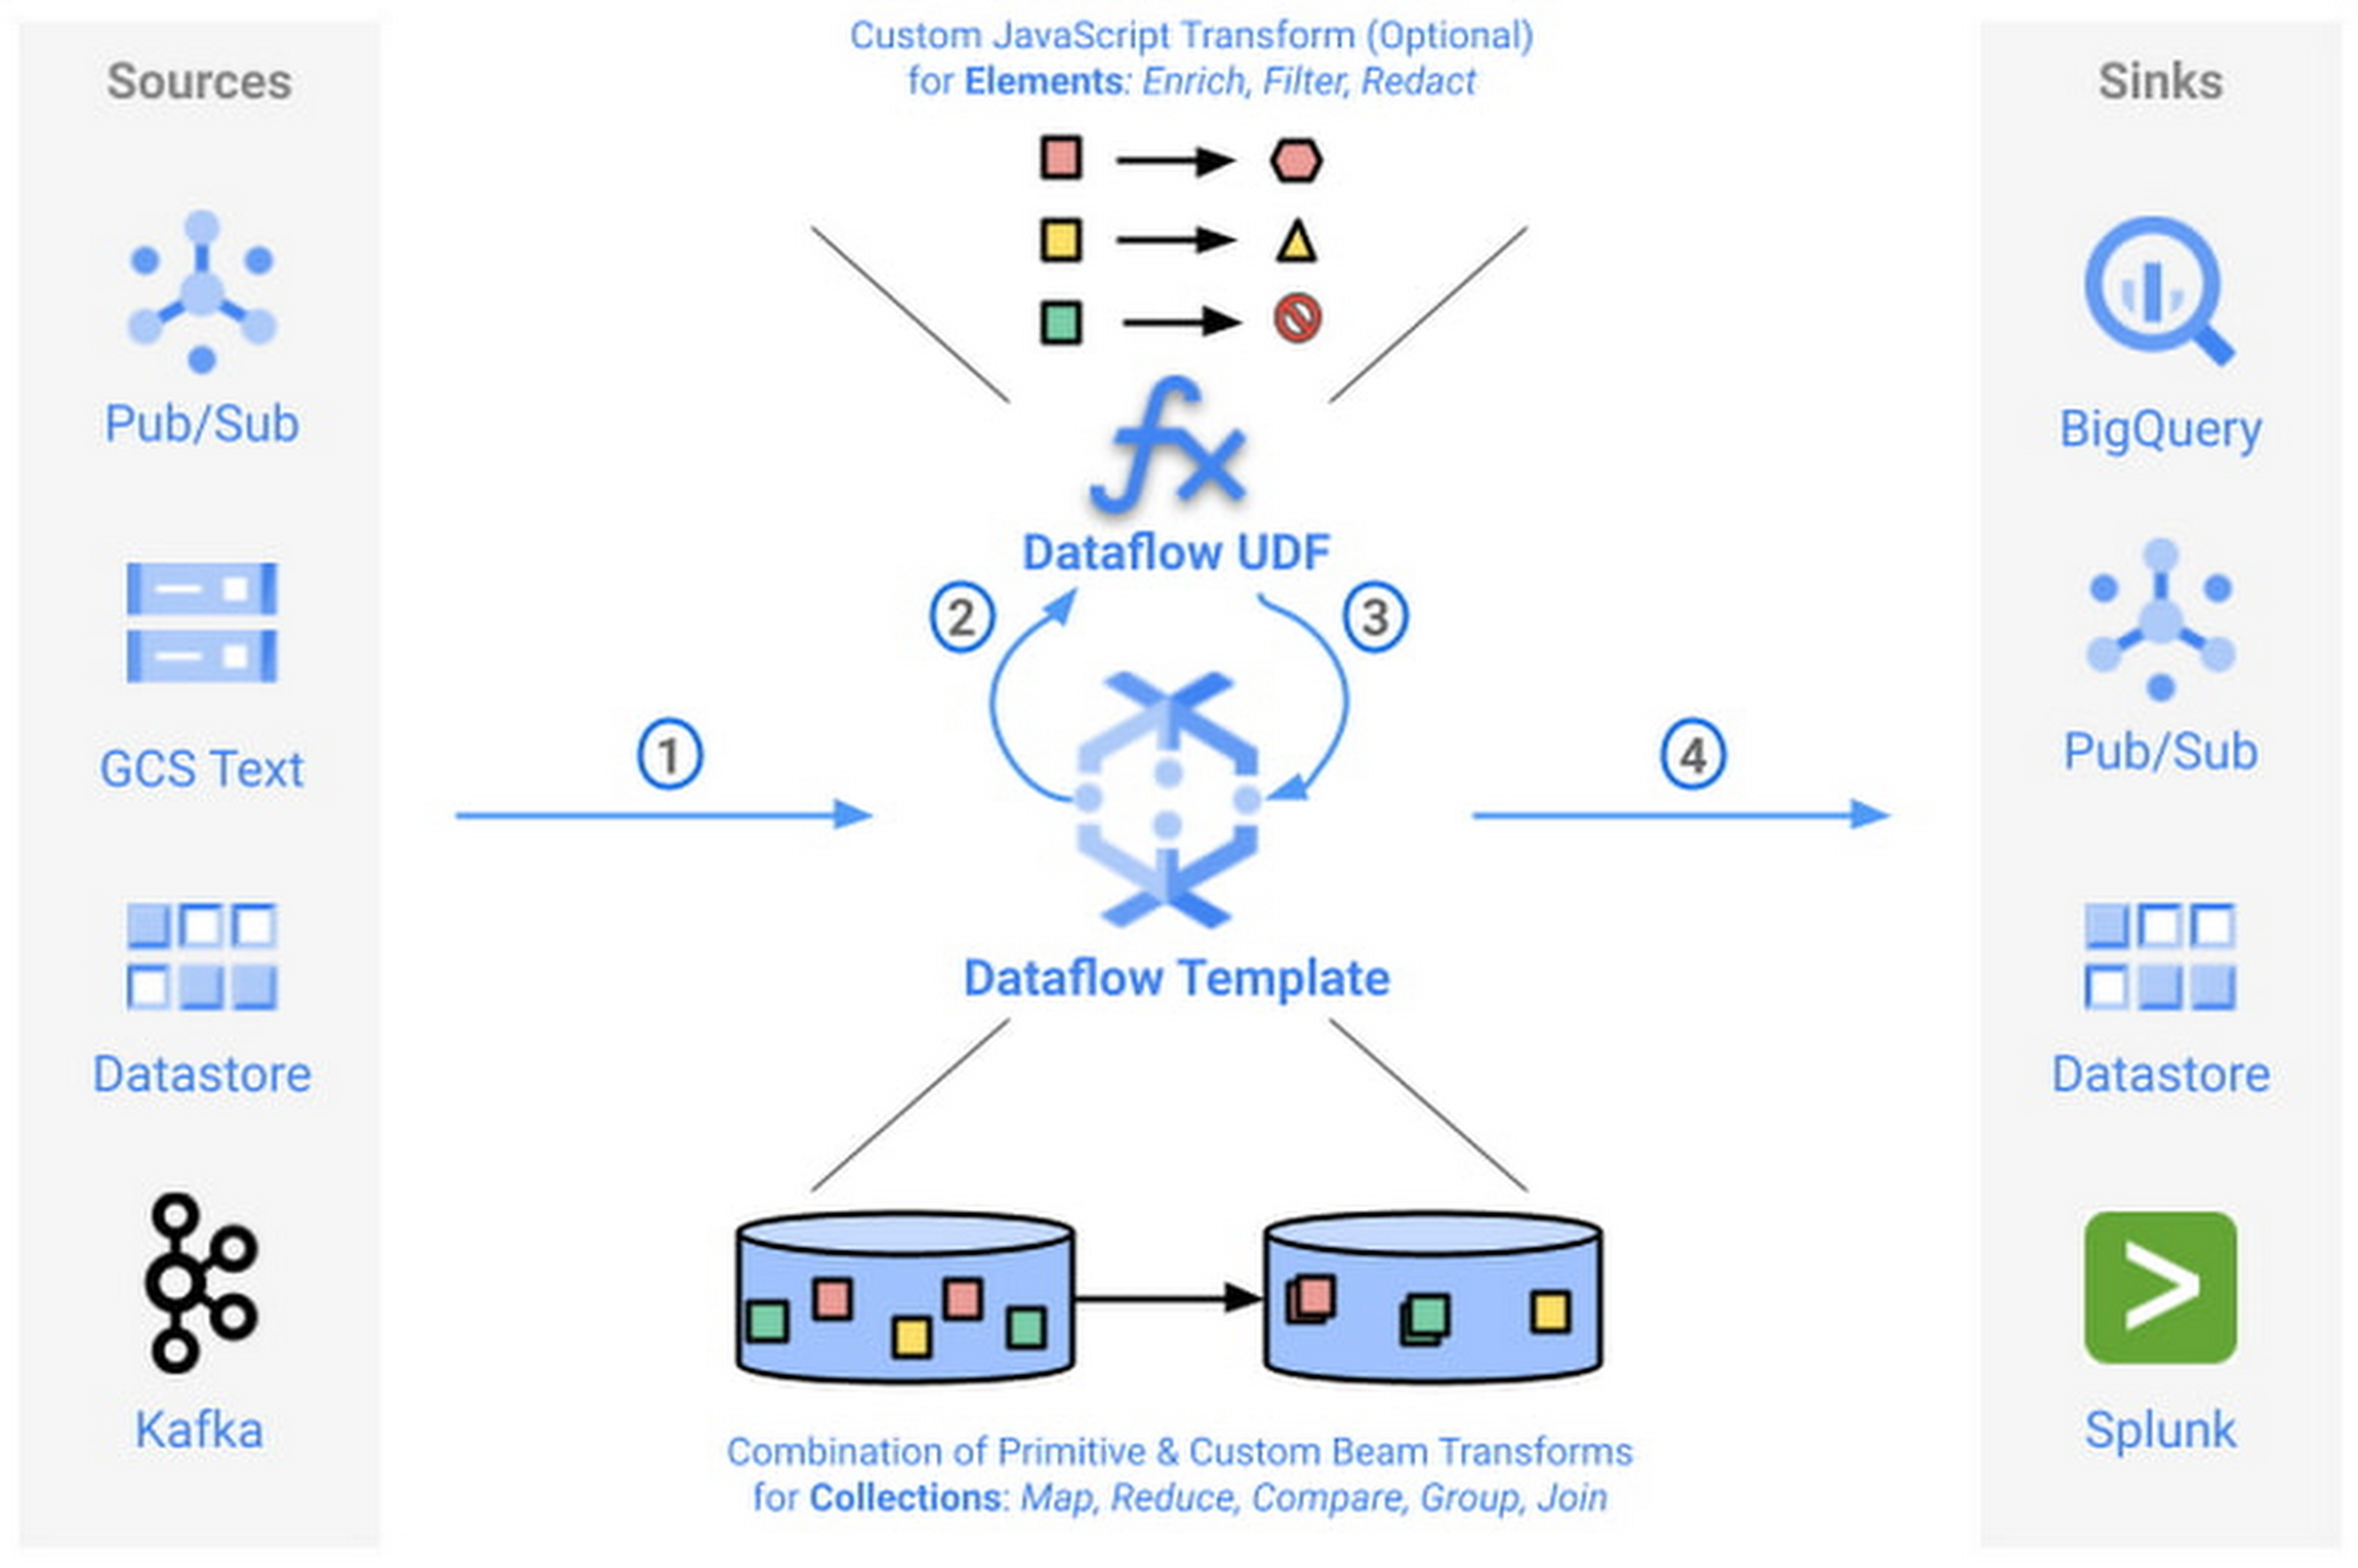
The key for any ingestion and transformation tool is to extract data from a source and start acting on it. The ultimate goal is to reduce the complexity and increase the timeliness of the data. Without data, it is impossible to create a data driven organization and act on the insights. As a result, data needs to be transformed, enriched, joined with other data sources, and aggregated to make better decisions. In other words, insights on good timely data mean good decisions.

While deciding on the data ingestion pipeline, one of the best approaches is to look into the volume of data, the velocity of the data, and type of data that is arriving. Other considerations include the number of different data sources you are managing, whether you need to scale to thousands of sources using generic pipelines, whether you want to create one generic pipeline but then apply data quality rules and governance. ETL tools are ideal for this use case as generic pipelines can be written and then parameterized. 

On the other hand, consider the data source. Can the data be directly ingested without transforming and formatting the data? If the data does not need to be transformed and can be ingested directly into the data warehouse as a managed solution. This not only reduces the operational costs but also allows for more timely data delivery. If the data is coming in through an unstructured format such as XML or in a format such as EBCDIC and needs to be transformed and formatted, then a tool with ETL Capabilities can be used depending on the speed of the data arrival. 

It is also important to understand the speed and time of arrival of the data. Think about your SLAs and time durations/windows that are relevant for your data ingestion plans. This would not only drive the ingestion profiles but would also dictate which framework to use. As discussed above, velocity requirements would drive the decision-making process.

Type of Organization

Different organizations can be successful by employing different strategies based on the talent that they have. Just like in sports, each team plays with a different strategy with the ultimate goal of winning. 

Organizations often need to decide on what’s the best strategy to take in respect to data ingestion and processing – whether you need to hire an expensive group of data engineers, or exploit your data wizards and analysts to enrich and transform data that can be acted on, or whether it would be more realistic to train the current workforce to do more functional/high value work rather than to focus on building generally understood and available foundational pieces.

On the other hand, the transformation part of ETL pipelines as we know it, dictates where the load will be. All of these are made a reality in the cloud native world where data can be enriched, aggregated, and joined. Loading data into a powerful and modern data warehouse means that you can already join and enrich the data using ELT. Consequently, ETL isn’t really needed in its strict terms anymore if the data can be loaded directly into the data warehouse.

All of the above was not possible in the traditional, siloed, and static data warehouses and data ecosystems whereby systems would not talk to each other or there were capacity constraints in respect to both storing and processing the data in the expensive Data Warehouse. This is no longer the case in the BigQuery world as storage is now cheap and transformations are now much more capable without constraints of virtual appliances. 

If your organization is already heavily invested into an ETL tool, one option is to use them to load BigQuery and transform the data initially within the ETL tool. Once the as-is and to-be are verified to be matching, then with the improved knowledge and expertise one can start moving workloads into BigQuery SQL, and effectively do ELT. 

Furthermore, if your organization is coming from a more traditional data warehouse that extensively relies on stored procedures and scripting, then the question that one may ask is, do I continue leveraging these skills and expertise and use these capabilities that are also provided in BigQuery? ELT with BigQuery is more natural, similar to what’s already in Teradata BTEQ, Oracle PL/SQL but migrating from ETL to ELT requires changes. This change then enables exploiting streaming use cases, such as real-time use cases in retail. This is because there is no preceding step before data is loaded and made available.

Organizations can be broadly classified under 3 types as Data Analyst Driven, Data Engineering driven, and Blended organization. We will be covering a Data Science driven organization within the Blended category.   

Data Analyst Driven

Analysts understand the business and are used to using SQL/spreadsheets. Allowing them to do advanced analytics through interfaces that they are accustomed to enables scaling. As a result, easy to use ETL tooling to bring data quickly into the target system becomes a key driver. Ingesting data directly from a source or staging area then also becomes critical as it allows analysts to exploit their key skills using ELT and increases timeliness of the data. This is commonplace with traditional EDWs and realized by extended capabilities of using Stored Procedures and Scripting. Data is enriched, transformed, and cleansed using SQL and ETL tools act as the orchestration tools. 

The capabilities brought by cloud computing on separation of data and computation changes the face of the EDW as well. Rather than creating complex ingestion pipelines, the role of the ingestion becomes, bringing data close to the cloud, staging on a storage bucket or on a messaging system before being ingested into the cloud EDW. This then releases data analysts to focus on looking into data insights using tools and interfaces that they are accustomed to. 

Data Engineering / Data Science Driven 

Building complex data engineering pipelines is expensive but enables increased capabilities. This allows creating repeatable processes and scaling the number of sources. Once complemented with cloud it enables agile data processing methodologies. On the other hand, data science organizations allow carrying out experiments and producing applications that work for specific use cases but are not often productionised or generalized. 

Real-time analytics enables immediate responses and there are specific use cases where low latency anomaly detection applications are required to run. In other words, business requirements would be such that it has to be acted upon as the data arrives on the fly. Processing this type of data or application requires transformation done outside of the target.

All the above usually requires custom applications or state-of-the-art tooling which is achieved by organizations that excel with their engineering capabilities. In reality, there are very few organizations that can be truly engineering organizations. Many fall into what we call here as the blended organization.  

Blended org

The above classification can be used on tool selection for each project. For example, rather than choosing a single tool, choose the right tool for the right workload, because this would reduce operational cost, license cost and use the best of the tools available. Let the deciding factor be driven by business requirements: each business unit or team would know the applications they need to connect with to get valuable business insights. This coupled with the data maturity of the organization would be the key to making sure the right data processing tool would be the right fit. 

In reality, you are likely to be somewhere on a spectrum. Digital native organizations are likely to be closer to being engineering driven, due to their culture and business that they are in. However, brick and mortar organizations would be closer to being analyst driven due to the significant number of legacy systems and processes they possess. These organizations are either considering or working toward digital transformation with an aspiration of having a data engineering / software engineering culture like Google. 

The blended organization with strong skills around data engineering, would have built the platform and built frameworks, to increase reusable patterns would increase productivity and then reduce costs. Data engineers focus on running Spark on Kubernetes whereas infrastructure engineers focus on container work. This in turn provides unparalleled capabilities as application developers focus on the data pipelines and even the underlying technologies or platforms changes code stays the same. As a result, security issues, latency requirements, cost demands and portability are addressed at multiple layers. 

Conclusion – What type of organization are you?

Often an organization’s infrastructure is not flexible enough to react to a fast changing technological landscape. Whether you are part of an organization which is engineering driven or analyst driven, organizations frequently look at technical requirements that inform which architecture to implement. But a key, and frequently overlooked, component needed to truly become a data-driven organization is the impact of the architecture on your data users. When you take into account the responsibilities, skill sets, and trust of your data users, you can create the right data platform to meet the needs of your IT department as well as your business.

To become a truly data-driven organization, the first step is to design and implement an analytics data platform that meets your technical and business needs. The reality is that each organization is different and has a different culture, different skills, and capabilities. Key is to leverage its strengths to stay competitive while adopting new technologies when it is needed and as it fits to your organization. 

To learn more about the elements of how to build an analytics data platform depending on the organization you are, read our paper here.

Related Article

Just released: The Google Cloud Next session catalog is live. Build your custom playlists.

Google Cloud Next session catalog is live

Read Article

Source : Data Analytics Read More