Artificial Intelligence (AI) is changing the commercial real estate industry by making everything more efficient, accessible, and transparent. Many companies are using AI to analyze their data and make better business decisions. AI can also be used to provide valuable insights into leasing trends, maximize vacancy rates, and forecast future demand.
Below are the myriad of ways AI will change things for commercial real estate in the next few years.
How can AI be used in commercial real estate?
Real estate is a service business and selling houses or apartments is only one part of the puzzle. Making sure potential clients know how they can utilize real estate services is just as important. Businesses are investing in technology to connect clients with the right person at the right time. Today, in many cases, AI can be used to make it happen.
For example, during the real estate transaction process, artificial intelligence can help agents and brokers access properties quickly, providing a personalized approach to each potential tenant. It can also provide pre-sales that are customized to each client’s needs.
The same process applies to offering services. For example, property managers can use artificial intelligence to automate the scheduling process, improving customer service. It can also help make processes less expensive and less time-consuming.
Making better decisions with AI
The human brain works in a similar way to how a computer works. The thing that differentiates the brain is that it has more data storage capacity, and it uses a vast amount of data to make the right decisions.
AI uses this information to analyze business data and to provide timely, relevant and accurate results for specific industries and businesses. It can also be used to analyze big data and to predict trends. For example, it can identify that a particular industry is likely to experience a shortage.
But to use AI, you have to set it up correctly. You also have to realize that AI is not a magic bullet that will make you a genius. To fully leverage AI, you have to identify specific problems that it will solve, train it to learn, and apply it to your real estate business.
Increase revenues with AI
Using AI, businesses can real estate agency revenue through real estate lead generation. It can be used in marketing campaigns, web scraping for listings, and other types of lead generation.
Commercial real estate agents also benefit from the use of AI. The technology can alert the right people to the right properties, making it easier to connect with prospective tenants. AI can also analyze transaction data to estimate return on investment (ROI). In other words, it can be used to help predict how much revenue a business can expect to earn and at what cost.
There are also areas where the use of AI can help clients and other organizations make better business decisions. For example, it can analyze social media activity and activity to provide a better picture of the buying public. It can also help with providing analytics that can predict future market movements.
Decreasing vacancies with AI
Leasing and holding vacant properties is a highly competitive field. When companies are looking to buy or lease a property, the agent representing them is getting a lot of interest. This creates high demand for spaces, which drives up prices. The result is a great deal of competition for any available spaces. The space must be vacant for the same amount of time as other competing spaces.
Without AI, companies are at a big disadvantage in this market. It can provide insights to help understand market trends and the ability of an area to withstand strong competition. It can also learn to better price new spaces to encourage tenants to move in.
AI can also help tenants navigate a complex process that requires dealing with a lot of small issues. It can reduce time spent on filing forms and setting up the structure of the lease. AI can also reduce headaches and errors when it comes to dealing with tenants.
If you need inexpensive managed messaging for streaming analytics, Pub/Sub Lite was made for you. Lite can be as much as 10 times cheaper than Pub/Sub. But, until now, the low price came with a lot more work. You had to manage the read and write throughput capacity of each partition of every topic. Have 10 single-partition topics? Make sure you watch 10 write and another 10 read capacity utilization metrics or you might run out of capacity.
Hello, Reservations
We did not like this either. So we launched Pub/Sub Lite Reservations to manage throughput capacity for many topics with a single number. A reservation is a regional pool of throughput capacity. The capacity can be used interchangeably for read or write operations by any topic within the same project and region as the reservation. You can think of this as provisioning a cluster of machines and letting it handle the traffic. Except instead of a cluster, there is just a single number.
Less work is great, of course. It is even better when it saves you money. Without reservations, you must provision each topic partition for the highest peaks in throughput. Depending on how variable your traffic is this can mean that half or more of the provisioned capacity is unused most of the time. Unused, but not free.
Reservations allow you to handle the same traffic spikes with less spare capacity. Usually, the peaks in throughput are not perfectly correlated among topics. If so, the peaks in the aggregate throughput of a reservation are smaller, relative to the time average, than the peaks in individual topics. This makes for less variable throughput and reduces the need for spare capacity.
As a cost-saving bonus, reservations do away with the explicit minimum capacity per partition. There is still a limit on the number of partitions per reservation. With this limit, you pay for at least 1 MiB/s per topic partition. This is not quite “scale to zero” of Pub/Sub, but beats the 4 MiB/s required for any partition without reservations.
An Illustration
Suppose you have three topics with traffic patterns that combine a diurnal rhythm with random surges. The minimum capacity needed to accommodate this traffic is illustrated below.
“Before” you provision for the spikes in each topic independently. “After,” you aggregate the traffic, dampening most peaks. In practice, you will provision more than shown here to anticipate the peaks you haven’t seen. You will also likely have more topics. Both considerations increase the difference in favor of reservations.
Are Reservations Always Best?
For all the benefits of shared capacity, it has the “noisy neighbor” problem. A traffic peak on some topics can leave others without capacity. This is a concern if your application critically depends on consistent latency and high availability. In this case, you can isolate noisy topics in a separate reservation. In addition, you can limit the noise by setting throughput caps on individual topics.
All in all, if you need to stream tens of megabytes per second at a low cost, Lite is now an even better option.
Editor’s note: Today we’re hearing from Ryan Mason, Director, Head of DTC Growth & Strategy, at alcoholic beverage firm, Constellation Brands on the company’s shift to Direct-to-Consumer (DTC) sales and how Google Cloud’s powerful technology stack helped with this transformation.
It’s no secret that consumer businesses have been up-ended in a lasting manner after 18 months of the pandemic. Consumers have been forced to shop differently over the past year – and as a result, they’ve evolved to be more comfortable with online spending and have grown to expect a certain level of convenience. While the e-commerce share of consumer sales has grown steadily over the past decade, the pandemic was the catalyst for the famous “10 years of growth in 3 months” which many argue is here to stay.
Facing this reality head-on, we placed a new emphasis on Direct-to-Consumer (DTC) with our acquisition of Empathy Wines, a DTC-native wine brand that sells directly to consumers via e-commerce. To accelerate our innovation in the DTC space, we added headcount and new functions to the existing Empathy team and empowered the newly-minted DTC group to apply their digital commerce operating model across the rest of the wine and spirits portfolio, which includes Robert Mondavi Winery, Meiomi Wines, The Prisoner Wine Company, High West Whiskey, and more.
One pandemic and one year later, DTC sales have surged in the wine and spirits category with Constellation positioned as a leader armed with a unique and powerful cloud technology stack, best-in-class e-commerce user experiences, modernized fulfillment solutions, and data-driven growth marketing.
Benefits of Going DTC
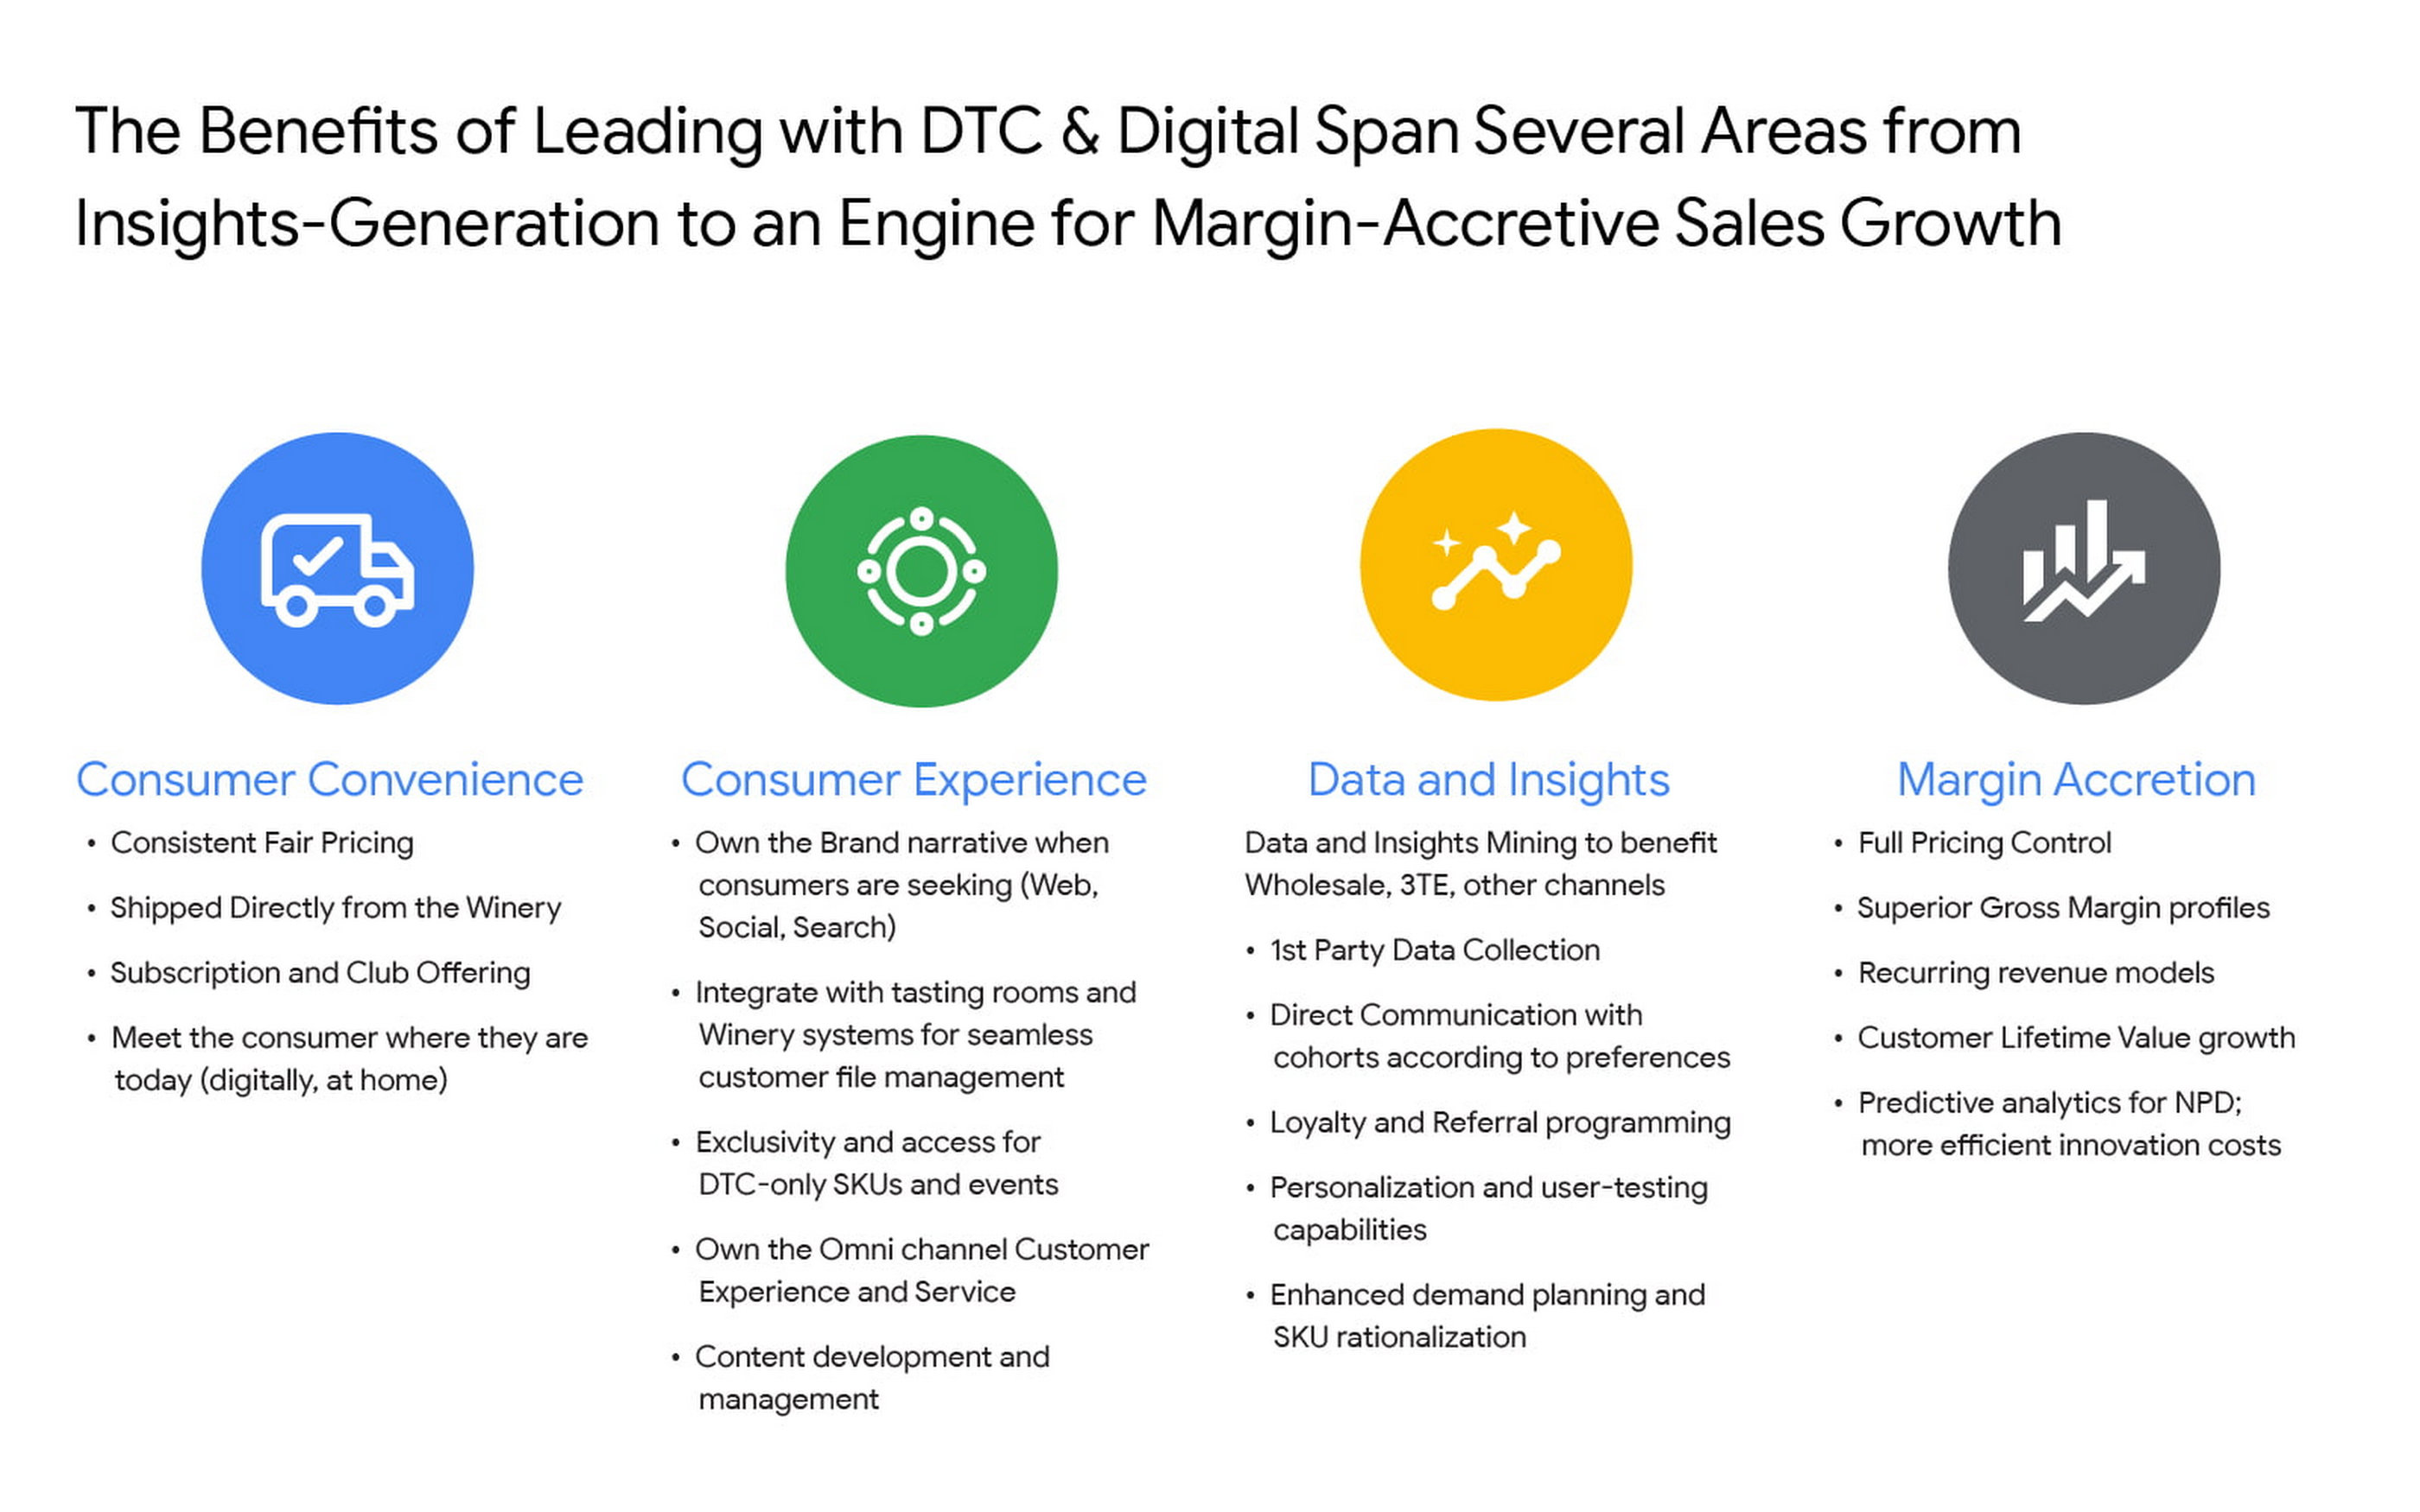
A report from McKinsey estimates that the strategic business shift to DTC has been accelerated by two years because of the pandemic and argues that consumer brands that want to thrive will need to aim for a 20% DTC business or higher, which is already taking shape in the market: Nike’s direct digital channels are on track to make up 21.5% of the total business by the end of 2021, up from 15.5% in the last fiscal year, and Adidas is aiming for 50% DTC by 2025. But outside of the clear revenue upside, the auxiliary benefits of going DTC are robust.
Click to enlarge
For Constellation Brands, each of these four pillars ring true, and our shift toward DTC is as much about margin accretion and revenue mix management as it is about consumer insights and data. The added complexities of the alcohol space add wrinkles to our DTC approach and manifest in many areas like consumer shopping preference, shipping and logistics hurdles, and more. In order to win share early and continue to lead the category, we recognized the need to harness the immense amount of first-party data to power impactful and actionable insights.
Our DTC technology architecture has fostered a value chain that is completely digitized: website traffic, marketing expenditures, tasting room transactions, e-commerce transactions, logistics and fulfillment events, cost of goods sold (COGS) and margin profiles, etc. are recorded and stored in a data warehouse in real time. For the first time, at any given moment, we can easily and deterministically answer complex business questions like “what is the age and gender distribution of my customers from Los Angeles who have purchased SKU X from Brand.com Y in the last 6 months? What is the cohort net promoter score? Did that increase after we introduced same-day shipping in this zip code? By how much?”
The ability to answer these questions and understand the root causes allows us to stay nimble with product offerings and iterate marketing strategies at the speed of consumer preference. Further, it enables us to optimize our omnichannel presence in the same manner by leaning on DTC consumer insights to develop valuable strategies with key wholesale distribution partners and 3-Tier eCommerce partners like Drizly and Instacart. At its core, Constellation’s DTC practice is designed to be the consumer-centric “tip-of-the-spear” responsible for generating insights from which all sales channels, including wholesale, can benefit.
Constellation’s DTC technology approach prioritizes consumer-centricity and insights generation
We have taken a modern approach to building a digital commerce technology stack, leveraging a hub-and-spoke model built around Shopify Plus and other key emergent technology providers like email provider Klaviyo, loyalty platform Yotpo, Net Promoter Score measurer Delighted, Customer Service module Gorgias, payments processor Stripe, event reservations platform Tock, and many more. For digital marketing and analytics, we use Google Cloud and Google Marketing Platform, which includes products like Analytics 360, Tag Manager 360, and Search Ads 360.
To help gather, organize, and store all of the inbound data from the ecosystem, we partnered with SoundCommerce, a data processing platform for eCommerce businesses. Together with SoundCommerce, we are able to automate data ingestion from all endpoints into a central data warehouse in Google BigQuery. With BigQuery, our data team is able to break data silos and quickly analyze large volumes of data that help unlock actionable insights about our business. BigQuery itself allows for out-of-the-box predictive analytics using SQL via BigQuery ML, and a key differentiator for us is that all Google Marketing Platform data is natively accessible for analysis within BigQuery.
But data possession only addresses half of the opportunity: we needed a powerful andmodern business intelligence platform to help make sense of the vast amounts of data flowing into the system. Core to the search was to find a partner that approached BI in a way that fit with our future-looking strategy.
Our DTC team relies on the accurate measurement of variable metrics like Customer Acquisition Cost (CAC), Customer Lifetime Value (CLV), Churn, and Net Promoter Score (NPS) as a bellwether of the health of the business and monitoring these figures on a daily basis is paramount to success. To enable us to keep an accurate pulse on strategic KPIs, we considered several incumbent BI platforms. Ultimately we selected Google Cloud’s Looker for a range of benefits that separated it from the rest of the pack.
Click to enlarge
From a vision perspective, in this particular case we felt Looker was most aligned with our belief that better decisions are made when everyone has access to accurate, up-to-date information. Looker allows us to realize that vision by surfacing data in a simple web-based interface that empowers everyone to take action with real-time data on critical commercial activities. Furthermore, Looker’s ability to automate and distribute formatted modules to a myriad of stakeholders on a regular cadence increases data literacy and business performance transparency.
From a product perspective, we chose Looker for it’s cloud offering, web-based interface, and centralized, agile modeling layer that creates a trusted environment for all users to confidently interact with data — without any actual data extraction. While other BI tools have centralized semantic layers that require skilled IT resources, we’ve experienced that those can lead to bottlenecks and limited agility. With Looker’s semantic layer, LookML, our BI Team, led by Peter Donald, can easily build upon their SQL knowledge to add both a high degree of control as well as flexibility to our data model. The fully browser-based development environment allows the data team to rapidly develop, test, and deploy code and is backed by robust and seamless Git source code management.
In parallel, LookML empowers business users to collaborate without the need for advanced SQL knowledge. Our data team curates interactive data experiences with Looker to help scale access and adoption. Business users can explore ad hoc analysis, create dashboards, and develop custom data experiences in the web-based environment to get the answers they need without relying on IT resources each time they have a new question, while also maintaining the confidence that the underlying data will always be accurate. This helps us meet our primary goal of providing all businesses users with the data access they need to monitor the pulse of key metrics in near real-time.
Impact and future of DTC BI at Constellation
In short order, taking a modern and integrated approach to the DTC technology stack has delivered economic impact across the portfolio, helping our team understand and combat customer churn, increase conversion rates, and optimize the customer acquisition cost (CAC) and customer lifetime value (CLV) ratios. Perhaps most important is the benefit it can provide to the customer base. Mining customer data and consumer behavior generates data into what our customers are seeking, giving us insights to supply more, or less of it. For example, observing sales velocity and conversion rates by SKU or by region can help us better understand changes in customer taste profiles and fluctuations in demand, providing the foundation for a more powerful innovation pipeline and more effective sales and distribution tactics in wholesale. Our team has also been an early pilot tester for Looker’s new integration with Customer Match, which contributes to the virtuous cycle between data insight and data activation. In the future, our plan is to leverage this cycle to amplify the impact of Google Ads across Search, Shopping, and YouTube placements for the wine and spirits portfolio.
The operational impact of Looker is also substantial: our team estimates that the number of hours needed to reach critical business decisions has been reduced by nearly 60%, boosting productivity and accelerating the daily operating rhythm. A thoughtfully curated technology stack together with a modern BI solution allows us to stay at the vanguard of the industry. While the DTC sales channel is not designed to surpass the core business of wholesale for Constellation in terms of size, the approach enables unparalleled insights and measurement abilities that will pay dividends for the entire business for years to come.
Every company runs on data, but not every organization knows how to create value out of the data it generates. The first step to becoming a data driven company is to create the right ecosystem for data processing in a holistic way. Traditionally, organizations’ data ecosystems consisted of point solutions that provide data services. But that point solution approach is, for many companies, no longer sufficient.
One of the most common questions we get from customers is, “Do I need a data lake, or should I consider a data warehouse? Do you recommend I consider both?” Traditionally, these two architectures have been viewed as separate systems, applicable to specific data types and user skill sets. Increasingly, we see a blurring of lines between data warehouses and data lakes, which provides customers with an opportunity to create a more comprehensive platform that gives them the best of both worlds.
What if we don’t need to compromise, and we instead create an end-to-end solution covering the entire data management and processing stages, from data collection to data analysis and machine learning? The result is a data platform that can store vast amounts of data in varying formats and do so without compromising on latency. At the same time, this platform can satisfy the needs of all users throughout the data lifecycle.
Emerging Trends
There is no one-size-fits-all approach to building an end-to-end data solution. Emerging concepts include data lakehouses, data meshes, and data vaults that seek to meet specific technical and organizational needs. Some are not new and have been around in different shapes and formats, however, all of them work naturally within a Google Cloud environment. Let’s look into both ends of the spectrum of enabling data and enabling teams.
Data mesh facilitates a decentralized approach to data ownership, allowing individual lines of business to publish and subscribe to data in a standardized manner, instead of forcing data access and stewardship through a single, centralized team. On the other hand, a data lakehouse brings raw and processed data closer together, allowing for a more streamlined and centralized repository of data needed throughout the organization. Processing can be done in transit via ELT, reducing the need to copy datasets across systems. This allows for easier data exploration and easier governance. The Data lakehouse works to store the data in a single-source-of-truth, making minimal copies of the data. This architecture offers low-cost storage in an open format accessible by a variety of processing engines like Spark, while also providing powerful management and optimization features. Consistent security and governance is key to any lakehouse. Finally, a data vault is designed to separate data-driven and model-driven activities. Data integrated into the raw vault enables parallel loading to facilitate scaling of large implementations.
In Google Cloud, there is no need to keep them separate. In fact, with interoperability among our portfolio of data analytics products, you can easily provide access to data residing in different places, effectively bringing your data lake and data warehouse together on a single platform.
Let’s look at some of the technological innovations that make this reality. BigQuery’s storage API allows treating a data warehouse like a data lake, letting you access the data residing in BigQuery. For example, you can use Spark to access data residing in the data warehouse without it affecting the performance of any other jobs accessing it. This is all made possible by the underlying architecture, which separates compute and storage. Likewise, Dataplex, our intelligent data fabric service, provides data governance and security capabilities across various lakehouse storage tiers built on GCS and BigQuery.
We will continue to offer specialized products and solutions around data lake and data warehouse functionality but over time we expect to see a significant enough convergence of the two systems that the terminology will change. At Google Cloud, we consider this combination an “analytics data platform”.
Tactical or Strategical
Google Cloud’s data analytics platform is differentiated by being open, intelligent, flexible, and tightly integrated. There are many technologies in the market which provide tactical solutions that may feel comfortable and familiar. However, this can be a rather short-term approach that simply lifts and shifts a siloed solution into the cloud. In contrast, an analytics data platform built on Google Cloud offers modern data warehousing and data lake capabilities with close integration to our AI Platform. It also provides built-in streaming, ML, and geospatial capabilities and an in-memory solution for BI use cases. Depending on your organizational data needs, Google Cloud has the set of products, tools, and services to create the right data platform for you.
To become a truly data-driven organization, the first step is to design and implement an analytics data platform that meets your technical and business needs. Whether you want to empower teams to own, publish, and share their data across the organization, or you want to create a streamlined store of raw and processed data for easier discovery, there is a solution that best meets the needs of your company.
To learn more about the elements of a unified analytics data platform built on Google Cloud, and the differences in platform architectures and organizational structures, read our Unified Analytics Platform paper.
BigQuery provides predictable and flexible pricing models for workload management. There are mainly 2 types: On-demand pricing and Flat-rate pricing. You can easily mix and match these pricing models to get the best value for money.
With on-demand pricing, you pay per query. This is suitable for initial experimentation or small workloads. Flat-rate pricing consists of short-term and long-term commitments. For short-term commitments or flex slots, you can buy slots for as little as 60 second durations. These enable burst use cases like seasonal spikes. With long-term commitments, you can buy slots per month or year. Monthly and annual commitments are the best choice for on-going or complex workloads that need dedicated resources with fixed costs.
Workload management
In this section we will cover three key concepts: Commitments, Reservations and Assignments
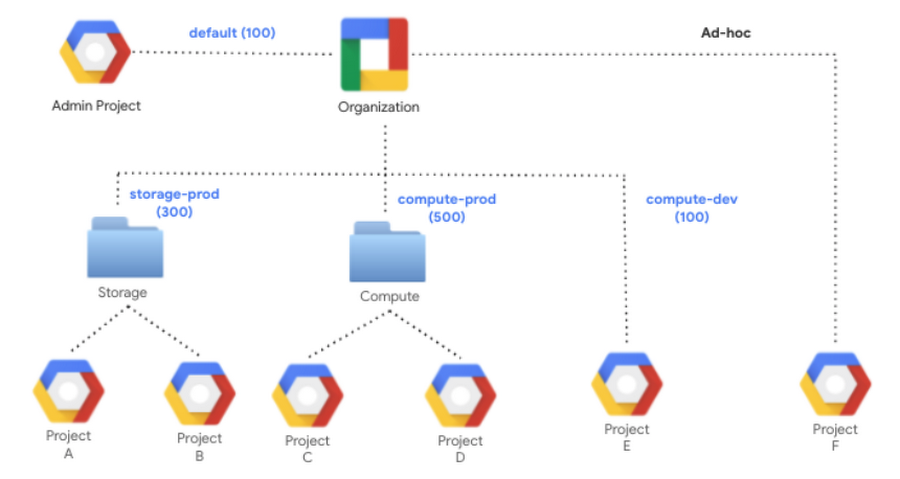
With flat-rate pricing you purchase a commitment, where you purchase a dedicated number of BigQuery slots. The first time you buy a slot commitment, BigQuery creates a default reservation and assigns your entire Google Cloud Organization to it. Commitments are purchased in a dedicated administration project, which centralizes the billing and management of purchased slots. Slots are a regional resource, meaning they are purchased in a specific region or multi-region (e.g. US) and can only be used for jobs used on data stored in that region.
A reservation is a pool of slots created from a commitment. An assignment is used to allocate slots within a reservation to a project, folder or the entire organization. If you don’t create any assignment, BigQuery automatically shares the slots across your organization. You can specify which jobs should be using each reservation by indicating a job type of QUERY, PIPELINE (which includes LOAD, EXTRACT, and COPY jobs) or ML_EXTERNAL. You can also force a specific project to leverage on-demand slots by assigning it to a NONE reservation.
Each level in the GCP resource hierarchy inherits the assignment from the level above it, unless you override it. However, the lowest granularity of slot assignment always takes precedence. For example, let’s say the organization is assigned to the “default” reservation. Any folder or project (like Project F) in the org will use the corresponding 100 slots. However, the dedicated reservation assignments for Storage (300) and Compute (500) folders will take precedence over the “default” reservation. Similarly, Project E’s “compute-dev” assignment with 100 slots will take precedence. In this case, precedence means that they will leverage the available slots from the “storage-prod” and “compute-prod” reservations before pulling from other reservations.
Click to enlarge
Idle slot sharing
BigQuery optimizes resource utilization with its unique idle slot sharing capability, not found in any other cloud based data warehouses, which allows any idle slots in a reservation to be available for other reservations to use. As soon as the reservation needs that capacity back, it gets it while queries consuming idle slots simply go back to using their resources as before. This happens in real-time for every slot. This means that all capacity in an organization is available to be used at any time.
Reservation applications patterns
Priority based allocation
Organizations can leverage priority based slot consumption using reservations and idle slot sharing. Reservations with high-priority or low-priority can be used for frequent movement of jobs in and out of the critical and non-critical projects respectively. You can leverage reservations with a small number of slots, and with the idle slots sharing option disabled, to handle expensive queries or ad-hoc workloads. You can also disable the idle slot sharing option when you are looking to get slot estimates for proof-of-concept workloads. Finally, the default reservation, or reservations with no slots can be used for running jobs with lowest priority, projects assigned to these reservations will only use idle slots.
Click to enlarge
For example,
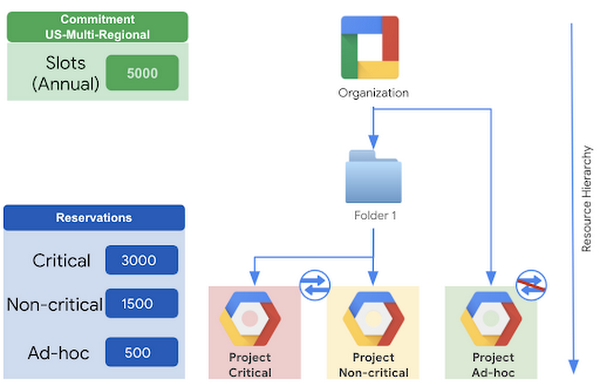
A company has a 5000 slot annual commitment for their organization
All projects in the organization are sharing these 5000 slots (see BigQuery fair scheduling for more details)
Without flat rate pricing, they have found that some critical business reports are delayed, or they are running after the non-critical ones
Additionally, some unapproved or ad-hoc workloads are consuming a lot of slots
Instead, we would recommend that they create 3 compute projects
Critical – assigned to a reservation with 3000 slots
Non-critical – assigned to a reservation with 1500 slots
Idle slots are freely consumed by the above 2
Ad-hoc – assigned to a reservation with 500 slots and idle slots sharing disabled
With this method, critical workloads are guaranteed at least 3000 slots, non-critical workloads are guaranteed at least 1500 slots, and ad-hoc workloads are guaranteed to consume no more than 500 slots
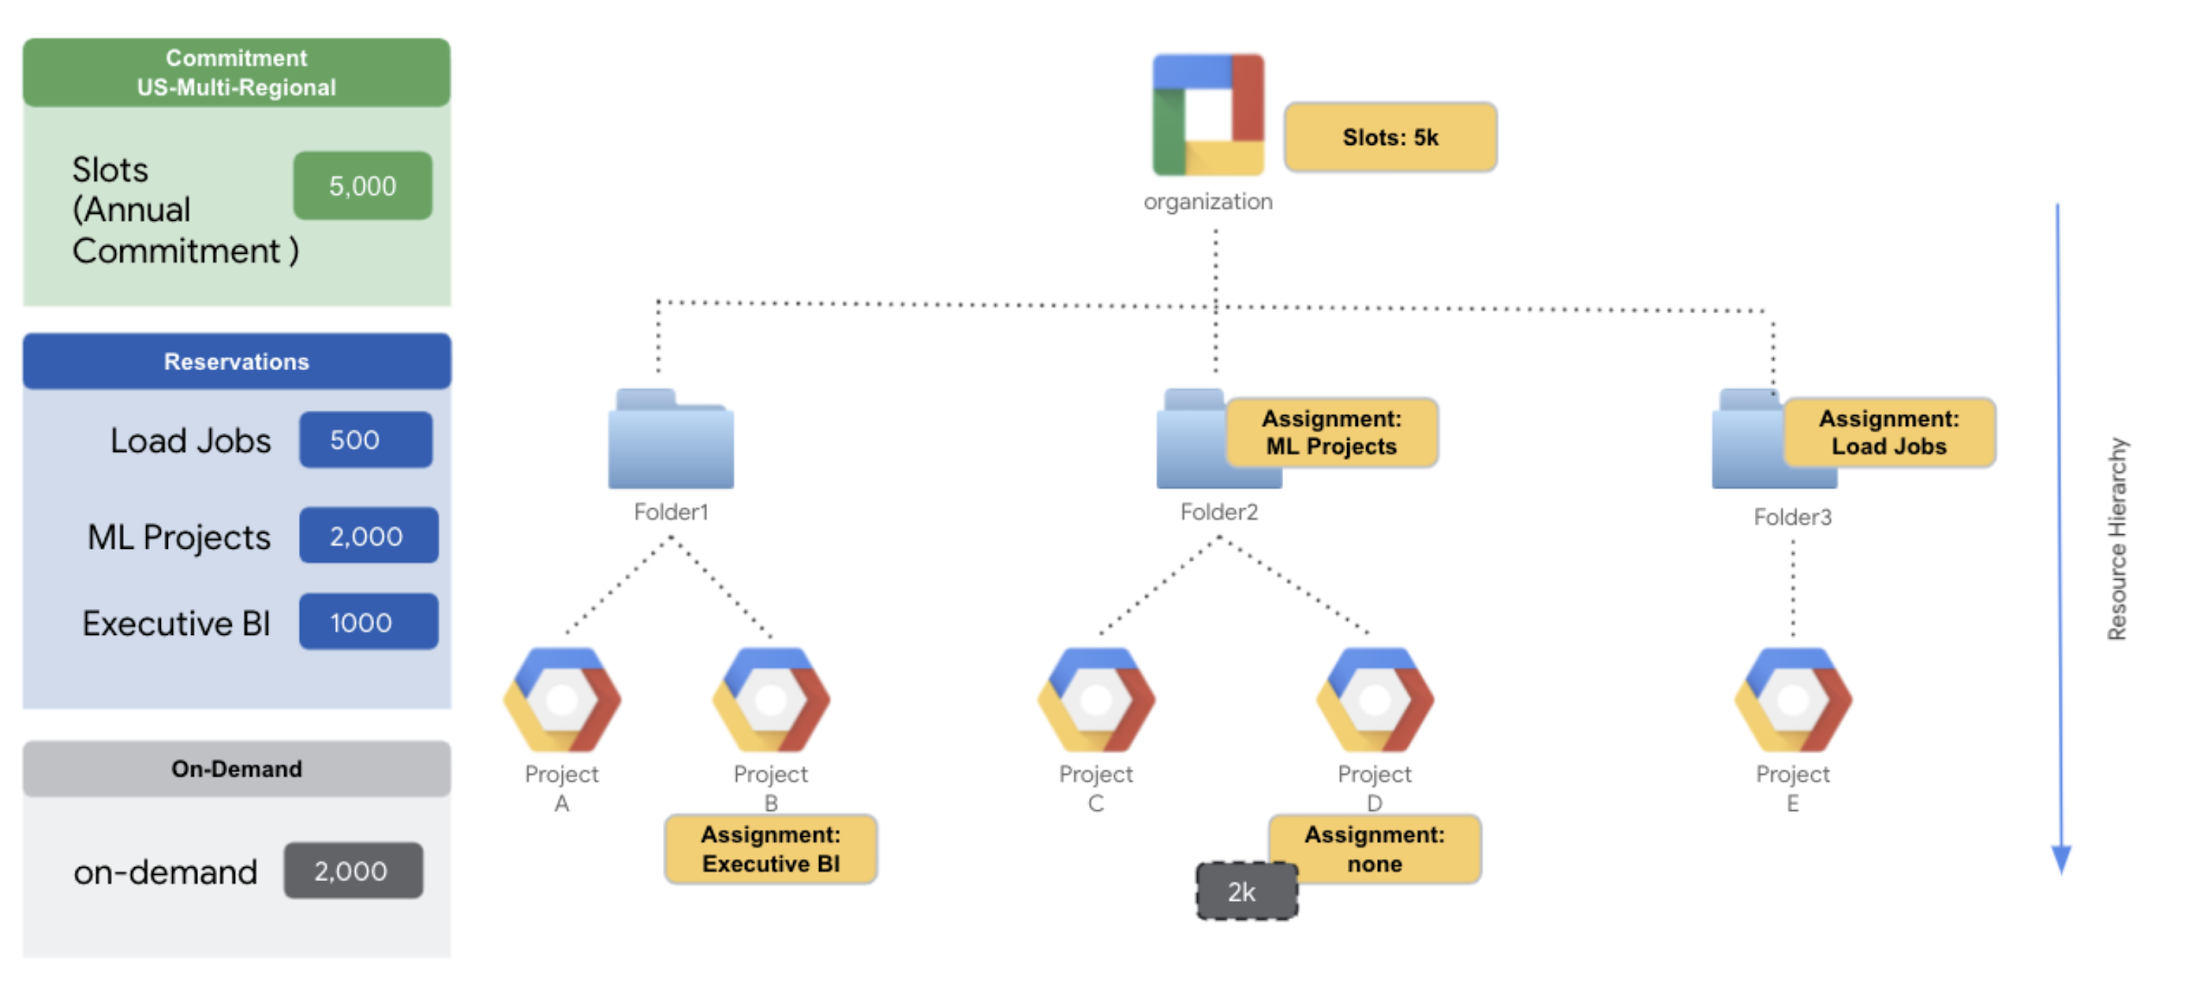
Mixed-mode reservation
Organizations do not need to pick just one pricing method, instead they can leverage flat-rate for some use cases and on-demand for others. Many BigQuery administrators chose to use an on-demand project for loading data. However, if you need to guarantee that data is loaded using a certain number of slots (ensuring a faster turnaround time), then you can leverage assignments for LOAD jobs.
Additionally, on-demand projects can be useful for predictable workloads that are cost effective. Below, we highlight an example of mixing and matching both pricing models in the same organization.
Click to enlarge
Folder 1 projects have access to all the idle slots up from the 5k commitment.
Project B has been explicitly assigned to the ‘Executive BI’ reservation with 1000 slots – to make sure project B gets a minimum of 1000 slots for critical analytics workloads.
Folder 2 projects also have access to all the idle slots from the 5k commitment
Folder 2 has also been assigned to the ‘ML Projects’ reservation – to make sure that projects within the folder have access to a minimum of 2k slots for ML activities.
However, project D has been explicitly assigned to the reservation called ‘none’ to have that project use on-demand slots instead of any slots from the commitment. This is because it is more cost effective for this team to run predictable transformation workloads for machine learning activity in this project, which will have access to a pool of 2k on-demand slots.
Folder 3 has been assigned the reservation ‘Load Jobs’ for ingestion workloads. Therefore, project E would have access to minimum 500 slots for critical data load with access to any additional idle slots from org level reservation.
Capacity planning best practices
The following are general guidelines for pricing options for given workloads:
For highly interactive compute projects, we recommend that you test performance and concurrency needs to assign the proper number of committed slots to the project (more on this below).
For projects with a low interactivity i.e. mainly batch processes with high data processing, we recommend using on-demand slots as a better cost effective option.
High-priority workloads with strict SLAs such as critical BI reports and ML models would benefit from using dedicated slots.
During use case on-boarding, make sure to review the dataset sizes and understand the batch jobs. Potential load sizing can be done via estimation or through technical proof-of-concepts.
Actively monitor slot utilization to make sure you have purchased and assigned an optimal number of slots for given workloads.
Scaling throughput with slots
BigQuery dynamically re-assesses how many slots should be used to execute each stage of a query, which enables powerful performance with respect to throughput and runtime. The following chart displays how BigQuery scales for throughput with an increase in the number of available slots. The chart below highlights throughput test comparison against traditional databases (TD: black line). The test was done with more than 200 TB of data with various degrees of query complexity, and the throughput was measured using number of queries completed within 20 min for the given slot capacity.
Leveraging the performance test metrics above, one can estimate the number of slots needed for simple to medium complexity queries to achieve the desired level of throughput. In general, BigQuery’s throughput increases with a small increase in the number of concurrent queries. However, for larger increases, there are other options to achieve the desired level of throughput. For example, in the chart above, if the number of concurrent queries increases from 200 to 300 for simple queries, there are two options to achieve the desired level of throughput:
Fixed slots: With fixed slots capacity, let’s say 10K slots, the throughput increases from 1000 to 1200 (as seen above). This is due to BigQuery’s fair resource sharing and dynamic optimization for each step of the query. So, if the average runtime is not impacted, you can continue to use the same capacity (or fixed slots). However, you need to monitor and ensure that the average runtime is not dropping below the acceptable SLA.
Increased slot capacity: If you need the same or better runtime, and higher throughput, for workloads with more concurrent queries than you would need more slots. The chart shows how providing more slots results in more throughput for the same number of concurrent queries.
Scaling run-time with slots
BigQuery’s query runtime depends on the four main factors: the number of slots, the number of concurrent queries, the amount of data scanned and the complexity of the query. Increasing the number of slots results in a faster runtime, so long as the query work can continue to be parallelized. Even if there are additional slots available, if a part of the query cannot be delegated to “free” slots then adding more slots will not make it run faster. In the chart below, you can see that for complex queries the runtime changes from 50 seconds to 20 seconds when you increase slot capacity from 20k to 30k (with 100 concurrent queries).
You can test out your own query runtime and throughput to determine the optimal number of slots to purchase and reserve for certain workloads. Some tips for running BigQuery performance testing are:
Use large datasets, if possible > 50 TB for throughput testing
Use queries of varying complexity
Run jobs with a varying amount of available slots
Use Jmeter for automation (check resources in github)
Create trend reports for:
Avg slot usage and query runtimes
Number of concurrent queries
Throughput (how many queries complete over X duration of time)
Slot utilization (total slot usage / total available capacity for X duration of time)
Avg. wait time
Load slots estimation workflow
If you are looking for guaranteed SLAs and better performance with your data ingestion, we recommend creating dedicated reservations for your load jobs. Estimating slots required for loading data is easy with this publicly available load slot calculator and the following estimation workflow.
The following factors need to be considered to get load slot estimations:
Dataset size
Dataset Complexity: Number of fields | Number of nested/repeated fields
Data Format/ Conversion: Thrift LZO | Parquet LZO | Avro
Table Schema: Is the table Partitioned or Clustered?
Load frequency: Hourly | Daily | Every n-hours
Load SLA: 1 hour for hourly partition loads | 4 hours for daily/snapshot loads
Historical Load Throughput: Estimated data size loaded per 2K slots per day
Automation tips
Optimization with flex slots
Consider a scenario with a compute project that has spikes in analysis during the last five days of every month, something common in many financial use cases. This is a predictable compute resource needed for a short duration of time. In contrast, there could be spikes on completely ad-hoc and non-seasonal workloads. The following automation can be applied to optimize cost and resource utilization without paying for peak usage for the long commitment periods.
At t0 to t1 everything is good. We are hitting SLAs, and we’re paying no more than we need. But from t1 to t3 is our peak load time. If we size to a steady state during peak demand, performance suffers, and SLAs are missed. If we size to peak, we can make SLAs, but we pay too much when off-peak.
A better solution would be to monitor for a rise in slot consumption and purchase flex slots, either using the Reservation API or Data Control statements (DCL), then assign the slots to the necessary resources. You can use quota settings, automate the end-to-end flex slots cycle with alerts that trigger the flex slot purchase. For more details, check out this Practical Example for leveraging alerts and an example of putting everything together as a flow.
Take action
By default, BigQuery projects are assigned to the on-demand pricing model, where you pay for the amount of bytes scanned. Using BigQuery Reservations, you can switch to flat-rate pricing by purchasing commitments. Commitments are purchased in units of BigQuery slots. The cost of all bytes processed is included in the flat-rate price. Key benefits of using BigQuery Reservations include:
Predictability: Flat-rate pricing offers predictable and consistent costs. You know up-front what you are spending.
Flexibility: You choose how much capacity to purchase. You are billed a flat rate for slots until you delete the capacity commitment. You can also combine both the billing models!
Commitment discounts: BigQuery offers flat-rate pricing at a discounted rate if you purchase slots over a longer duration of time (monthly, annual).
Workload management: Slot commitments can be further bucketed into reservations and assigned to BigQuery resources to provide dedicated capacity for various workloads, while allowing seamless sharing of any unused slots across workloads.
Centralized purchasing: You can purchase and allocate slots for your entire organization. You don’t need to purchase slots for each project that uses BigQuery.
Automation: By leveraging flex slots for seasonal spikes or ad-hoc demand rise, you can manage capacity to scale in need. Additionally, you can automate the entire process!
With capacity planning in the works, it is important that you also have a framework in place for on-going monitoring of slots for continuous optimization and efficiency improvements. Check out this blog for a deep-dive on leveraging the INFORMATION_SCHEMA and use this data studio dashboard, or this Looker block, as a monitoring template.
Hopefully you’ve been following along with our BigQuery Admin series and are well on your way to getting ramped up with BigQuery. Now that you’re equipped with the fundamentals, let’s talk about something that’s relevant for all data professionals – data governance.
What does data governance mean?
Data governance is everything you do to ensure your data is secure, private, accurate, available, and usable inside of BigQuery. With good governance, everyone in your organization can easily find – and leverage – the data they need to make effective decisions. All while minimizing the overall risk of data leakage or misuse, and ensuring regulatory compliance.
BigQuery security features
Because BigQuery is a fully-managed service, we take care of a lot of the hard stuff for you! Like we talked about in our post on BigQuery Storage Internals, BigQuery data is replicated across data centers to ensure reliability and availability. Plus data is always encrypted at rest. By default, we’ll manage encryption keys for you. However, you have the option to leverage customer managed encryption keys, by using Cloud KMS to automatically rotate and destroy encryption keys.
You can also leverage Google Virtual Private Cloud (VPC) Service Controls to restrict traffic to BigQuery. When you correctly apply these controls, unauthorized networks can’t access BigQuery data, and data can’t be copied to unauthorized Google Cloud projects. Free communication can still occur within the perimeter, but communication is restricted across the perimeter.
Aside from leveraging BigQuery’s out-of-the-box security features, there are also ways to improve governance from a process perspective. In this post, we’ll walk you through the different tactics to ensure data governance at your organization.
Dataset onboarding: Understanding & classifying data
Data governance starts with dataset onboarding. Let’s say you just received a request from someone on your eCommerce team to add a new dataset that contains customer transactions. The first thing you’ll need to do is understand the data. You might start by asking questions like these:
What information does this contain?How will it be used to make business decisions?Who needs access to this data?Where does the data come from, and how will analysts get access to it in BigQuery?
Understanding the data helps you make decisions on where the new table should live in BigQuery, who should have access to this data, and how you’ll plan to make the data accessible inside of BigQuery (e.g. leveraging an external table, batch loading data into native storage, etc.).
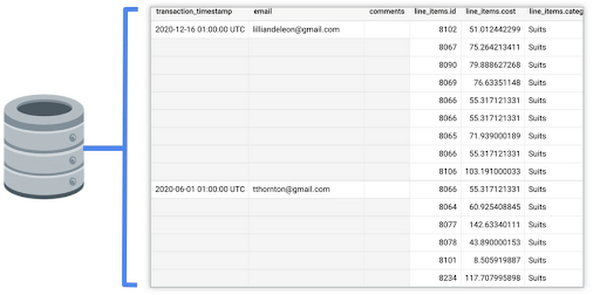
For this example, the transactions live in an OLTP database. Let’s take a look at what information is contained in the existing table in our database. Below, we can see that this table has information about the order (when it was placed, who purchased it, any additional comments for the order), and details on the items that were purchased (the item ID, cost, category, etc.).
Click to enlarge
Now that we have an idea of what data exists in the source, and what information is relevant for the business, we can determine which fields we need in our BigQuery table and what transformations are necessary to push the data into a production environment.
Classifying information
Data classification means that you are identifying the types of information contained in the data, and storing it as searchable metadata. By properly classifying data you can make sure that it’s handled and shared appropriately, and that data is discoverable across your organization.
Since we know what the production table should look like, we can go ahead and create an empty BigQuery table, with the appropriate schema, that will house the transactions.
As far as storing metadata about this new table, we have two different options.
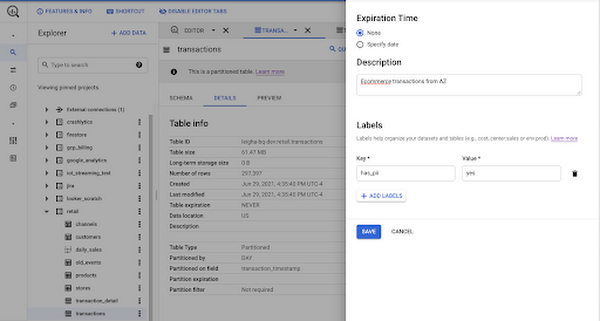
Using labels
On the one hand, we can leverage labels. Labels can be used on many BigQuery resourcesincluding Projects, Datasets and Tables. They are key:value pairs and can be used to filter data in Cloud Monitoring, or can be used in queries against the Information Schema to find data that pertains to specific use cases.
Click to enlarge
Although labels provide logical segregation and management of different business purposes in the Cloud ecosystem, they are not meant to be used in the context of data governance. Labels cannot specify a schema, and you can’t apply them to specific fields in your table. Labels cannot be used to establish access policies or track resource hierarchy.
It’s pretty clear that our transactions table may contain personally identifiable information (PII). Specifically, we may want to mark the email address column as “Has_PII” : True. Instead of using labels on our new table, we’ll leverage Data Catalog to establish a robust data governance policy, incorporating metadata tags on BigQuery resources and individual fields.
Using data catalog tags
Data Catalog is Google Cloud’s data discovery and metadata management service. As soon as you create a new table in BigQuery, it is automatically discoverable in Data Catalog. Data Catalog tracks all technical metadata related to a table, such as name, description, time of creation, column names and datatypes, and others.
In addition to the metadata that is captured through the BigQuery integration, you can create schematized tagsto track additional business information. For example, you may want to create a tag that tracks information about the source of the data, the analytics use case related to the data, or column-level information related to security and sharing. Going back to that email column we mentioned earlier, we can simply attach a column-level governance tag to the field and fill out the information by specifying that email_address is not encrypted, it does contain PII, and more specifically it contains an email address.
While this may seem like a fairly manual process, Data Catalog has a fully equipped API which allows for tags to be created, attached and updated programmatically. With tags and technical metadata captured in a single location, data consumers can come to Data Catalog and search for what they need.
Ingesting & staging data
With metadata for the production table in place, we need to focus on how to push data into this new table. As you probably know, there are lots of different ways to pre-process and ingest data into BigQuery. Often customers choose to stage data in Google Cloud Services to kick off transformation, classification or de-identification workflows. There are two pretty common paths for staging data for batch loading:
Stage data in a Google Cloud storage bucket: Pushing data into a Google Cloud storage bucket before directly ingesting it into BigQuery offers flexibility in terms of data structure and may be less expensive for storing large amounts of information. Additionally, you can easily kick off workflows when new data lands in a bucket by using PubSub to trigger transformation jobs. However, since transformations will happen outside of the BigQuery service, data engineers will need familiarity with other tools or languages. Blob storage also makes it difficult to track column-level metadata.Stage data in a BigQuery staging container: Pushing data into BigQuery gives you the opportunity to track metadata for specific fields earlier in the funnel, through BigQuery’s integration with Data Catalog. When running scan jobs with Data Loss Prevention (we’ll cover this in the next section), you can leave out specific columns and store the results directly in the staging table’s metadata inside of Data Catalog. Additionally, transformations to prepare data for production can be done using SQL statements, which may make them easier to develop and manage.
Identifying (and de-identifying) sensitive information
One of the hardest problems related to data governance is identifying any sensitive information in new data. Earlier we talked through tracking known metadata in Data Catalog, but what happens if we don’t know if data contains any sensitive information? This might be especially useful for free-form text fields, like the comments field in our transactions. With the data staged in Google Cloud, there’s an opportunity to programmatically identify any PII, or even remove sensitive information from the data, using Data Loss Prevention (DLP).
You can also use the DLP API to de-identify data. For example, we may want to replace any instances of names, email addresses and locations with an asterisk (“*”). In our case, we can leverage DLP specifically to scan the comments column from our staging table in BigQuery, save the results in Data Catalog, and, if there are instances of sensitive data, run a de-identification workflow before pushing the sanitized data into the production table. Note that building a pipeline like the one we’re describing does require the use of some other tools.
Google Cloud as a whole leverages Identity Access Management (IAM) to manage permissions across cloud resources. With IAM, you manage access control by defining who (identity) has what access (role) for which resource. BigQuery, like other Google Cloud resources, has several predefined roles. Or you can create custom roles based on more granular permissions.
In our retail use case, we have one project for each team. Each team’s Google Group would be granted the BigQuery Data Viewer role to access information stored in their team’s project. However, there may be cases where someone from the ecommerce team needs data from a different project – like the product development team project. One way to grant limited access to data is through the use of authorized views.
Protecting data with authorized views
Giving a view access to a dataset is also known as creating an authorized view in BigQuery. An authorized view allows you to share query results with particular users and groups without giving them access to the underlying source data. So in our case, we can simply write a query to grab the pieces of information the ecommerce team needs to effectively analyze the data and save that view into the existing ecommerce project that they already have access to.
Column-level access policies
Aside from controlling access to data using standard IAM roles, or granting access to query results through authorized views, you also can leverage BigQuery’s column-level access policies. For example, remember that email address column we marked as containing PII earlier in this post? We may want to ensure that only members with high-security level clearance have access to query those columns. We can do this by:
Aside from restricting access to certain fields in our new table, we may want to only grant users access to rows that are relevant to them. One example may be if analysts from different business units only get access to rows that represent transactions for that business unit. In this case, the Google Group that represents the Activewear Team should only have access to orders that were placed on items categorized as “Active”. In BigQuery, we can accomplish this by creating a row-level access policy on the transactions table.
At the end of the day, you can achieve your goal of securing data using one or more of the concepts we discussed earlier. Authorized Views add a layer of abstraction to sharing data by providing the necessary information to certain users without giving them direct access to the underlying dataset. For cases where you want to transform (e.g. pre-aggregate before sharing) – authorized views are ideal. While authorized views can be used for managing column-level access, it may be preferable to leverage Data Catalog as you can easily centralize access knowledge in a single table’s metadata and control access through hierarchical taxonomies. Similarly, leveraging row level access policies, instead of authorized views to filter out rows, may be preferable in cases where it is easier to manage a single table with multiple access policies instead of multiple authorized views in different places.
Monitoring data quality
One last element of data governance that we’ll discuss here is monitoring data quality. The quality of your BigQuery data can drop for many different reasons – maybe there was a problem in the data source, or an error in your transformation pipeline. Either way, you’ll want to know if something is amiss and have a way to inform data consumers at your organization. Just like we described earlier, you can leverage an orchestration tool like Cloud Composer to create pipelines for running different SQL validation tests.
Validation tests can be created in a few different ways:
One option is to leverage open source frameworks, like this one that our professional services team put together. Using frameworks like these, you can declare rules for when validation tests pass or failSimilarly, you can use a tool like Dataform – which offers the ability to leverage YAML files to declare validation rules. Dataform recently came under the Google Cloud umbrella and will be open to new customers soon, join the waitlist here!Alternatively, you could always roll your own solution by programmatically running queries using built in BigQuery functionality like ASSERT, if the assertion is not valid then BigQuery will return an error that can inform the next step in your pipeline
Based on the outcome of the validation test, you can have Composer send you a notification using Slack or other built-in-notifiers. Finally, you can use Data Catalog’s API to update a tag that tracks the data quality for the given table. Check out some example code here! With this information added to Data Catalog, it becomes searchable by data consumers at your organization so that they can stay informed on the quality of information they use in their analysis.
What’s next?
One thing that we didn’t mention in this post, but is certainly relevant to data governance, is ongoing monitoring around usage auditing and access policies. We’ll be going into more details on this in a few weeks when we cover BigQuery monitoring as a whole. Be sure to keep an eye out for more in this series by following me on LinkedIn and Twitter!
Last year, we released the Pub/Sub to Splunk Dataflow template to help customers easily and reliably export their high-volume Google Cloud logs and events into their Splunk Enterprise environment or their Splunk Cloud on Google Cloud (now in Google Cloud Marketplace). Since launch, we have seen great adoption across both enterprises and digital natives using the Pub/Sub to Splunk Dataflow to get insights from their Google Cloud data.
Pub/Sub to Splunk Dataflow template used to export Google Cloud logs into Splunk HTTP Event Collector (HEC)
We have been working with many of the users to identify and add new capabilities that not only addresses some of the feedback but also reduces the effort to integrate and customize the Splunk Dataflow template.
Here’s the list of feature updates which are covered in more detail below:
The theme behind these updates is to accelerate time to value (TTV) for customers by reducing both operational complexity on the Dataflow side and data wrangling (aka knowledge management) on the Splunk side.
We have a reliable deployment and testing framework in place and confidence that it [Splunk Dataflow pipeline] will scale to our demand. It’s probably the best kind of infrastructure, the one I don’t have to worry about. Lead Cloud Security Engineer Life Sciences company on Google Cloud
We want to help businesses spend less time on managing infrastructure and integrations with third-party applications, and more time analyzing their valuable Google Cloud data, be it for business analytics, IT or security operations. “We have a reliable deployment and testing framework in place and confidence that it will scale to our demand. It’s probably the best kind of infrastructure, the one I don’t have to worry about.” says the lead Cloud Security Engineer of a major Life Sciences company that leverages Splunk Dataflow pipelines to export multi-TBs of logs per day to power their critical security operations.
To take advantage of all these features, make sure to update to the latest Splunk Dataflow template (gs://dataflow-templates/latest/Cloud_PubSub_to_Splunk), or, at the time of this writing, version 2021-08-02-00_RC00 (gs://dataflow-templates/2021-08-02-00_RC00/Cloud_PubSub_to_Splunk) or newer.
More compatibility with Splunk
“All we have to decide is what to do with the time that is given us.”
— Gandalf
For Splunk administrators and users, you now have more time to spend analyzing data, instead of parsing and extracting logs & fields.
Splunk Add-on for Google Cloud Platform
By default, Pub/Sub to Splunk Dataflow template forwards only the Pub/Sub message body, as opposed to the entire Pub/Sub message and its attributes. You can change that behavior by setting template parameter includePubsubMessage to true, to include the entire Pub/Sub message as expected by Splunk Add-on for GCP.
However, in prior versions of Splunk Dataflow template, in the case of includePubsubMessage=true, Pub/Sub message body was stringified and nested under the field message, whereas Splunk Add-on expected a JSON object nested under data field.
Message body stringified prior to Splunk Dataflow version 2021-05-03-00_RC00
This led customers to either customize their Splunk Add-on configurations (via props & transforms) to parse the payload, or use spath to explicitly parse JSON, and therefore maintain two flavors of Splunk searches (via macros) depending on whether data was pushed by Dataflow or pulled by Add-on…far from ideal experience. That’s no longer necessary as Splunk Dataflow template now serializes messages in a manner compatible with Splunk Add-on for GCP. In other words, the default JSON parsing, built-in Add-on fields extractions and data normalization work out-of-the-box:
Message body as JSON payload as of Splunk Dataflow version 2021-05-03-00_RC00
Customers can readily take advantage of all the sourcetypes in Splunk Add-on including Common Information Model (CIM) compliance. Those CIM models are required for compatibility with premium applications like Splunk Enterprise Security (ES) and IT Service Intelligence (ITSI) without any extra effort on the customer, as long as they have set includePubsubMessage=true in their Splunk Dataflow pipelines.
Note on updating existing pipelines with includePubsubMessage:
If you’re updating your pipelines from includePubsubMessage=false to includePubsubMessage=true and you are using a UDF function, make sure to update your UDF implementation since the function’s input argument is now the PubSub message wrapper rather that the underlying message body, that is the nested data field. In your function, assuming you save the JSON-parsed version of the input argument in obj variable, the body payload is now nested in obj.data. For example, if your UDF is processing a log entry from Cloud Logging, a reference to obj.protoPayload needs to be updated to obj.data.protoPayload.
Splunk HTTP Event Collector
We also heard from customers who wanted to use Splunk HEC ‘fields’ metadata to set custom index-time field extractions in Splunk. We have therefore added support for that last remaining Splunk HEC metadata field. Customers can now easily set these index-time field extractions on the sender side (Dataflow pipeline) rather than configuring non-trivial props & transforms on the receiver (Splunk indexer or heavy forwarder). A common use case is to index metadata fields from Cloud Logging, namely resource labels such as project_id and instance_id to accelerate Splunk searches and correlations based on unique Project IDs and Instance IDs. See example 2.2 under ‘Pattern 2: Transform events’ in our blog about getting started with Dataflow UDFs for a sample UDF on how to set HEC fields metadata using resource.labels object.
More extensibility with utility UDFs
“I don’t know, and I would rather not guess.”
— Frodo
For Splunk Dataflow users who want to tweak the pipeline’s output format, you can do so without knowing Dataflow or Apache Beam programming, or even having a developer environment setup. You might want to enrich events with additional metadata fields, redact some sensitive fields, filter undesired events, or set Splunk metadata such as destination index to route events to.
When deploying the pipeline, you can reference a user-defined function (UDF), that is a small snippet of JavaScript code, to transform the events in-flight. The advantage is that you configure such UDF as a template parameter, without changing, re-compiling or maintaining the Dataflow template code itself. In other words, UDFs offer a simple hook to customize the data format while abstracting low-level template details.
When it comes to writing a UDF, you can eliminate guesswork by starting with one of the utility UDFs listed in Extend your Dataflow template with UDFs. That article also includes a practical guide on testing and deploying UDFs.
More reliability and error handling
“The board is set, the pieces are moving. We come to it at last, the great battle of our time.”
— Gandalf
Last but not least, the latest Dataflow template improves pipeline fault tolerance and provides a simplified Dataflow operator troubleshooting experience.
In particular, Splunk Dataflow template’s retry capability (with exponential backoff) has been extended to cover transient network failures (e.g. Connection timeout), in addition to transient Splunk server errors (e.g. Server is busy). Previously, the pipeline would immediately drop these events in the dead-letter topic. While this avoids data loss, it added unnecessary burden for the pipeline operator who is responsible to replay these undelivered messages stored in the dead-letter. The new Splunk Dataflow template minimizes this overhead by attempting retries whenever possible, and only dropping messages into the dead-letter topic when it’s a persistent issue (e.g. Invalid Splunk HEC token), or when the maximum retry elapsed time (15 min) has expired. For a breakdown of possible Splunk delivery errors, see Delivery error types in our Splunk Dataflow reference guide.
Finally, as more customers adopt UDFs to customize the behavior of their pipelines per previous section, we’ve invested in better logging for UDF-based errors such as JavaScript syntax errors. Previously, you could only troubleshoot these errors by inspecting the undelivered messages in the dead-letter topic. You can now view these errors in the worker logs directly from the Dataflow job page in Cloud Console. Here’s an example query you can use in Logs Explorer:
You can also set up an alert policy in Cloud Monitoring to alert you whenever such UDF error happens so you can review the message payload in the dead-letter topic for further inspection. You can then either tweak the source log sink (if applicable) to filter out these unexpected logs, or revise your UDF function logic to properly handle these logs.
What’s next?
“Home is behind, the world ahead, and there are many paths to tread through shadows to the edge of night, until the stars are all alight.”
— J. R. R. Tolkien
We hope this gives you a good overview of recent Splunk Dataflow enhancements. Our goal is to minimize your operational overhead for logs aggregation & export, so you can focus on getting real-time insights from your valuable logs.
Be sure to keep an eye out for more Splunk Dataflow enhancements in our GitHub repo for Dataflow Templates. Every feature covered above is customer-driven, so please continue to submit your feature requests as GitHub repo issues, or directly from your Cloud Console as support cases.
Acknowledgements
Special thanks to Matt Hite from Splunk both for his close collaboration in product co-development, and for his partnership in serving joint customers.
Machine Learning is a branch of Artificial Intelligence that works by giving computers the ability to learn without being explicitly programmed. Machine Learning is already being used in many aspects of our life, from recommending movies or music based on past preferences to giving doctors’ advice on relevant treatments for their patients.
As technology advances, machine learning will have more opportunities to help businesses engage with their customers and improve the overall customer experience. Machine learning programs can be trained on large sets of data, such as customer reviews and feedback, to identify patterns and make predictions about future behaviors.
In this article we will explore how you can use machine learning to potentially change and encourage reviews, which we know affects consumer purchasing decisions.
If we train a machine learning program on this data set, it will be able to predict whether or not someone is likely to leave positive reviews. If the program predicts that someone is likely to leave a positive review, we can send them an email encouraging them to do so.
This is only one way you could use machine learning for this purpose. You can analyze different aspects of a purchase order and make changes based on what will be best for your company’s bottom line.
How to Set Up Machine Learning for Review-Related Goals
In order to set up a machine learning program, you need three things:
A large sample of data from successful customers who followed through with the goal you want your new machine learning program to achieve;The right analytical tools that can work with this type of data; andAccess to the right data scientists who understand these analytical tools and are able to train your program.
If you don’t have all three things, consider partnering with a marketing firm that specializes in machine learning like broadly.com to help you through the process.
Machine Learning for Review Research
There are many ways that machine learning can be used for research related to reviews. Machine learning can be used to identify trends in the data, such as what types of reviews get more clicks on a website.
In addition, machine learning is increasingly being used for “sentiment analysis” – determining what the sentiment of a review is (positive, negative, or neutral).
If you have some data that’s already been manually labeled with sentiment, machine learning is a fast and accurate way to do additional research and identify larger trends.
Machine Learning and Sentiment Analysis
The two most common ways to use an off-the-shelf machine learning system for sentiment analysis are: Training your own model from scratch; or accessing an API call on a third-party sentiment analysis system. Both of these options will work if you have the data required to train an accurate model.
Training your own model is faster, but it can take time and resources that smaller companies might not have. Using a third-party API is fast, but the results are often lower quality than they would be with a custom-trained model.
Using Machine Learning to Improve Reviews
Once you have a machine learning program set up, there are several ways you can use it to improve the reviews your business gets.
Here are three simple examples of how to use machine learning in everyday life:
Remove or reward positive reviews;Featurize negative reviews into marketing assets; andIdentify which customer segments are most likely to leave negative reviews.
Removing or Rewarding Positive Reviews
One simple way machine learning can be used in everyday life is by rewarding positive reviews. If we train our program on the existing data set, we can predict which reviews are most likely to be positive. Then, for example, we could automatically add a thank-you note to the review and offer the reviewer a discount code for their next purchase.
This increases the likelihood of them leaving another positive review about this product in their next transaction… and it helps build trust with customers who may be the reviewers of the future.
Turning Negative Reviews into Marketing Assets
Another way machine learning can be used is by turning negative reviews into marketing assets. If your program analyzes a product review and determines that it’s largely positive, you could automatically turn this review into a blog post to help bring more traffic to your website. This process works well for a few reasons: It’s a high-quality review that can be transformed into valuable content; and only one or two sentences would need to be changed, keeping the rest of the wording exactly as it is.
Identifying Which Customer Segments Are Most Likely to Leave Negative Reviews
The last way machine learning can be used in everyday life is by identifying which customer segments are most likely to leave negative reviews. If you have enough data, you could train your program on the existing positive and negative reviews to figure out if there’s an algorithm that can accurately predict whether a review will be positive or negative based on who they are (such as what products they’ve purchased in the past, what customer segment they belong to, and so on).
If you were able to identify this algorithm, you could automatically pre-emptively reach out to the customers who are most likely to leave a negative review as soon as they purchase an item. This would allow your business to either steer them away from your products or provide extra assistance before any problems arise.
Conclusion
Machine learning and sentiment analysis is a fast and accurate way to do additional research and identify larger trends. This is one of the many ways that they are improving our lives. Whether you’re selling a product online or running a brick-and-mortar business, these behavioral neuroscience principles will work for you. They’ll help drive more visitors into your marketing funnel and convert casual visits into sales.
While it might sound ironic that high-tech fields such as data science still require you to submit a resume, even the most cursory look over a list of job openings should prove this to be true. Managers and HR department staffers in even the most technically-oriented companies are actually on the lookout for candidates with an impressive resume. This might encourage some applicants to stretch the truth.
If you’re applying for a job in the IT or data science spaces, then you don’t want to do this. Consider adding statistics and other data points about your previous job, even if you don’t have exact numbers. This will give you the freedom to promote yourself as an expert without ever suggesting something that’s untrue.
Why Truth is So Important in Data Science Resumes
Human resources directors might not be directly related to the technology resources of most of the firms they represent, but that doesn’t mean they can’t leverage the same tools everyone else in said firms rely on. That means they’ll spot a lie, so you want to go over everything in your resume to make sure you were telling the truth.
That being said, the ideal length of a resume is somewhere around 475-600 words, so you shouldn’t feel like you’re under any pressure to put filler in there. Short and sweet rules the day, especially when you think about how many resumes some reviewers have to look through a day. While apps are indeed used to automatically process resumes and prevent any personal biases from leaking into the review process, the final decisions are still made by humans at even the leading data science firms.
As a result, you want to be concise as well as truthful. Perhaps most importantly, you want to present your information in a way that makes sense for the type of job you’re applying for.
Formatting Your Resume in the Preferred Way
Relatively few companies use automated resume application processes for professional employees. These are generally deployed only at facilities that expect a large degree of turnover, such as a retail operation. Anyone who is applying for a professional-level career at a place that manages large amounts of information is more than likely going to need to submit an old-fashioned resume.
A growing number of companies are actually asking potential hires to submit their resumes as traditional flat text files, which should be editable with almost any piece of software. Considering that computer professionals tend to be evenly split when it comes to GNU/Linux, Windows and Mac platform face-offs, this is pretty good news. Creating a resume that meets these requirements could be as easy as firing up your favorite notepad application and typing away.
Other organizations are starting to rely more heavily on the Roman Executive format, which first rose to prominence in the legal profession within the last decade or two. This may require you to be more careful when it comes to what sections you include, but you still won’t want to get carried away with employment history.
In fact, some observers feel that industry insiders now care more about skills than they do about the places that you may have worked in the past.
Balancing History with the Present
Chances are that you’ve worked several jobs in the past that don’t have anything to do with the IT or data science fields. While you might want to include these if they’re particularly impressive, you don’t need to write a complete employment history that stretches all the way back to your summer job during high school. Instead, you might want to narrow things down to jobs that show you have a background in data analytics.
You’ll certainly want to include any relevant educational experience or professional certifications that you might have, but more employers these days are probably looking for proof that you know how to do the kind of job that you’re applying for. Consider adding a dedicated technical skills section that spells out all of your various competencies.
While you don’t want to brag or sound shamelessly self-promotional, you should be honest about any area that you personally feel you excel in. Potential employers will expect that you’re able to do anything you put on this list, so be honest, but don’t be afraid to show yourself in the best possible light.
Once you’re done, read things over a few times before you finally submit your resume. Taking a little extra time to proofread can help you catch errors you might not otherwise have found.
BigQuery is a fully-managed enterprise data warehouse that helps you manage and analyze your data with built-in features like machine learning, geospatial analysis, and intelligent caching for business intelligence. To help you make the most of BigQuery, we’re offering the following no cost, on-demand training opportunities:
BigQuery basics
In this training, you’ll learn the basics of BigQuery like how to use the Web UI to query public tables, and how to load sample data into BigQuery from a Cloud Storage Bucket. Get started here.
How to use machine learning with BigQuery
Find out how BigQuery leverages machine learning to automate data quality rules – scanning disparate and dynamic datasets, detecting anomalies, discovering sensitive data – all of which help you improve the quality, accessibility, and governance of your data. Sign up here for this training.
Discover how to use BigQueryML to build forecasting models at scale, plus learn how to schedule model re-training on a regular basis so that your forecasts stay up-to-date when you register here for this training.
Sign up here to find out how to create an end-to-end solution for real-time fraud detection with the help of BigQueryML.
How to connect BigQuery to Looker
Learn how to model, analyze, and visualize your data in less than 30 minutes when you register here for this training. You’ll be taught how to set up a connection between your BigQuery data warehouse and Looker. Once connected, you’ll learn how Looker auto-generates a data model, which you can immediately explore, customize, and reuse. From there, you’ll discover how to build reports, dashboards, plus bring data into your workflows via alerts, integrations, and more.
For more demos on how to use BigQuery and Looker together, sign up here.
What’s next with BigQuery?
To get a peak into product roadmap enhancements and hear from our Product Management Director, Jonathan Keller, about what’s next with BigQuery, register for Next ‘21 and join us for this session on October 12.


